Product reference: Documentation for Honeybadger's user interface (UI) and product features.
# Accounts
> Manage billing and users.
 Accounts are the primary billing entities in Honeybadger. An account is created for you when you first sign up, unless you are signing up as a result of being invited to another user’s account. You can create additional accounts and switch between accounts using the dropdown in the navigation bar. ## Account-wide information [Section titled “Account-wide information”](#account-wide-information) Honeybadger can display information from several projects on an account-wide basis, including the following: * Errors * Uptime Checks * Check-Ins Links to these views are available in the left-hand sidebar. [Status Pages](/guides/status-pages) are also managed at the account level, as they can include uptime checks and check-ins from multiple projects. ## Account settings [Section titled “Account settings”](#account-settings) From the account settings page, you can: * See the current billing subscription * Edit account options * Add & remove users * See past invoices * Change authentication settings * Manage the referral program * Park and delete accounts To learn more about adding, removing, and editing users currently registered to an account and changing the authentication settings, please check out the [User Management](/guides/user-management) page. ## Billing [Section titled “Billing”](#billing) Each account is billed separately based on a chosen subscription plan and has its own payment information. The following changes can be made from the Account Settings page for each account regarding billing: * Subscription plan * Payment information * Business details displayed on invoices A list of invoices for the account is also available from the Account Settings page. ### Changing the subscription plan [Section titled “Changing the subscription plan”](#changing-the-subscription-plan) You can change your subscription plan at any time. When you upgrade, downgrade, or change the payment period for your subscription (switch from monthly to yearly, or vice-versa), your account will be prorated for the difference in cost between the old and new plans. The prorated amount will show up as a credit on your next invoice. When you upgrade to a plan that costs more, the next invoice will be larger than normal, as it will have the prorated charge for the newly-selected plan for the remainder of the current billing period in addition to the full charge for the next billing period. On the payment information page we provide a link that can be used to update the account’s payment information without having to be logged in to Honeybadger. This can be useful if you are managing the account but don’t have access to a company credit card. Alternatively, you can invite additional account owners via the Users tab, and those individuals will be able to update the payment information once logged in. Payment via purchase order/invoice is available to subscribers on any of our Business plans when billed annually. Please \[contact support]\(mailto:support\@honeybadger.io?subject=Payment by invoice) to arrange that. Honeybadger is also available through [AWS Marketplace](/guides/aws-marketplace/), which lets you pay for your subscription through your AWS bill. If you already have a Honeybadger account, we can migrate your data to a new Marketplace-billed account for you. ## Account options [Section titled “Account options”](#account-options) From the account options tab, you can change the account name and the billing contact, as well as adjust whether or not overage billing is enabled. The tech contact email, if provided, will receive notifications from Honeybadger for non-billing-related information. ## Referral program [Section titled “Referral program”](#referral-program) Honeybadger offers a referral program that lets you earn up to 20% of referred customers’ payments as account credits. These credits can reduce your monthly bill—even down to $0. To join the program, navigate to the Referrals tab in your account settings, accept the terms, and share your unique referral link. See the [referral program guide](/resources/referral-program) to learn more about the referral program and how to get started. ## Account parking [Section titled “Account parking”](#account-parking) If you’d like to suspend billing for a while, but you’d also like to preserve all the projects, users, etc. associated with your account, then you can choose to park your account. Doing so will stop all error processing, uptime checks, and check-in monitoring for the projects associated with your account. Un-parking your account will cause billing and all processing to be resumed. ## Deleting your account [Section titled “Deleting your account”](#deleting-your-account) When you choose to delete an account, all the data associated with the account (projects, teams, etc.) will be immediately deleted, and billing will be stopped. There is no undo for this action, so be sure you’re ready before pushing the button!
# AWS Marketplace
> Subscribe to Honeybadger through AWS Marketplace or migrate an existing account to Marketplace billing.
Honeybadger is available through [AWS Marketplace](https://aws.amazon.com/marketplace/), which lets you pay for your subscription through your AWS bill and apply your AWS committed spend toward Honeybadger. ## Subscribing through AWS Marketplace [Section titled “Subscribing through AWS Marketplace”](#subscribing-through-aws-marketplace) 1. Visit the [Honeybadger listing on AWS Marketplace](https://aws.amazon.com/marketplace/pp/prodview-yozbmqhcmlrkm) and subscribe to the plan that fits your needs. 2. Complete the AWS Marketplace signup flow. This creates a new Honeybadger account that is billed through AWS. 3. Sign in to your new Honeybadger account to confirm it was provisioned successfully. If you’re new to Honeybadger, you can start adding projects and team members to your new account right away. If you already have a Honeybadger account that you want to switch to Marketplace billing, see the next section. ## Migrating an existing account to AWS Marketplace [Section titled “Migrating an existing account to AWS Marketplace”](#migrating-an-existing-account-to-aws-marketplace) If you already have a Honeybadger account and want to switch to AWS Marketplace billing, we’ll transfer your projects, users, and historical data to the new Marketplace-billed account for you: 1. Subscribe through AWS Marketplace using the steps above. This creates a new, empty Honeybadger account. 2. [Contact support](mailto:support@honeybadger.io?subject=AWS%20Marketplace%20migration) from the email address associated with your existing account and let us know you’d like to migrate. Include the name of your existing account and the name of your new Marketplace account. 3. We’ll transfer your account settings, projects, team members, and historical data from your existing account to your new Marketplace-billed account. Your existing API keys come along with your projects, so your installed libraries and integrations will continue reporting to Honeybadger without any changes on your end. 4. Once the migration is complete and you’ve verified everything looks right in the new account, you can [close your old account](/guides/accounts/#deleting-your-account). ## Managing your subscription [Section titled “Managing your subscription”](#managing-your-subscription) Once your account is billed through AWS Marketplace, plan changes, cancellations, and payment method updates are managed through AWS Marketplace rather than the Honeybadger account settings page. Invoices and payment history are available in your AWS account.
# Check-ins
> Get notified when cron jobs and scheduled tasks have errors or don't run on time.
Your Honeybadger account comes with check-ins, a way for the processes running on your servers to report that they are alive. Once configured, should a check-in go missing, Honeybadger will send you an alert to let you know that your process has stopped reporting. This is especially useful for monitoring cron jobs, so you can avoid having a cron job silently fail and go unnoticed. 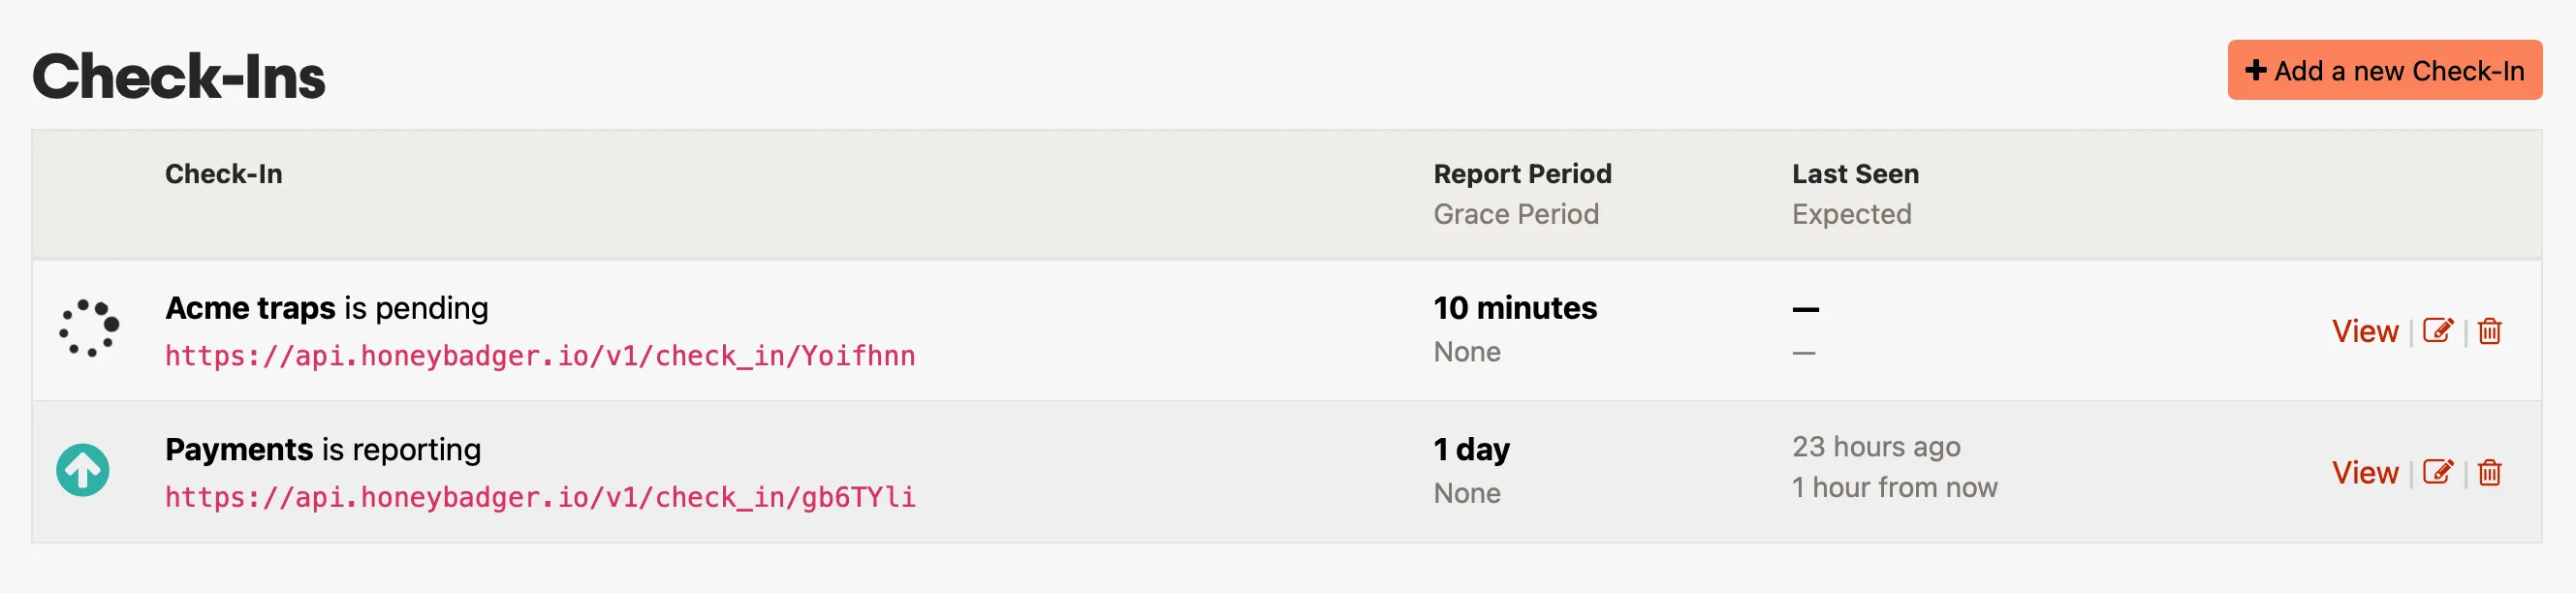 ## Setup [Section titled “Setup”](#setup) When you create a check-in, you’ll configure the following options: 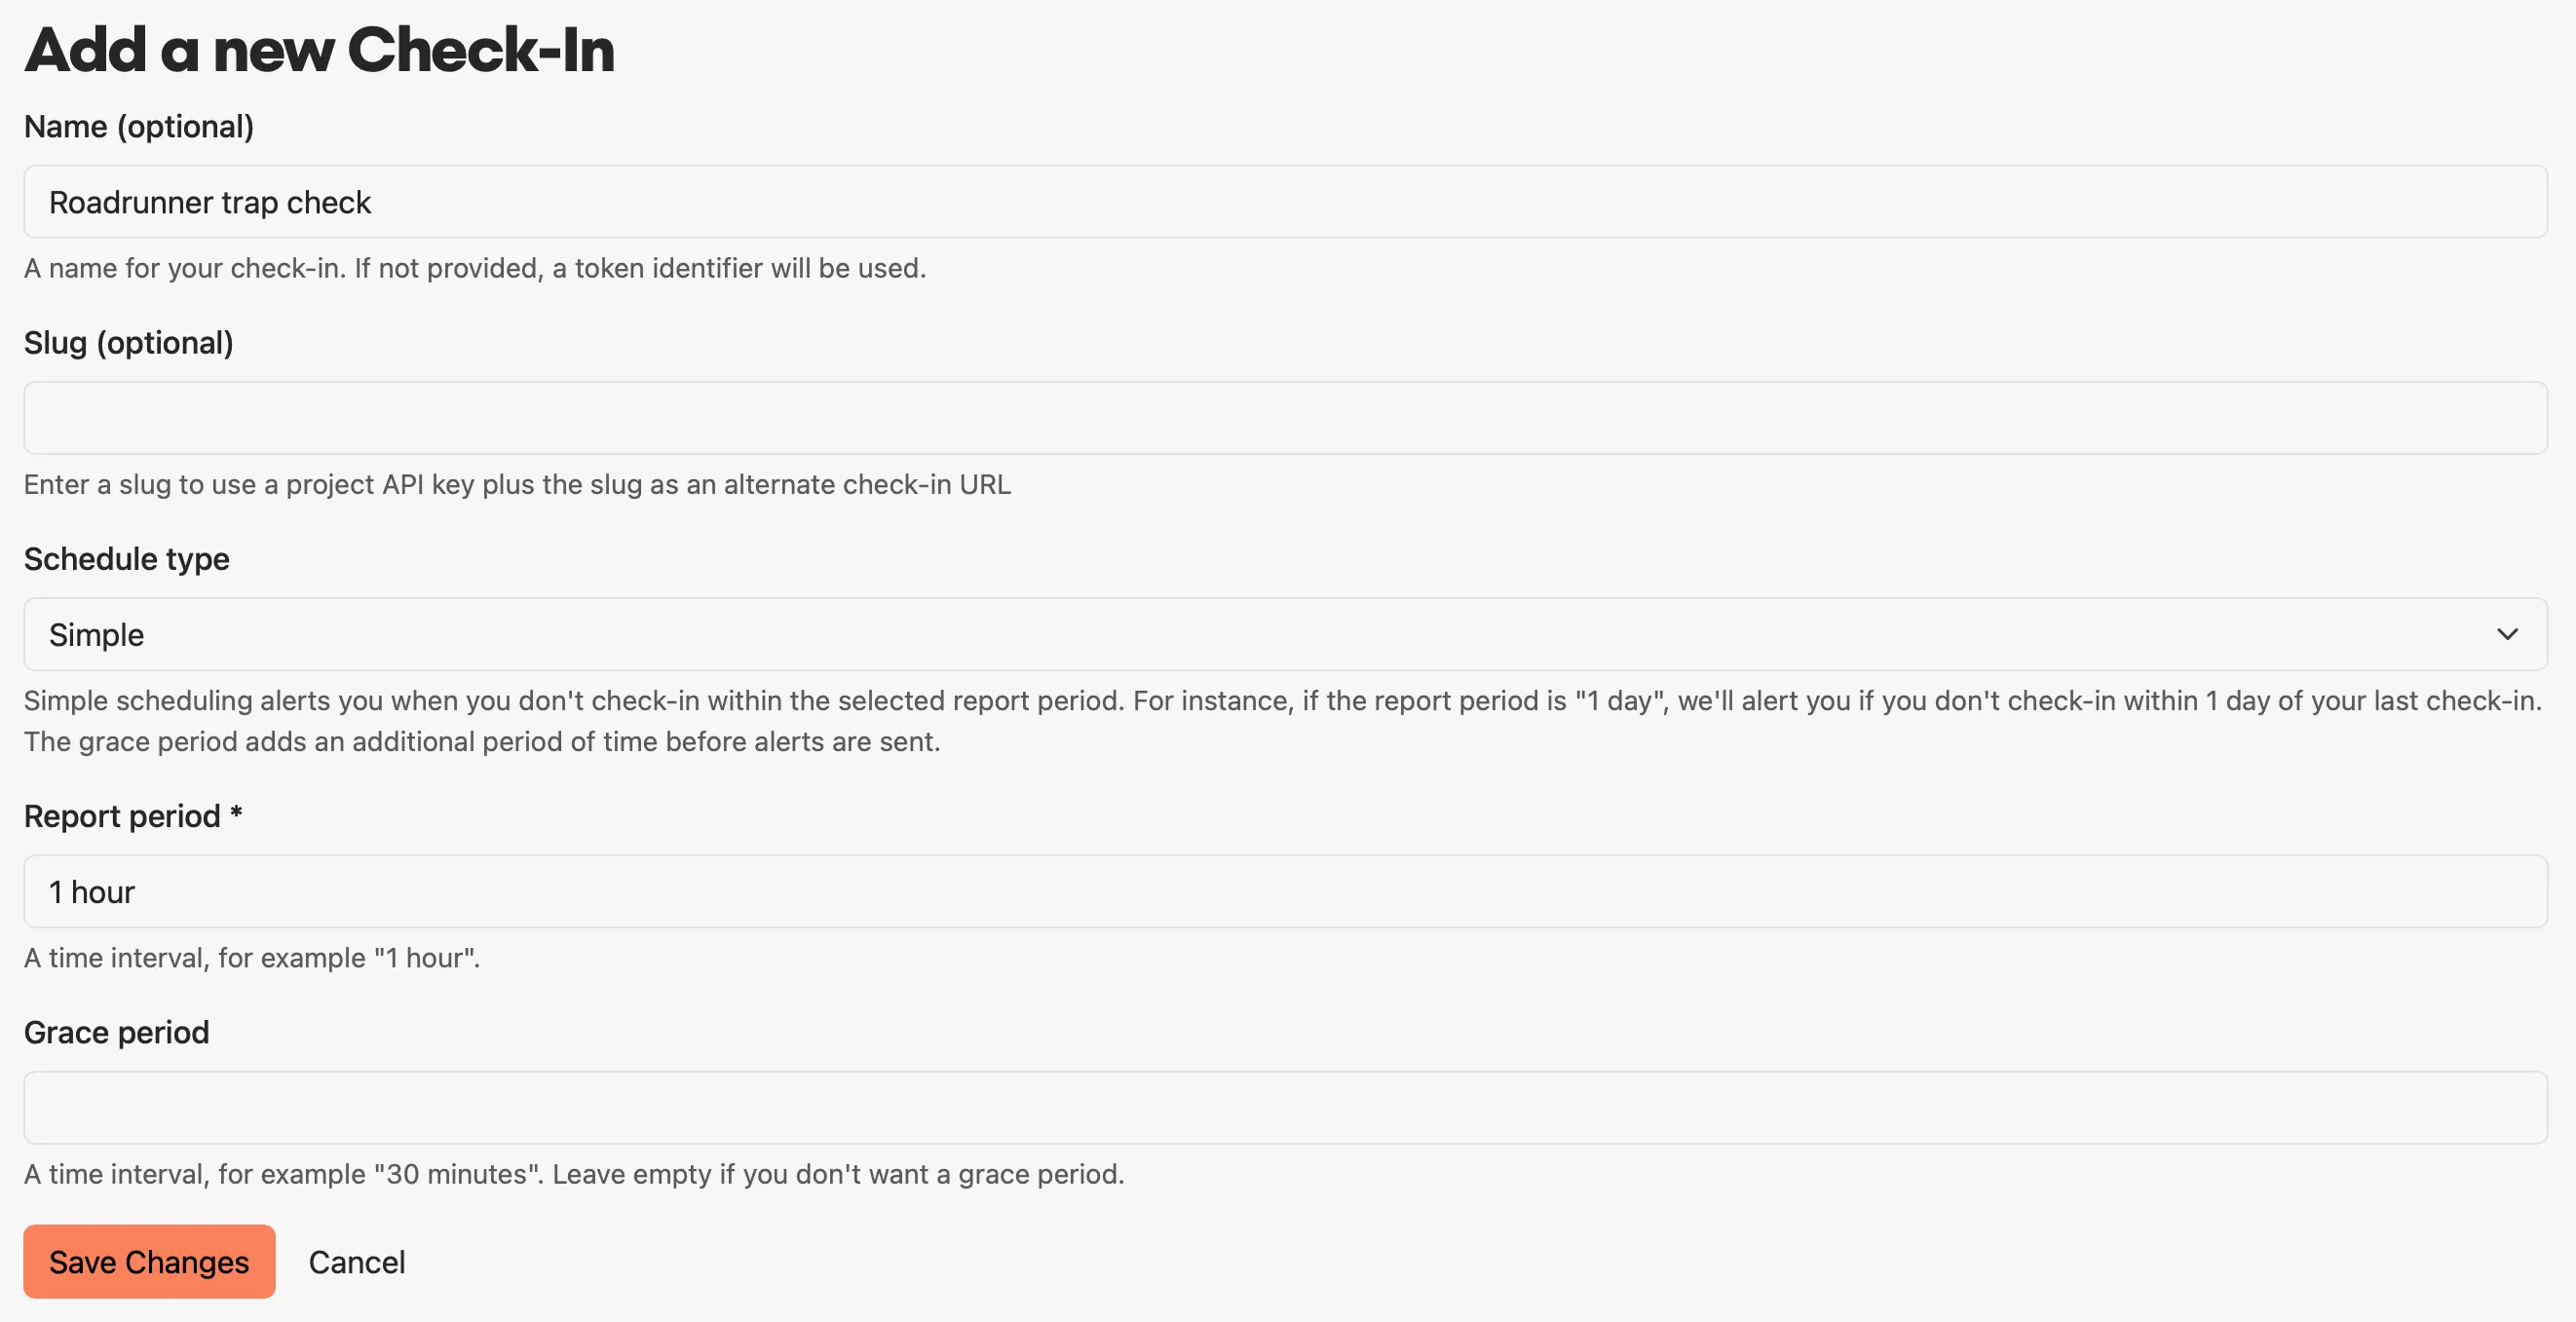 ### Name [Section titled “Name”](#name) A label for your check-in. If not provided, a token identifier will be used. ### Slug [Section titled “Slug”](#slug) An optional human-readable identifier that can be used as an alternate check-in URL. See [Slugs](#slugs) below. ### Schedule type [Section titled “Schedule type”](#schedule-type) Choose **Simple** to check in at a regular interval, or **Cron** to use a cron expression for advanced scheduling. #### Simple [Section titled “Simple”](#simple) Honeybadger will watch the process at an interval you define. ##### Report period [Section titled “Report period”](#report-period) How often you expect the check-in to report (e.g., “1 hour”). #### Cron [Section titled “Cron”](#cron) Cron scheduling allows you to use a cron expression to create an advanced check-in schedule or mirror the cron schedule on your server. ##### Schedule [Section titled “Schedule”](#schedule) The cron expression (e.g., `*/5 * * * *`). ##### Time zone [Section titled “Time zone”](#time-zone) The time zone of the server where cron is running. ### Grace period [Section titled “Grace period”](#grace-period) An optional grace period allows some time for long-running tasks to be completed before Honeybadger sends a notification due to a lack of reporting. For example, if you have a job that reports every hour but can take up to twenty minutes to run, you can specify a grace period of twenty minutes, and Honeybadger will allow up to one hour and twenty minutes to elapse before a notification is sent. ## Reporting [Section titled “Reporting”](#reporting) When you create a new check-in, you’ll get a URL that you can use to report that your process is alive. The easiest way to report a check-in is with [the Honeybadger CLI’s `hb check-in` command](/resources/cli/#check-in):
```sh
@hourly /usr/bin/do_something && hb check-in --id XyZZy
```
Or use `curl` to fetch the check-in URL directly:
```sh
@hourly /usr/bin/do_something && curl https://api.honeybadger.io/v1/check_in/XyZZy &> /dev/null
```
See the [API docs](/api/reporting-check-ins/) for more information about the data you can send when reporting a check-in. You will also get an email address you can use for reporting the status of your process. No subject or body text is required, but the email address *is* case-sensitive:
```sh
@hourly /usr/bin/do_something && echo | mail XyZZy@report.hbchk.in
```
Please note that while these examples use cron, you can trigger check-in reporting from the shell, a scheduled background job, or any other process that can request a URL or send an email. ## Slugs [Section titled “Slugs”](#slugs) A slug is an optional, human-readable identifier for a check-in. When you add a slug, you get an alternate check-in URL that uses the slug and a [project API key](/guides/projects/#api-keys) instead of the check-in ID. This is useful if you don’t want to embed check-in IDs in your code or automated systems. For example, if you specify a slug of `hourly-check`, your alternate check-in URL will look like:
```sh
https://api.honeybadger.io/v1/check_in/hbp_ABC/hourly-check
```
You can add a slug when creating a check-in in the UI, via the [REST API](/api/check-ins/#create-a-check-in), or in a config file using our [PHP/Laravel](/lib/php/guides/configuring-checkins/) and [JavaScript](/lib/javascript/guides/check-ins/) client libraries. ## Payloads [Section titled “Payloads”](#payloads) You can POST a small payload to the UI that includes the results of the command you ran, including the command’s output, exit code, and duration. Please see our [API documentation](/api/reporting-check-ins/#check-in-payloads) for the format of that payload. 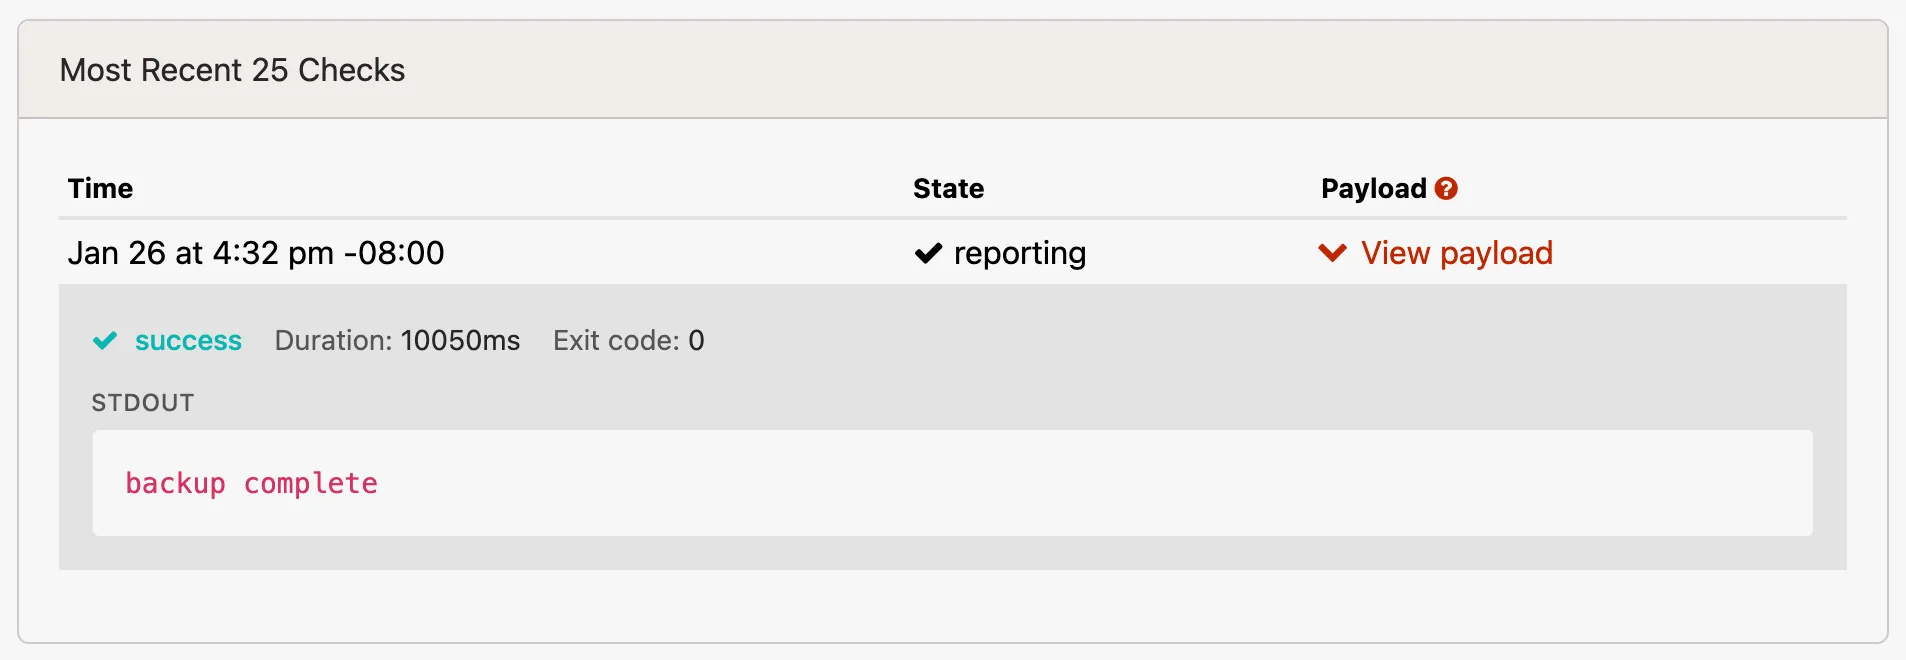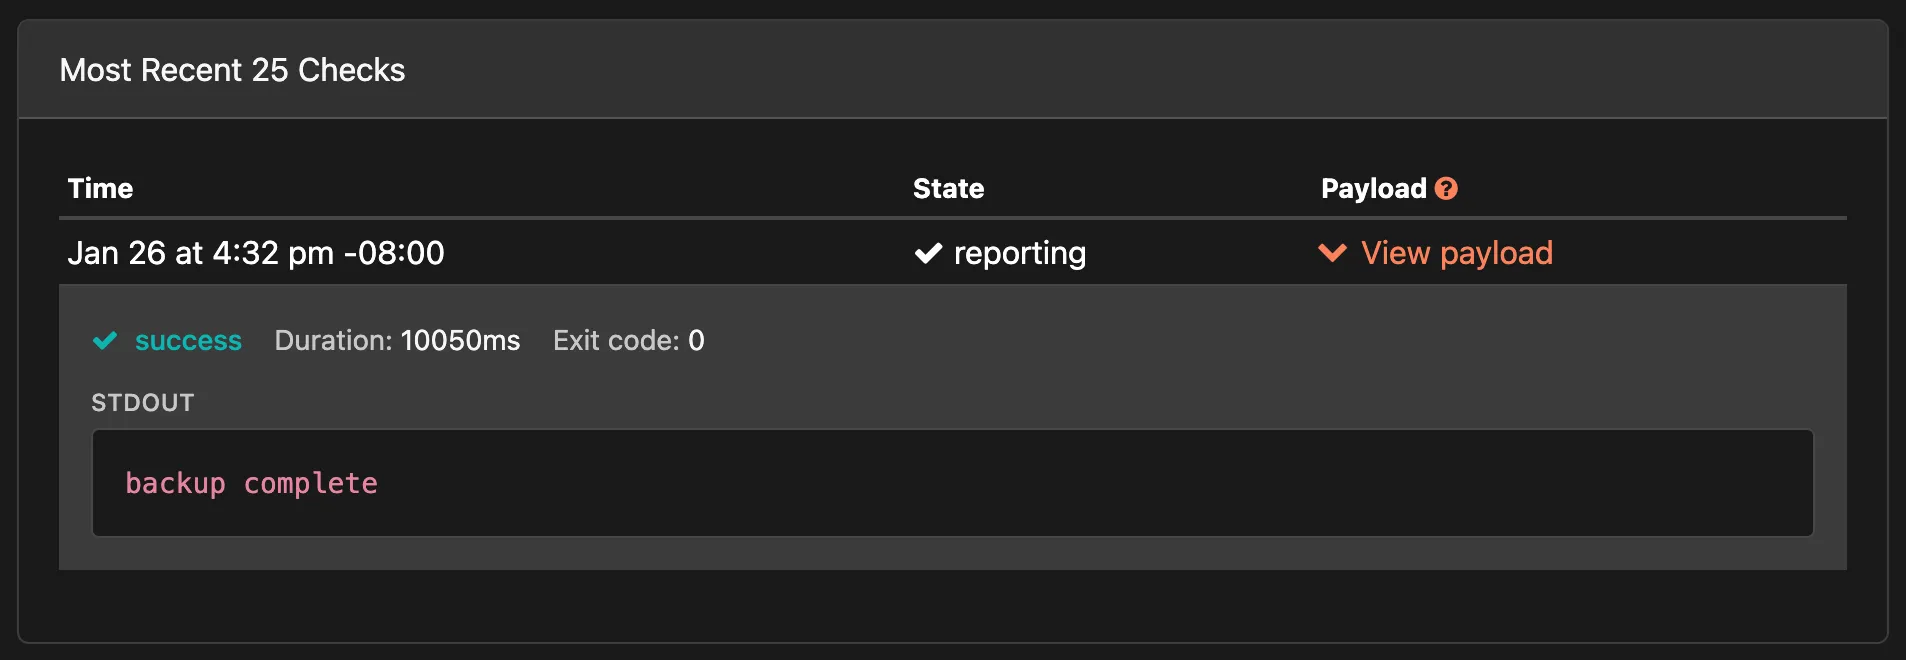 The easiest way to send check-in payloads is to use [the Honeybadger CLI’s `hb run` command](/resources/cli/#run) to wrap your scheduled command:
```shell
hb run --id XyZZy -- /usr/local/bin/backup.sh
```
Or [POST directly to the check-in API](/api/reporting-check-ins/#check-in-payloads) with a JSON payload:
```bash
curl -X POST https://api.honeybadger.io/v1/check_in/XyZZy \
-H "Content-Type: application/json" \
-d '{"check_in": {"status": "success", "duration": 1234, "stdout": "backup completed"}}'
```
You can view the payload data in your check-in history or query it in [Insights](/guides/insights/). ## Notifications [Section titled “Notifications”](#notifications) 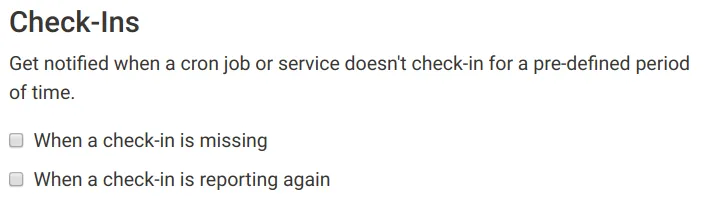 When your check-in goes missing, we’ll notify you with information about which job failed to report on time. You can enable or disable these notifications along with the rest of the notification events in your Personal Alerts or Project Integrations settings. ## Status page integration [Section titled “Status page integration”](#status-page-integration) Check out our [Status Pages](/guides/status-pages/#uptime-checks) feature for information on how to present the status your check-ins to your users.
# Dashboards & APM
> Learn how to use dashboards to display widgets created from Insights queries and visualizations.
Dashboards let you collect your most important [Honeybadger Insights](/guides/insights/) charts and data in one place so you can see what’s happening with your app at a glance. Instead of running queries repeatedly or jumping between pages, dashboards give you a single view of your application’s health and performance, helping you spot trends and fix issues. ## Getting started [Section titled “Getting started”](#getting-started) To create a dashboard, navigate to the *Dashboards* section in your Honeybadger project, click the dashboard selector in the top left, then click the **+** button next to the dashboard you want to add. 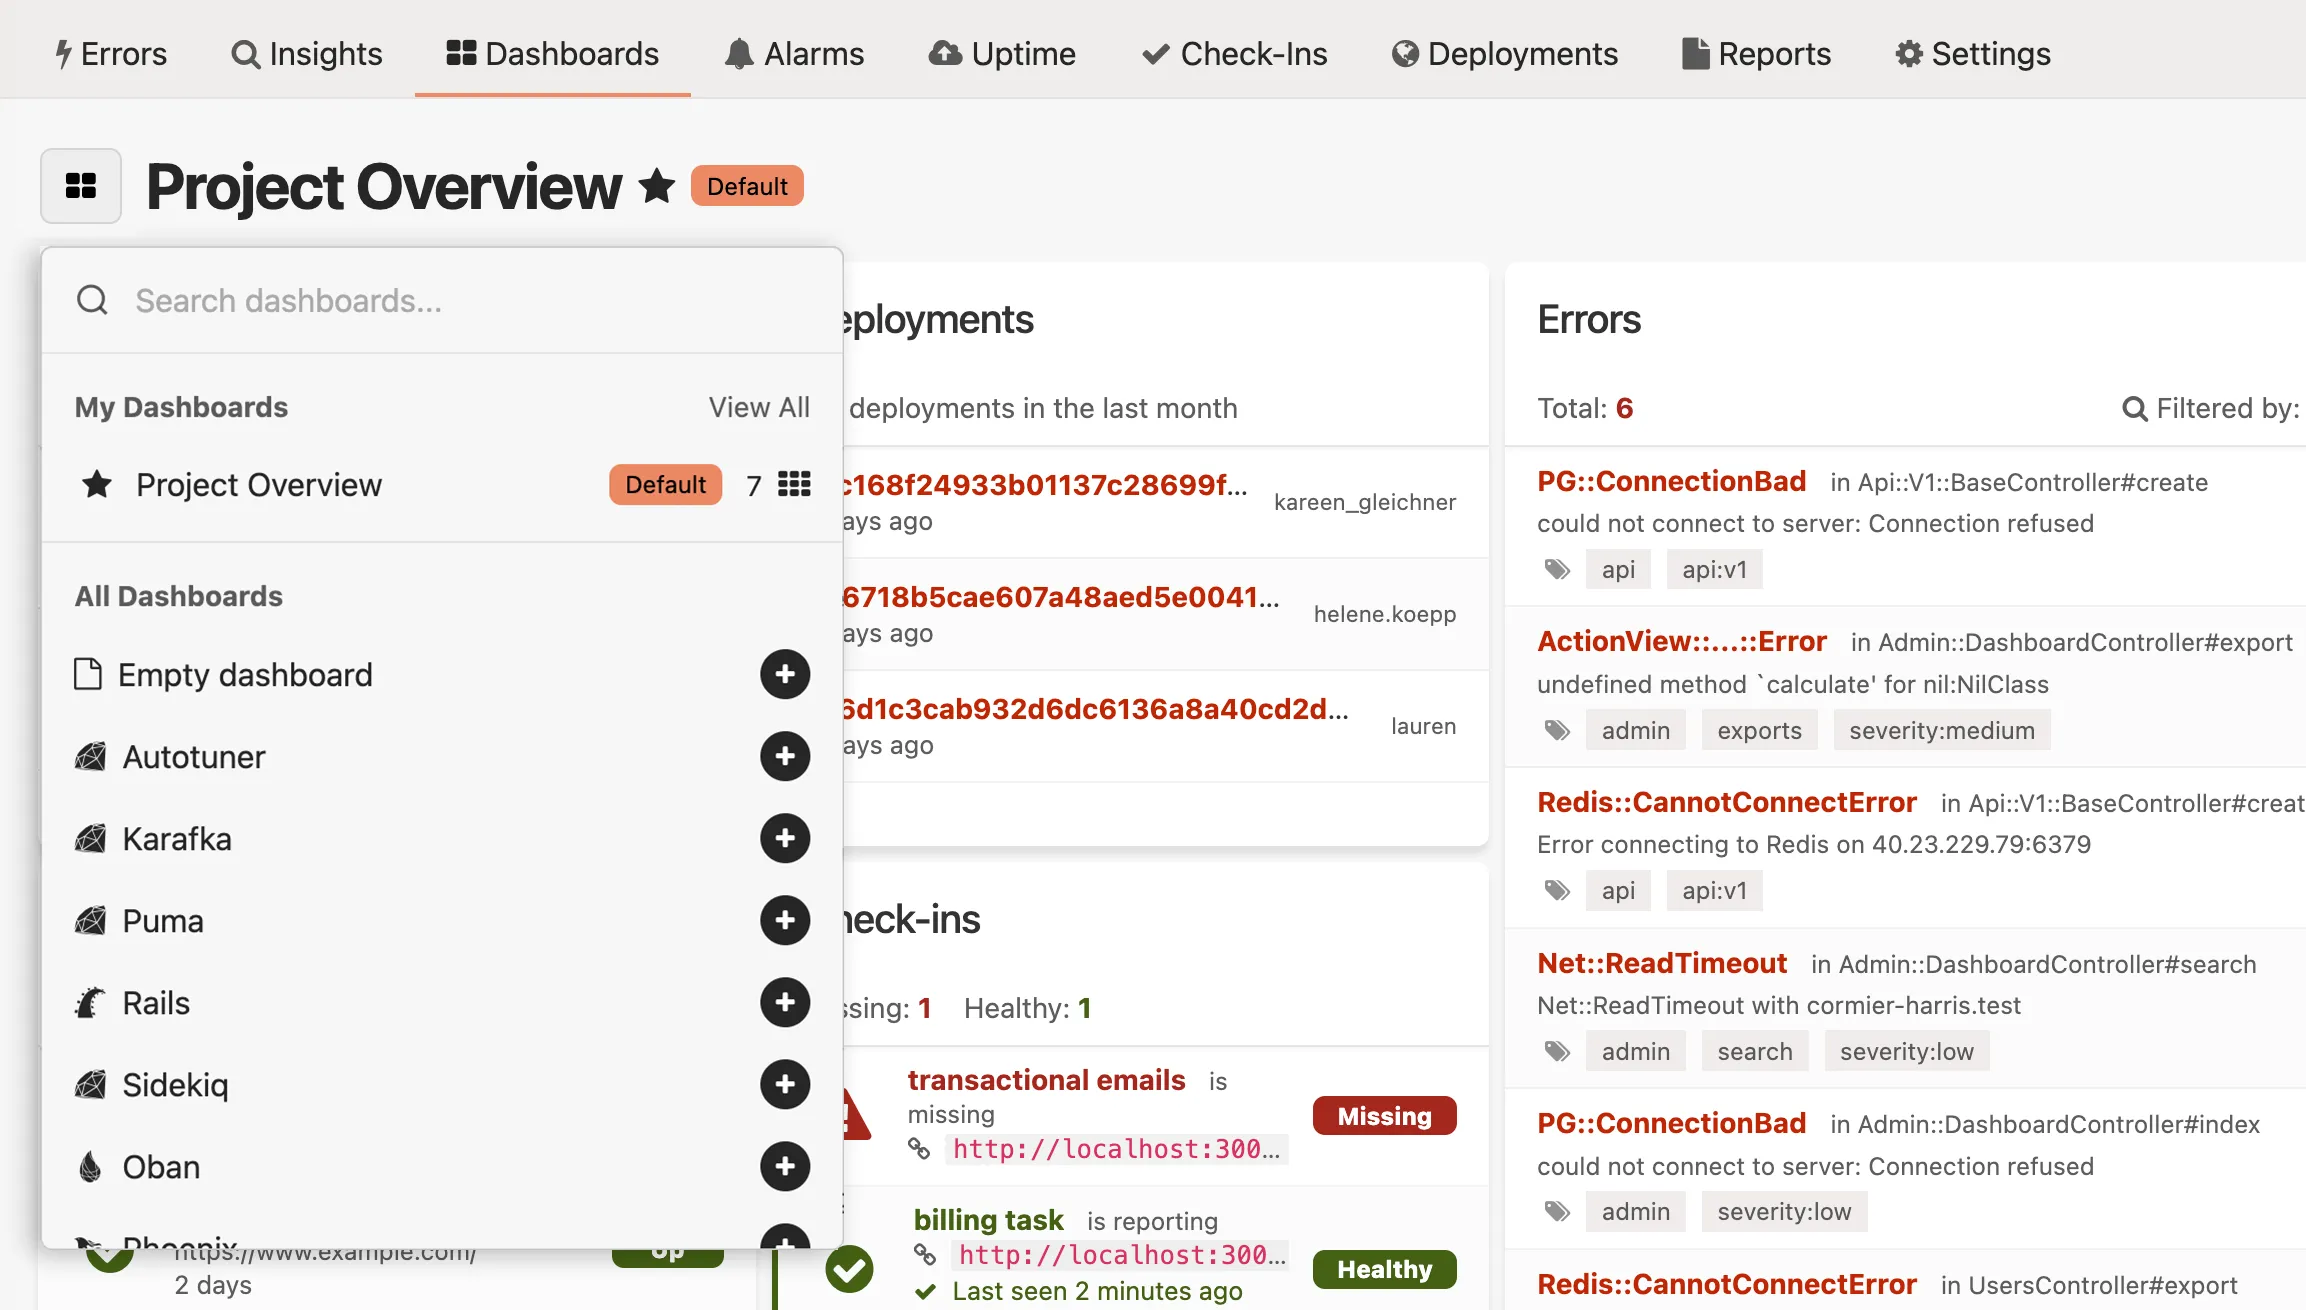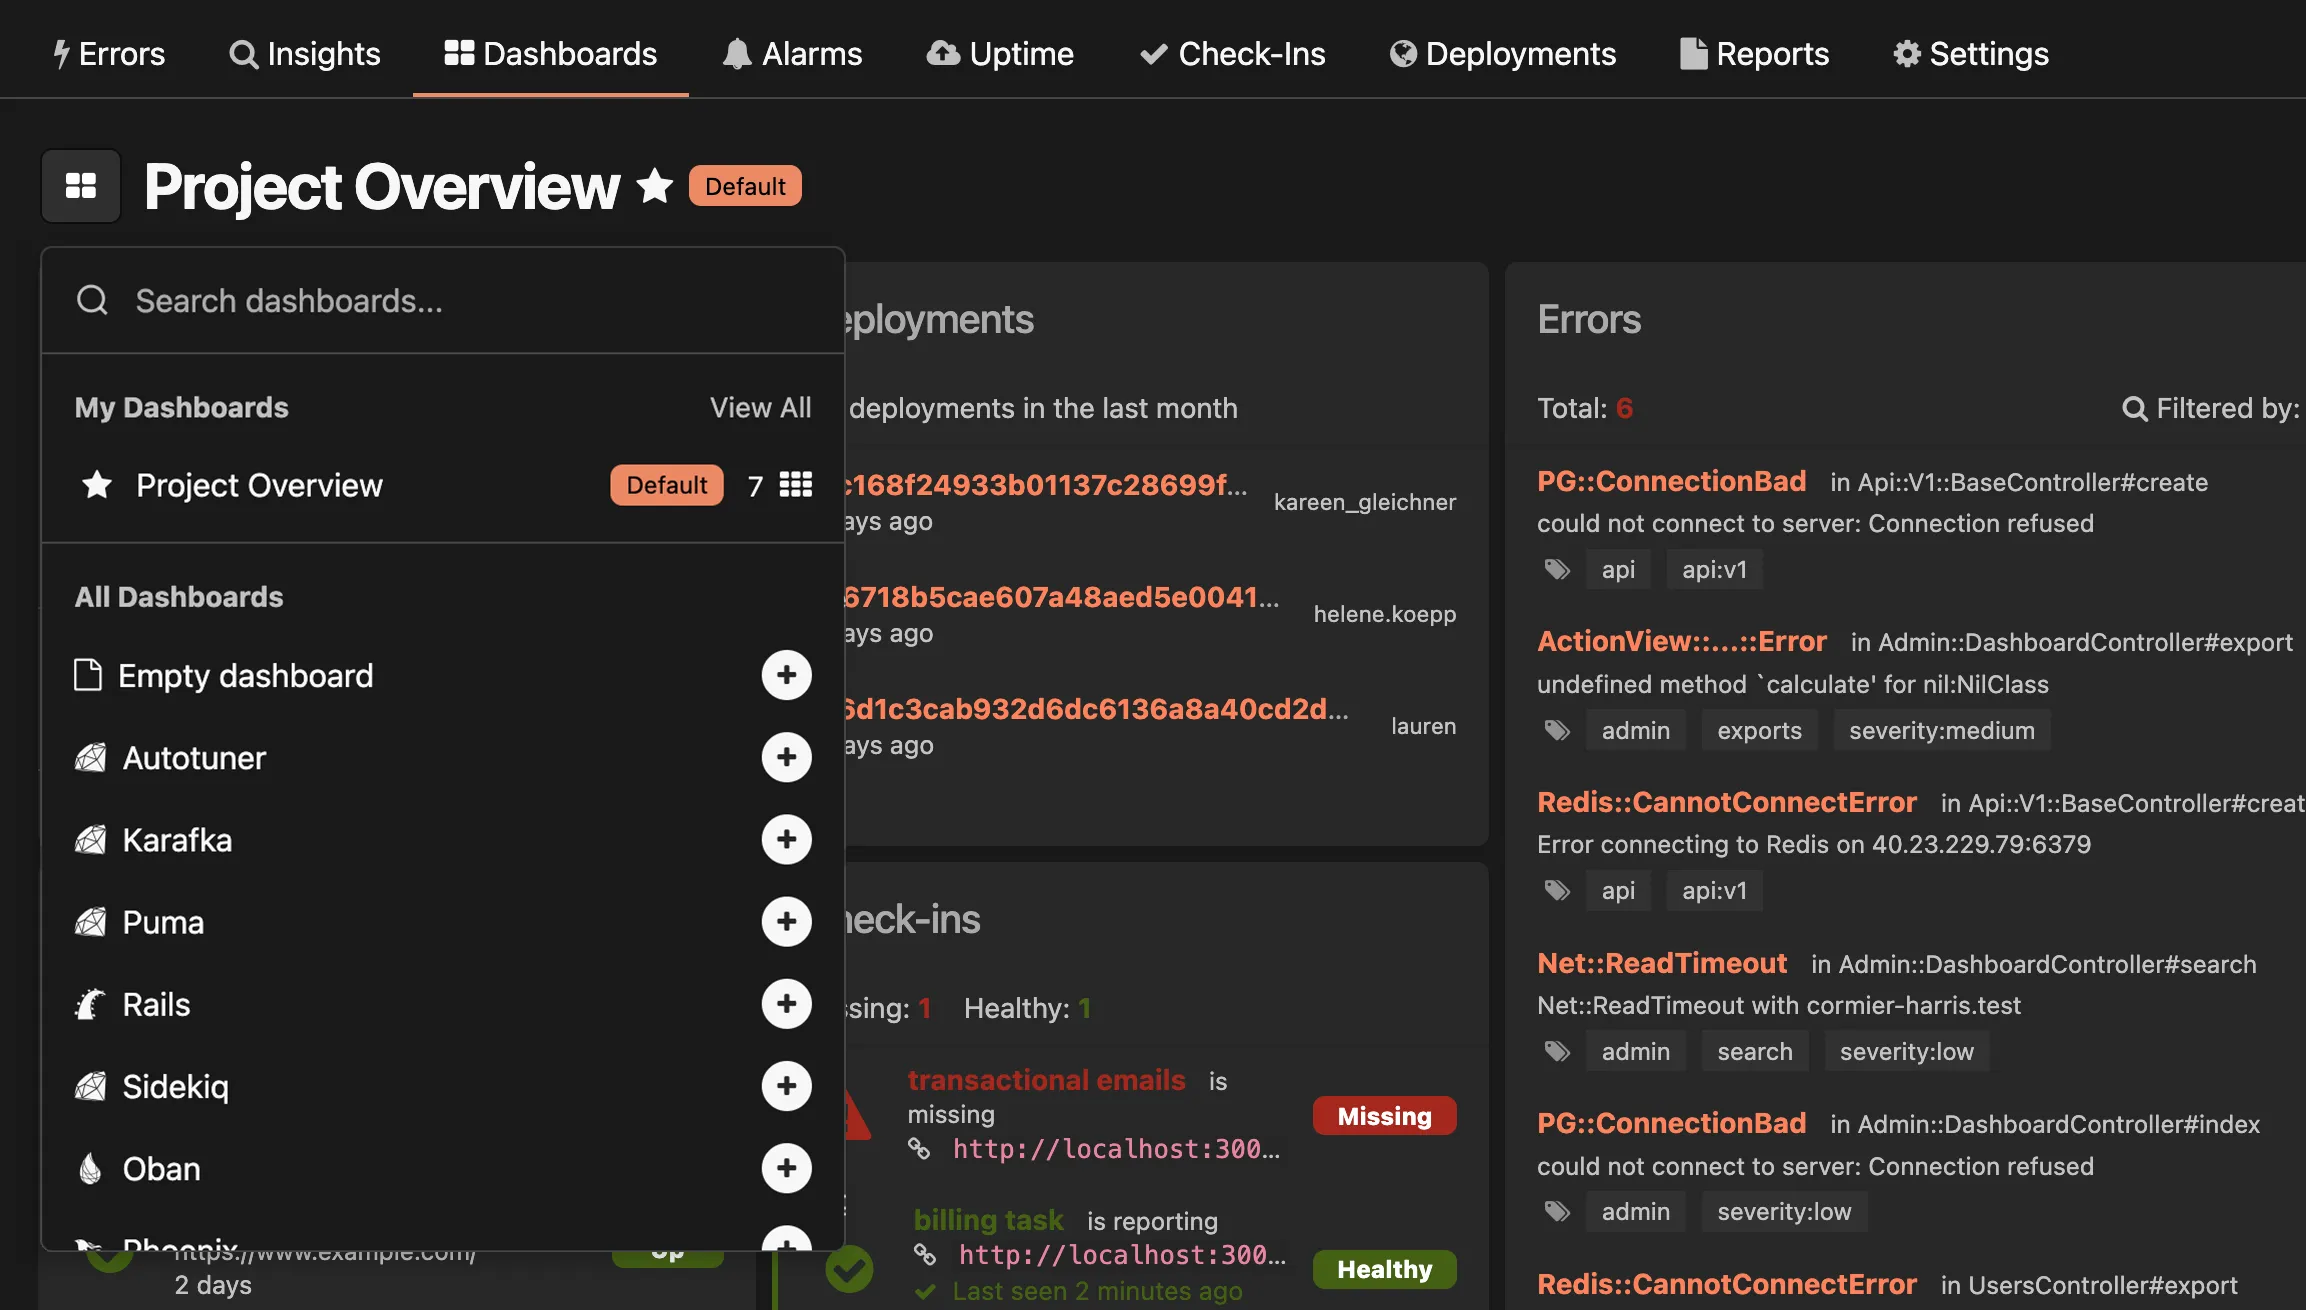 ## Project Overview dashboard [Section titled “Project Overview dashboard”](#project-overview-dashboard) The [Project Overview dashboard](/guides/dashboards/project-overview/) provides a comprehensive view of your application’s health and performance. It’s automatically added to every new Honeybadger project, giving you immediate visibility into alarms, deployments, errors, uptime checks, and check-ins. ## Automatic dashboards [Section titled “Automatic dashboards”](#automatic-dashboards) To help you get started quickly, Honeybadger provides pre-configured automatic dashboards with relevant widgets for common frameworks and platforms. These dashboards are automatically populated when you enable instrumentation for supported platforms. ### Getting started with automatic dashboards [Section titled “Getting started with automatic dashboards”](#getting-started-with-automatic-dashboards) To enable automatic dashboards for your applications, follow these steps: 1. Enable Honeybadger Insights instrumentation in your client library (e.g., [Ruby](/lib/ruby/insights/automatic-instrumentation/), [Elixir](/lib/elixir/insights/automatic-instrumentation/), [PHP](/lib/php/insights/automatic-instrumentation/), etc.) 2. Deploy your application with the updated configuration 3. Navigate to the *Dashboards* section in your Honeybadger project, click *Create dashboard*, select the dashboard you want, then click *Add dashboard*. Your dashboard will begin to populate with data as soon as your application starts sending events to Honeybadger. ## Customizing dashboards [Section titled “Customizing dashboards”](#customizing-dashboards) You can customize any dashboard by clicking the **…** menu in the top right corner of the dashboard. From there, you can: * **Edit** - Modify the dashboard layout and widgets * **Clone** - Create a copy of the dashboard * **Set as default dashboard** - Make this dashboard your default view * **Set default time range** - Configure the default time period * **Edit source** - View and edit the dashboard’s YAML configuration * **Delete dashboard** - Remove the dashboard 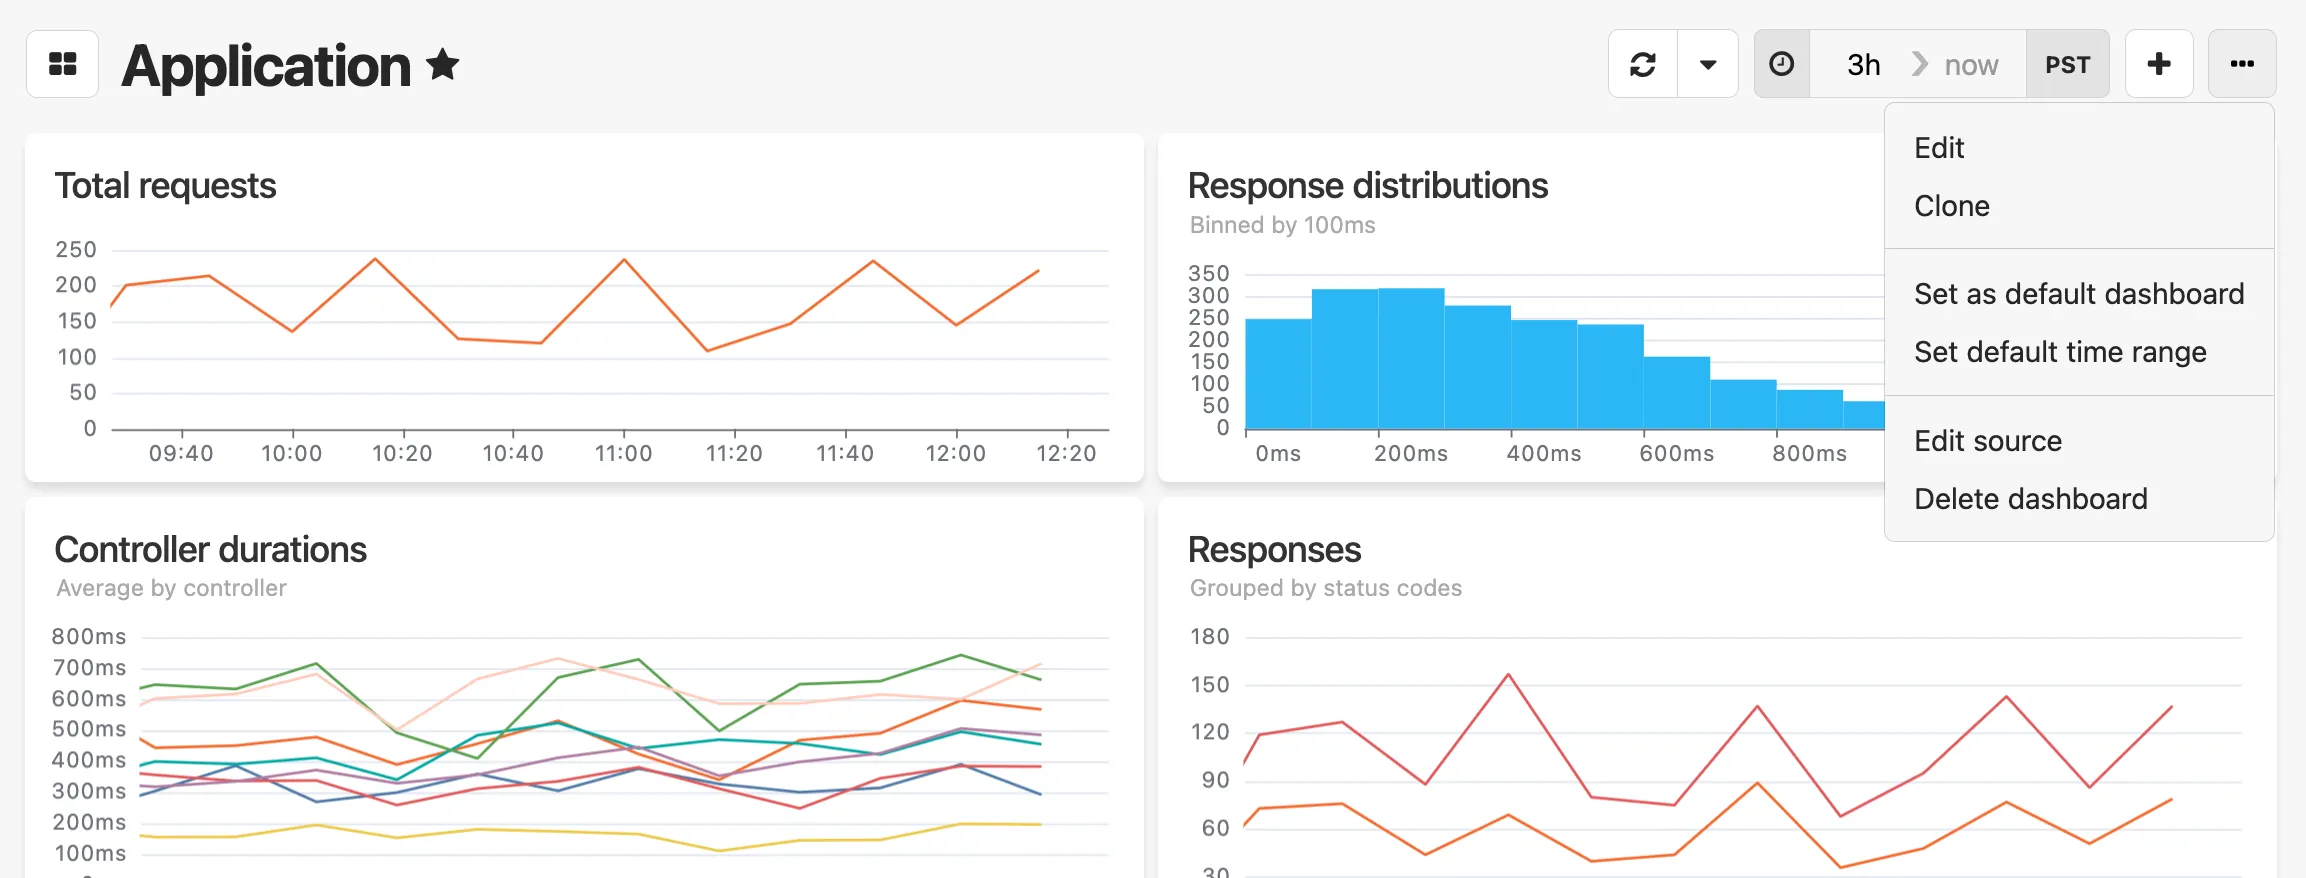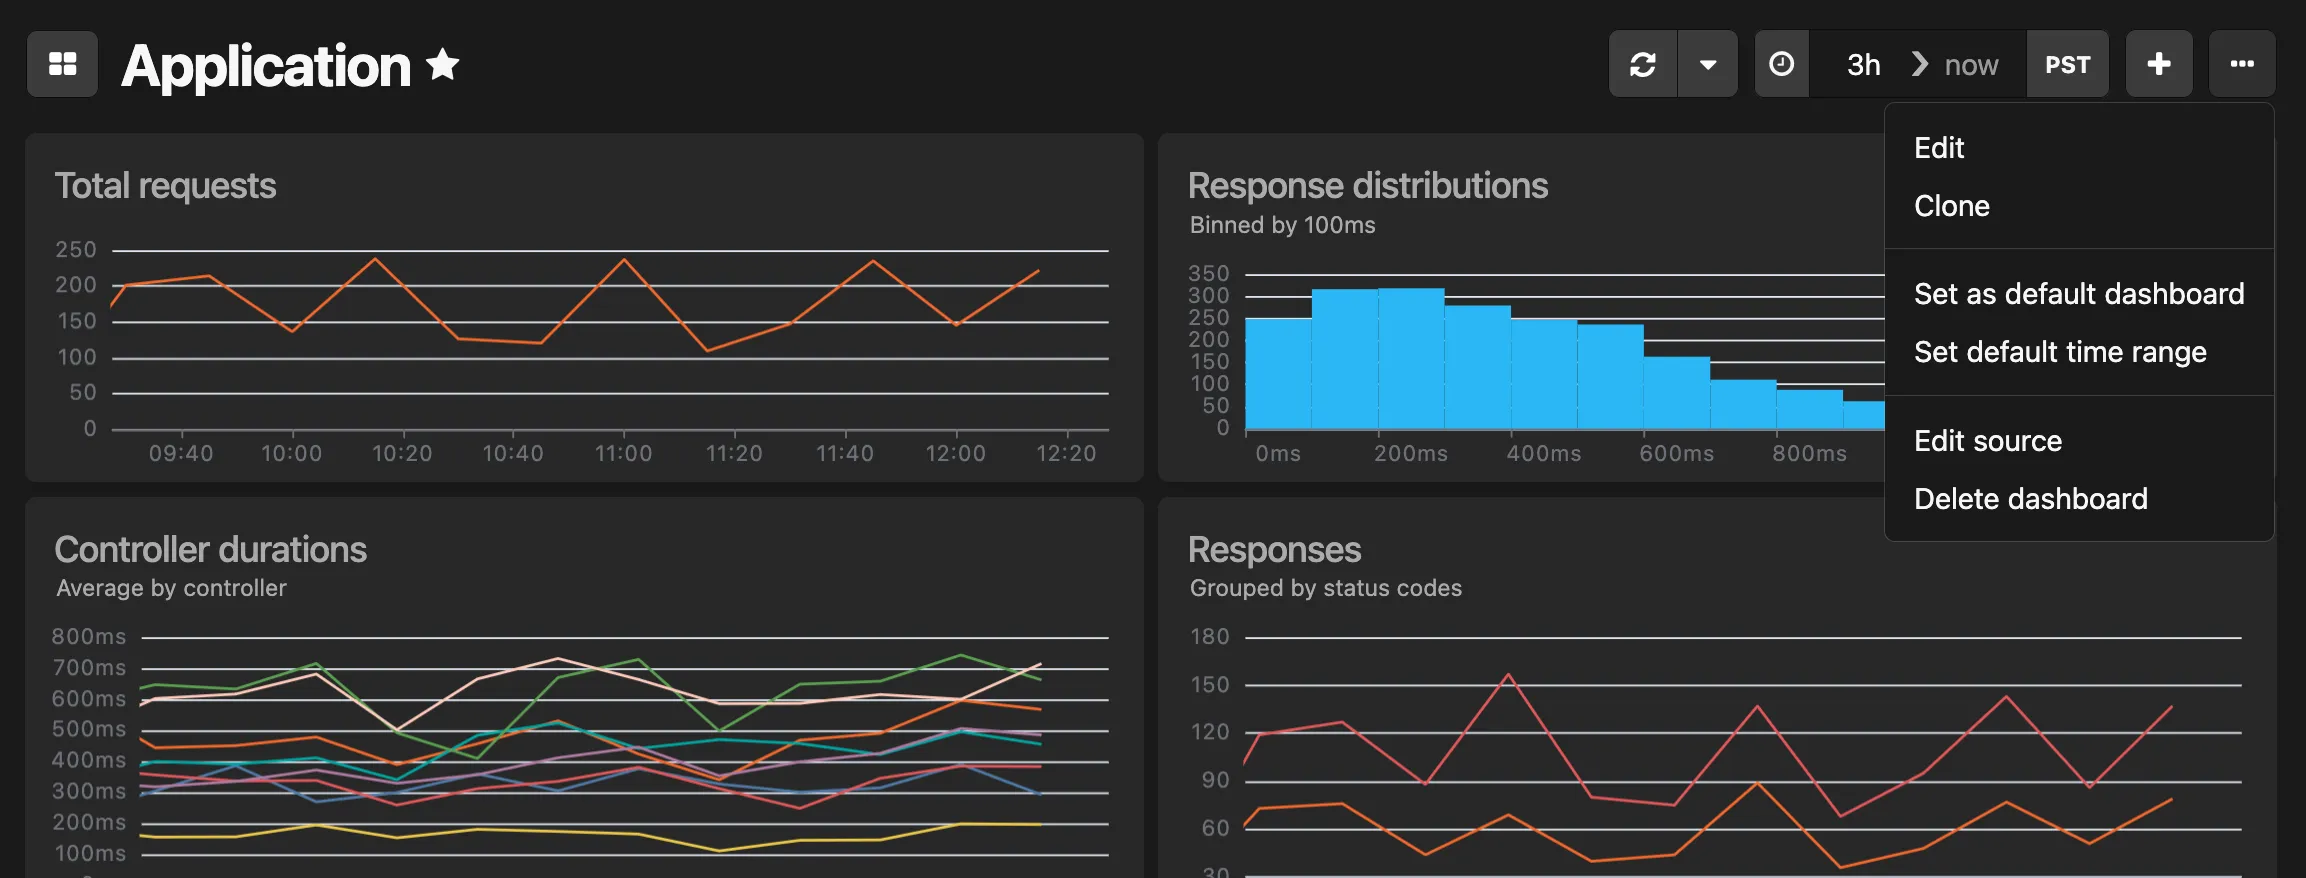 ### Widget library [Section titled “Widget library”](#widget-library) When adding new widgets to a dashboard, you can choose from a library of pre-configured widget templates. The widget library includes templates for common data sources such as: * Error rates and deployments * Database performance metrics * Background job processing times * Request counts and response distributions * Cache hit rates To add a widget from the library, click the **+** *Add widget* menu in the top right corner of the dashboard and select a template. You can customize any widget after adding it to your dashboard. 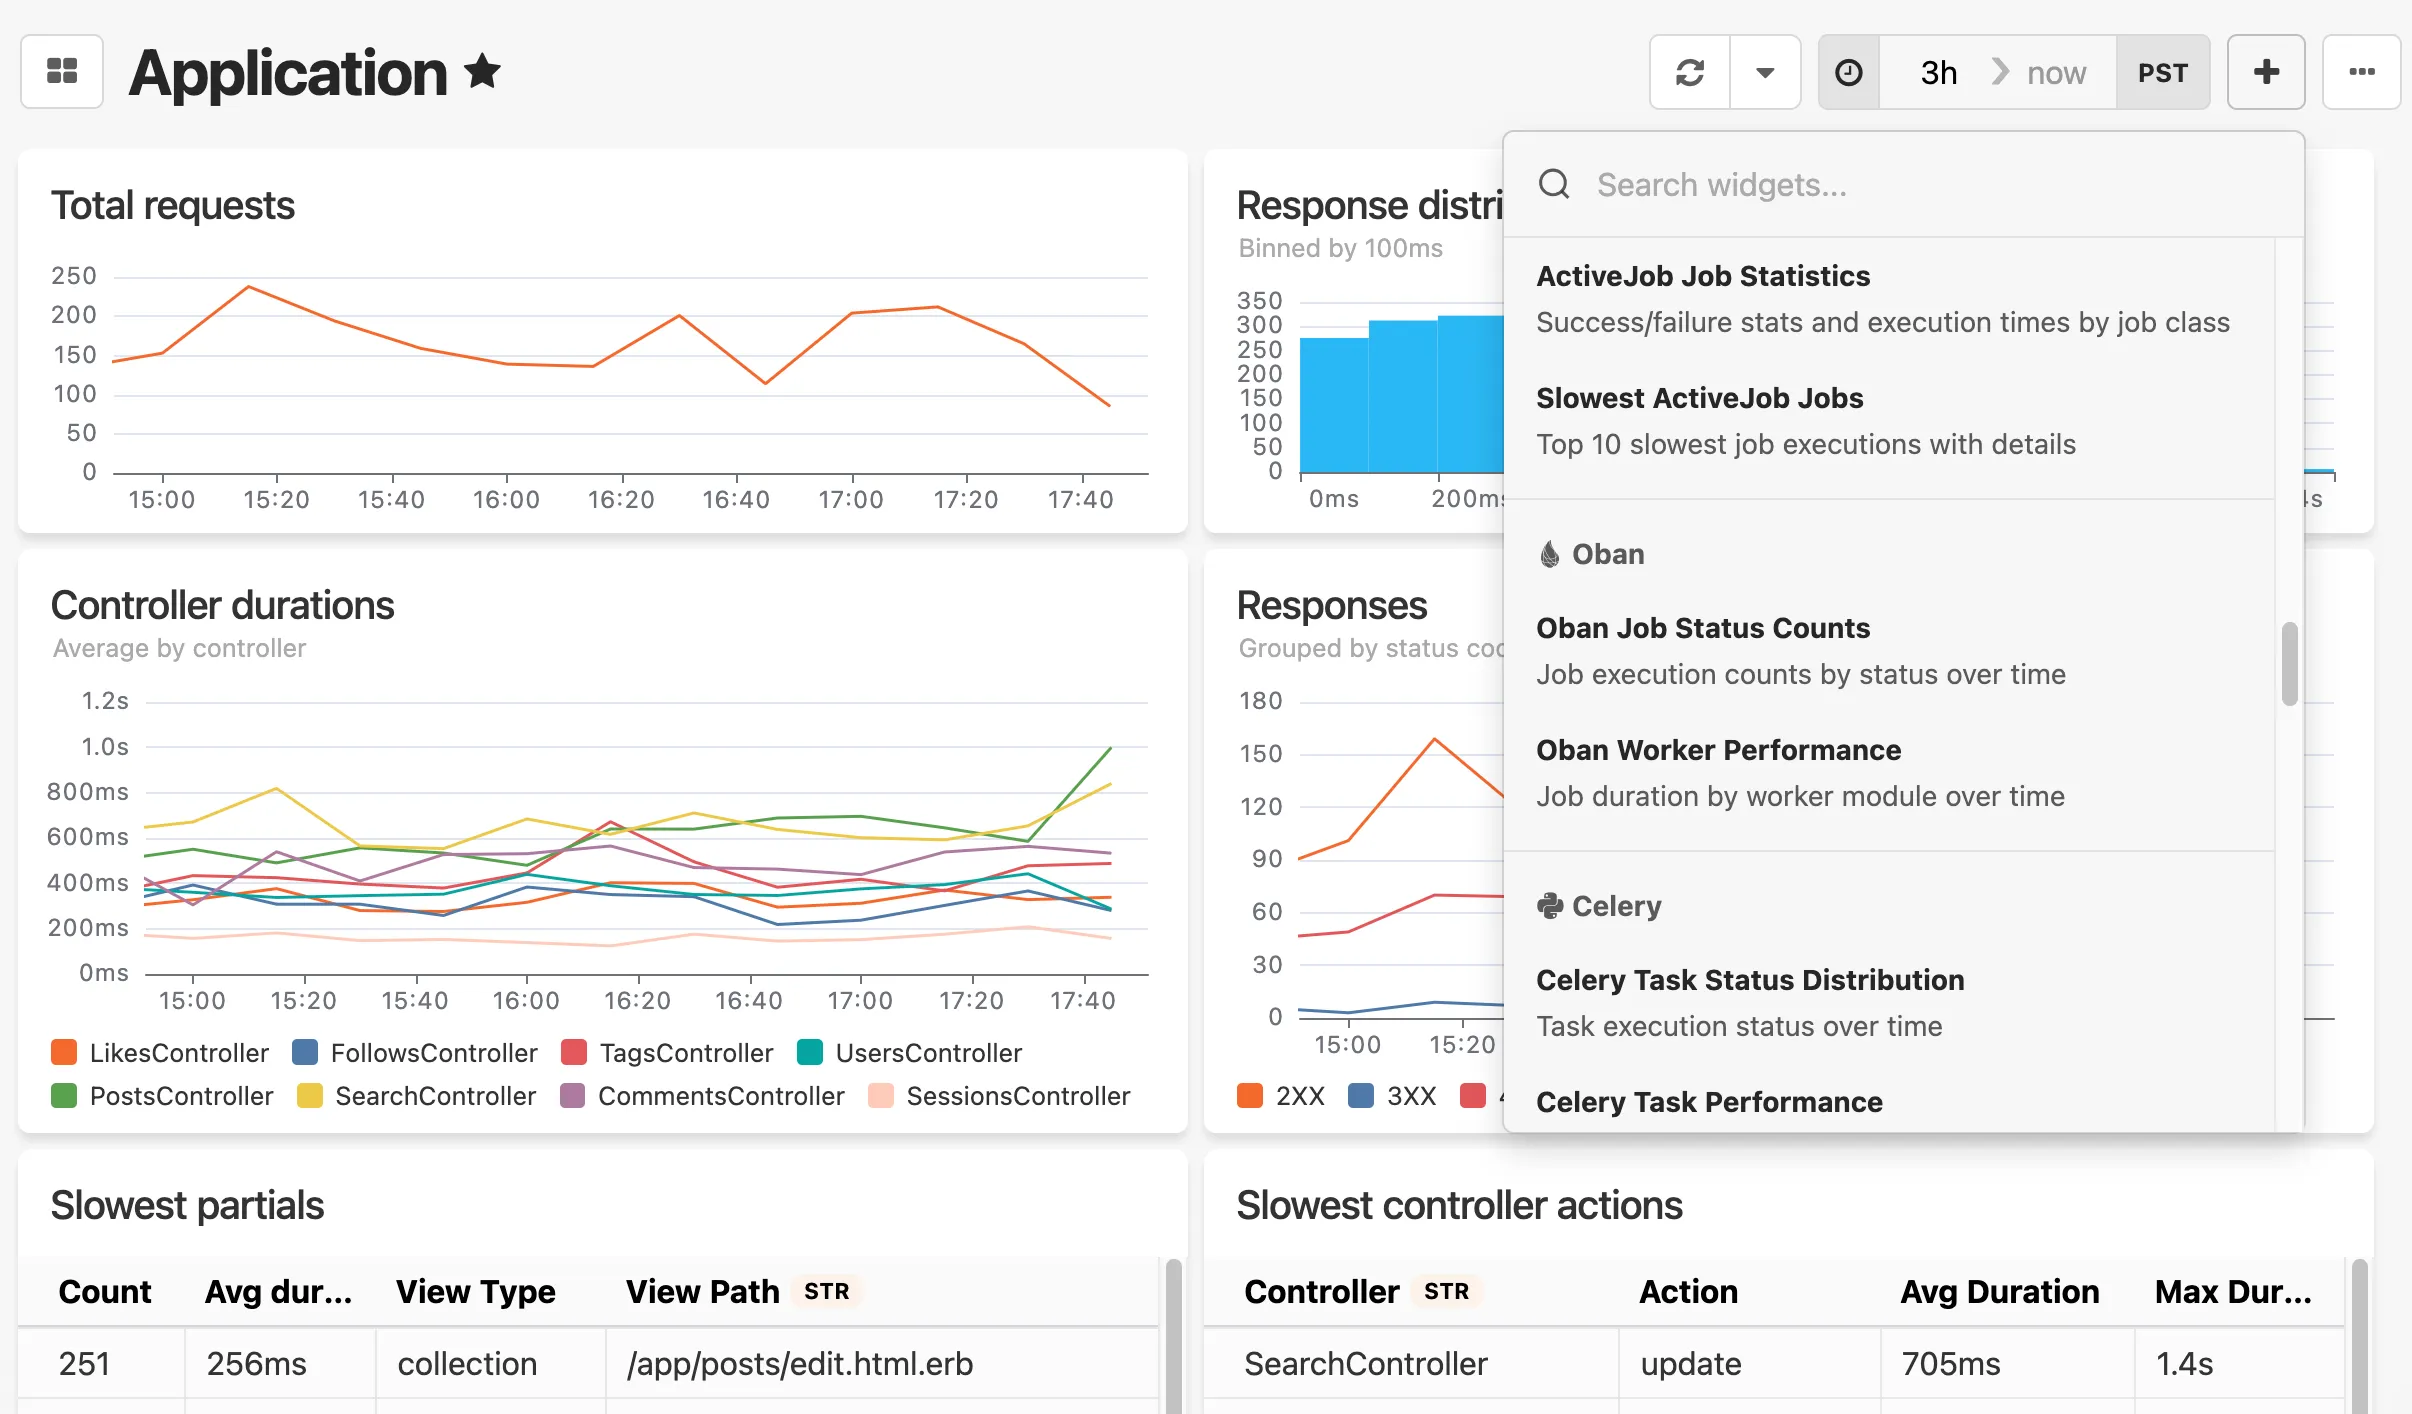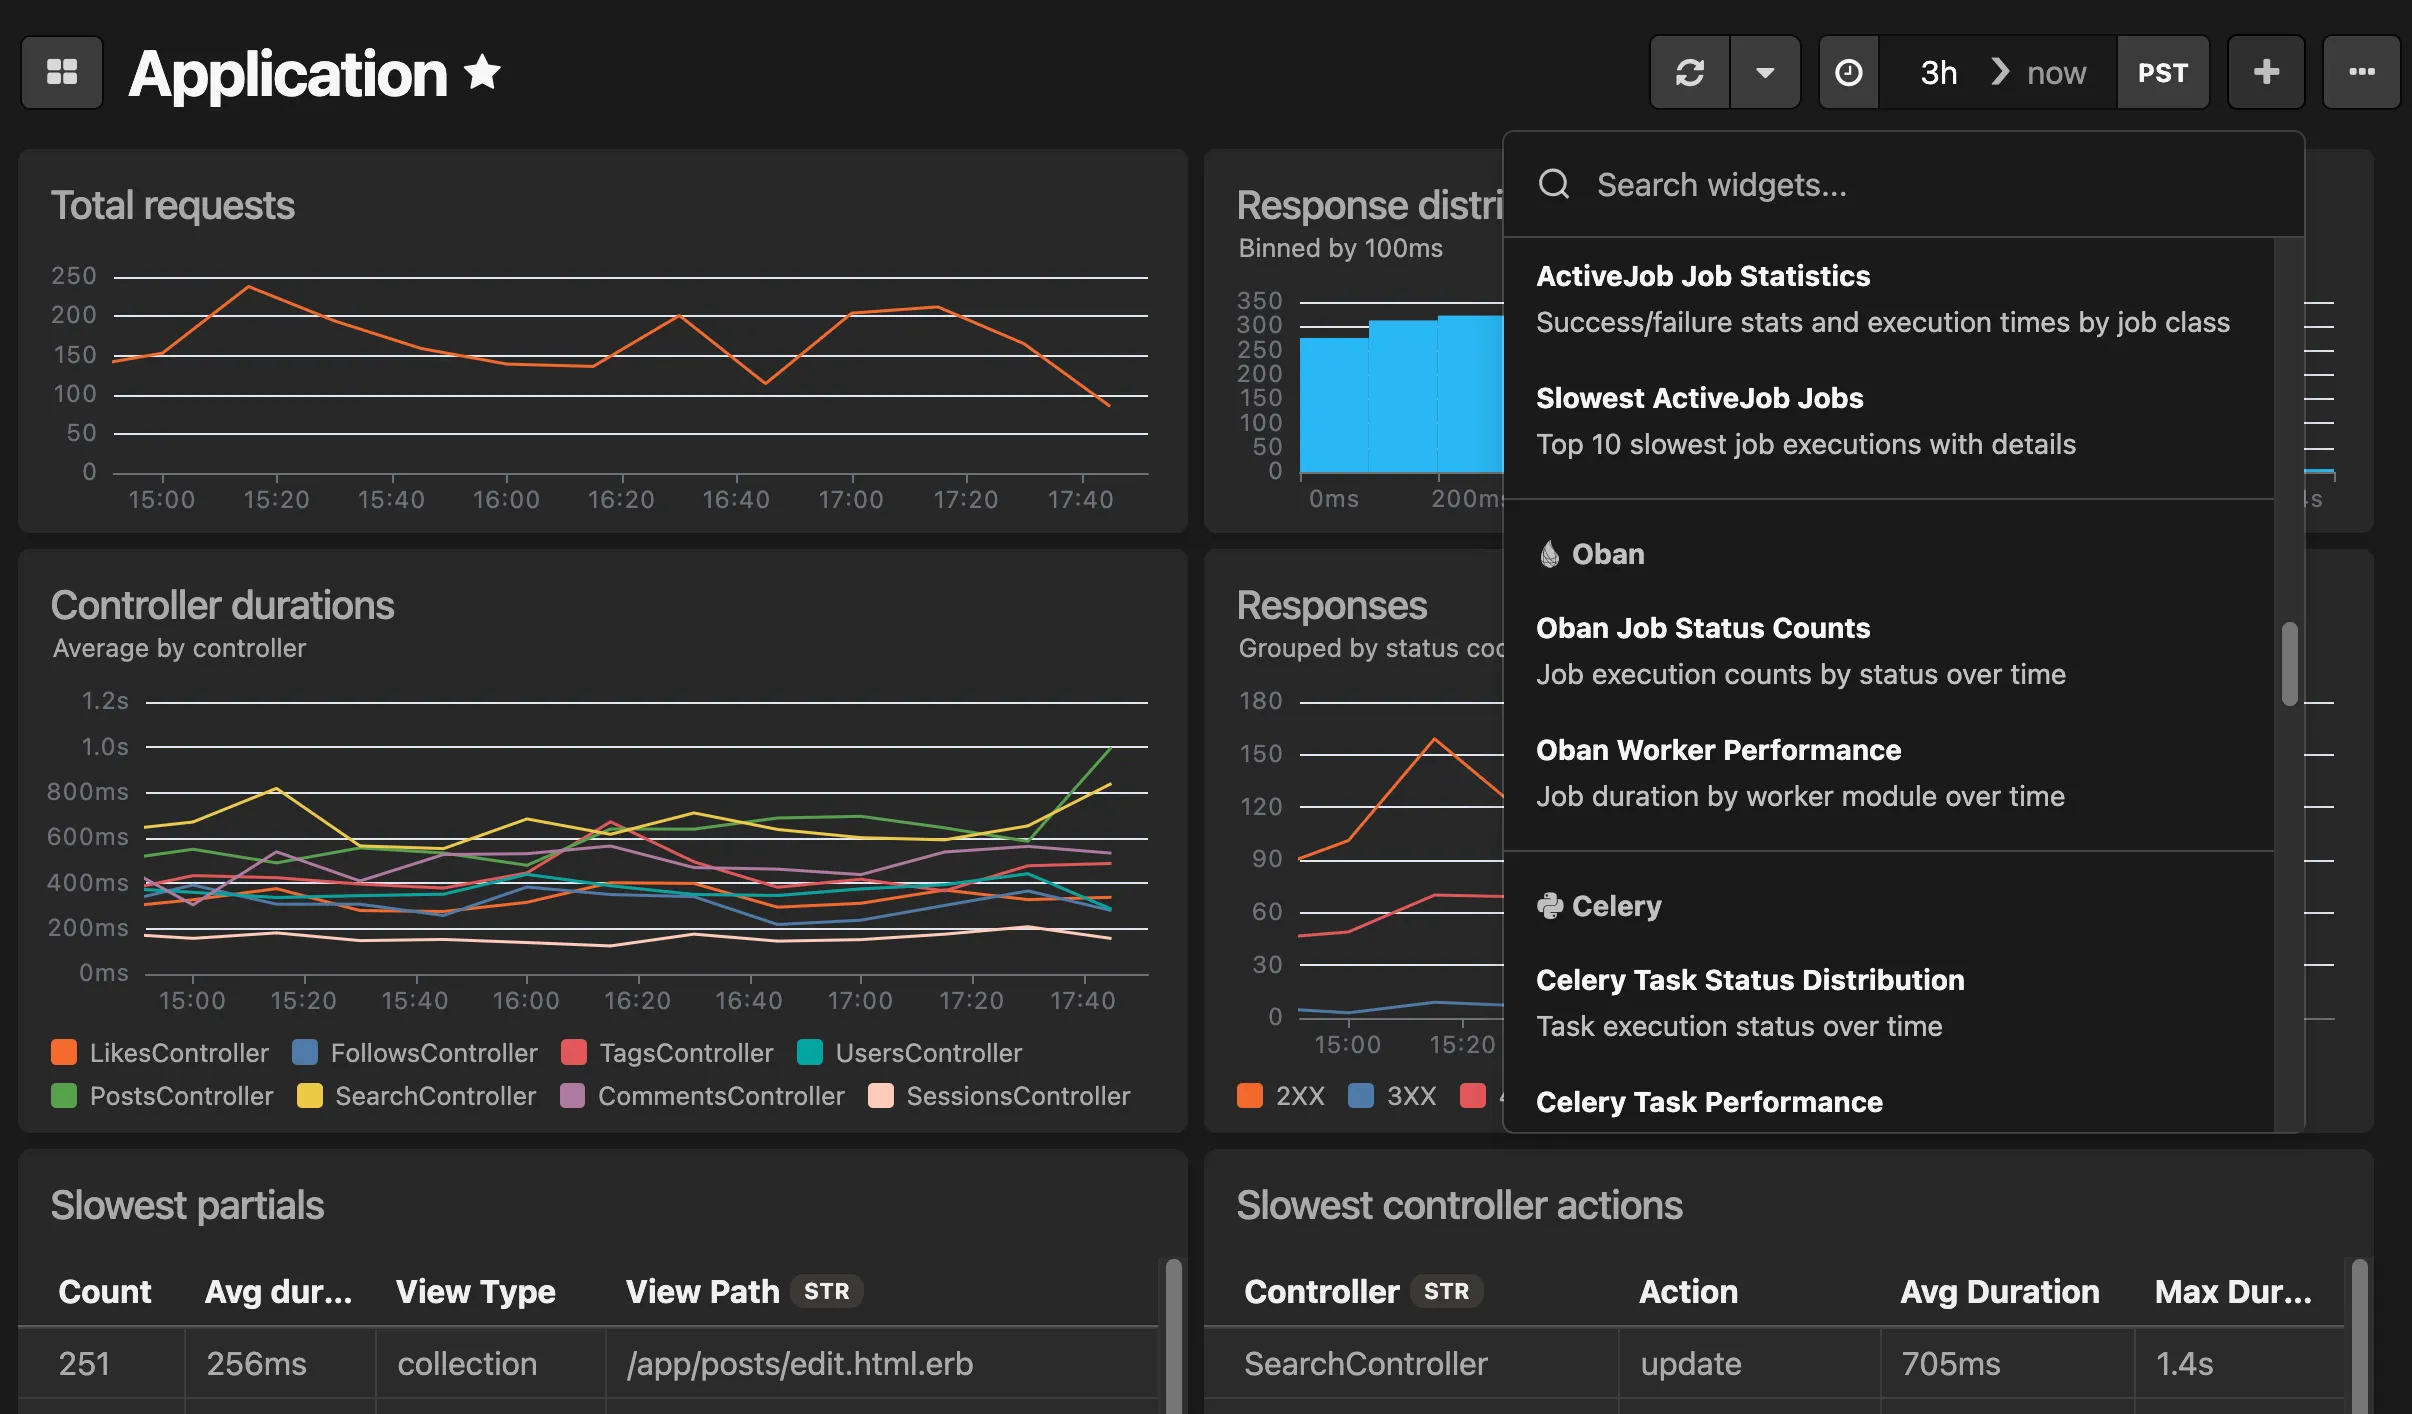 ### Editing widgets [Section titled “Editing widgets”](#editing-widgets) In edit mode, you can configure any widget by clicking the **…** menu on the widget and selecting **Edit widget**. This opens the widget editor where you can modify the query, change the visualization type, and preview results before saving. 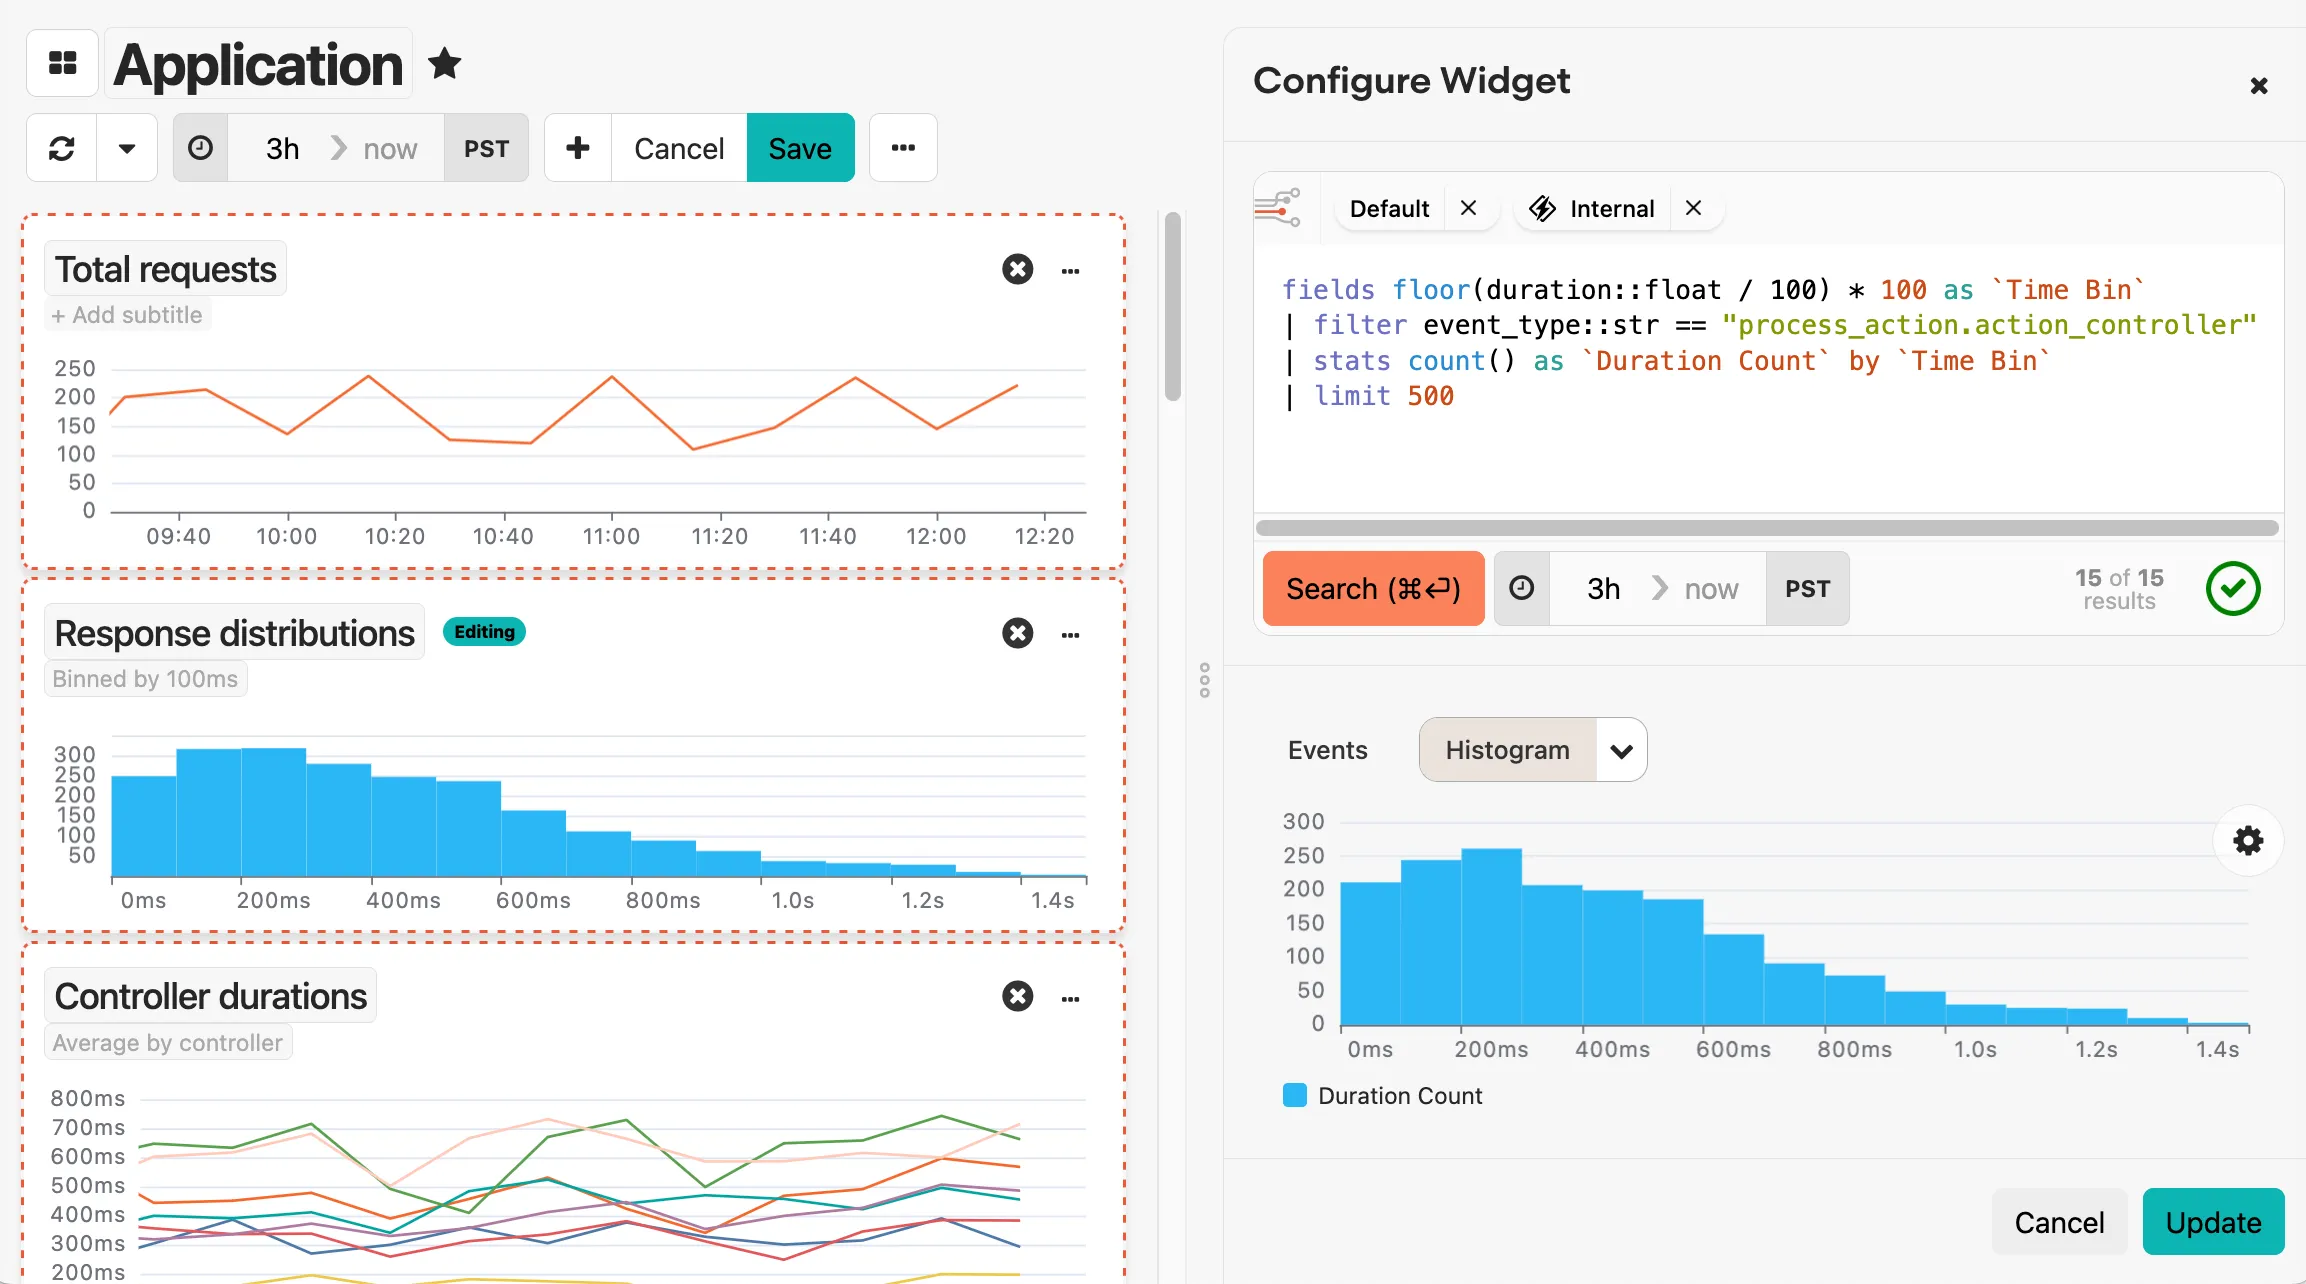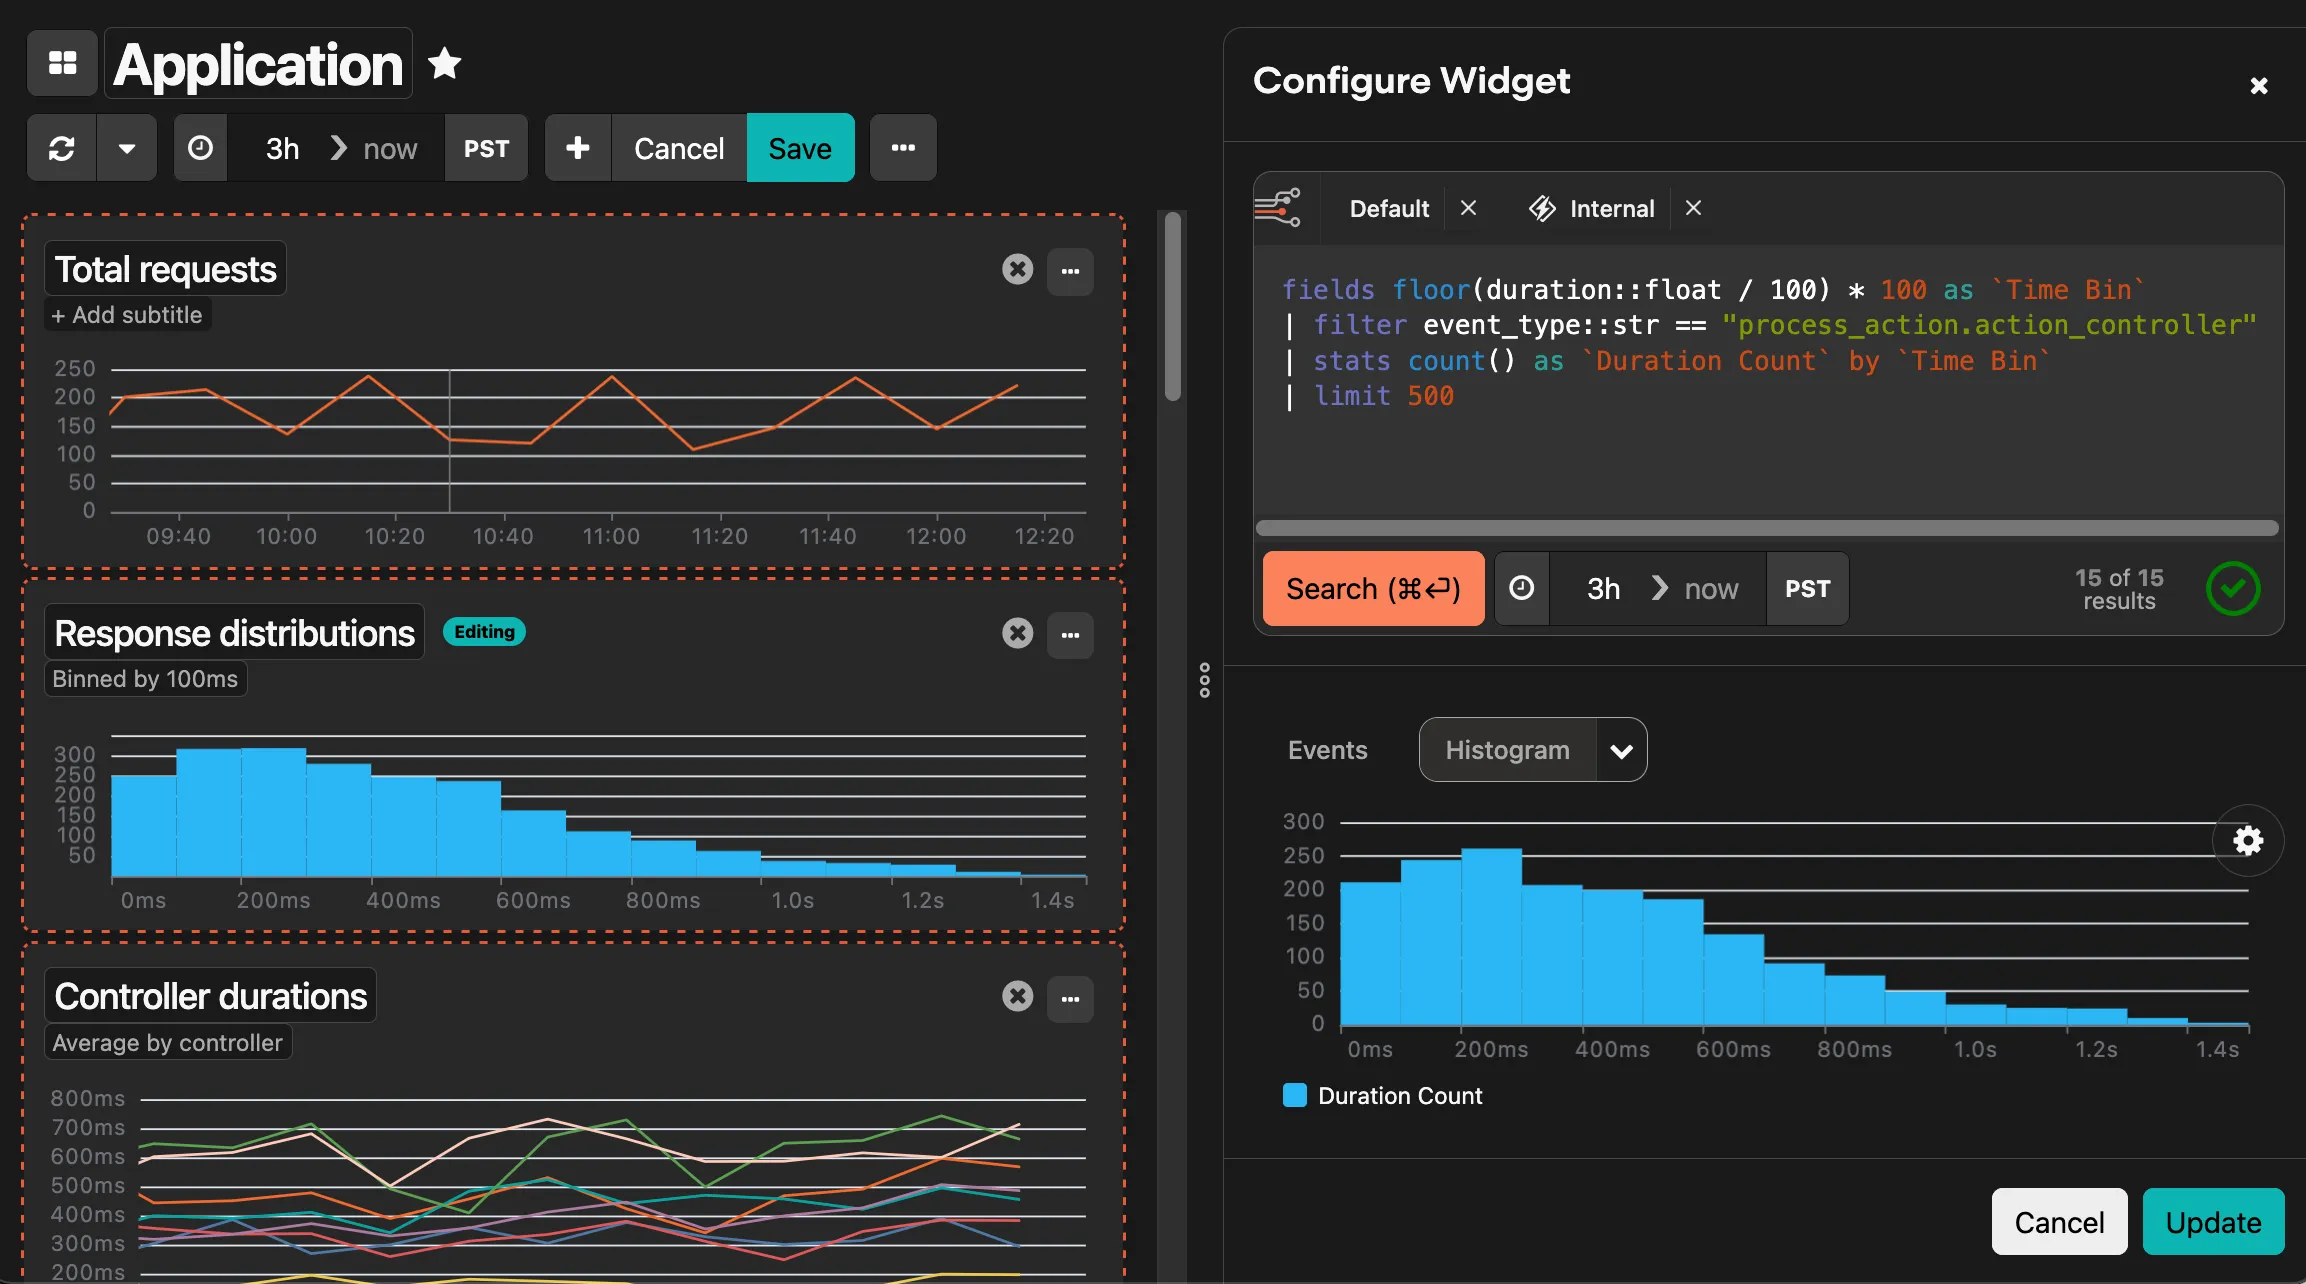 ### Parameterized queries [Section titled “Parameterized queries”](#parameterized-queries) You can make dashboard widgets dynamic by using parameters in your queries. Parameters let you create reusable dashboards where values can be changed via the URL or the **Parameters** button in the dashboard toolbar, without editing the widget configuration. For example, a single dashboard can be filtered to one host, environment, or customer at a time — and shared as a prefilled link. #### Adding a parameter to a widget [Section titled “Adding a parameter to a widget”](#adding-a-parameter-to-a-widget) To add a parameter to a dashboard widget: 1. Open the dashboard and click **Edit**. 2. Click the **…** menu on the widget and choose **Edit widget**. 3. Add a reference like `${hostname}` anywhere in the widget’s query — for example, `filter hostname::str == "${hostname}"`. 4. When the editor prompts you, provide a value for the new parameter so the preview can render. Click **Update** to save the widget. 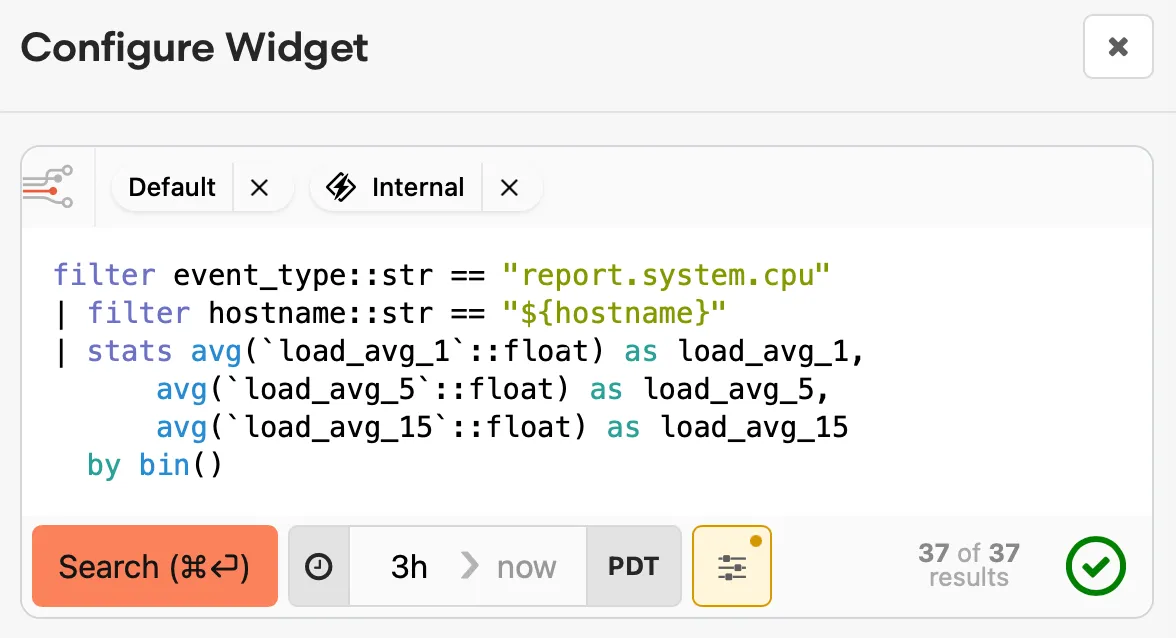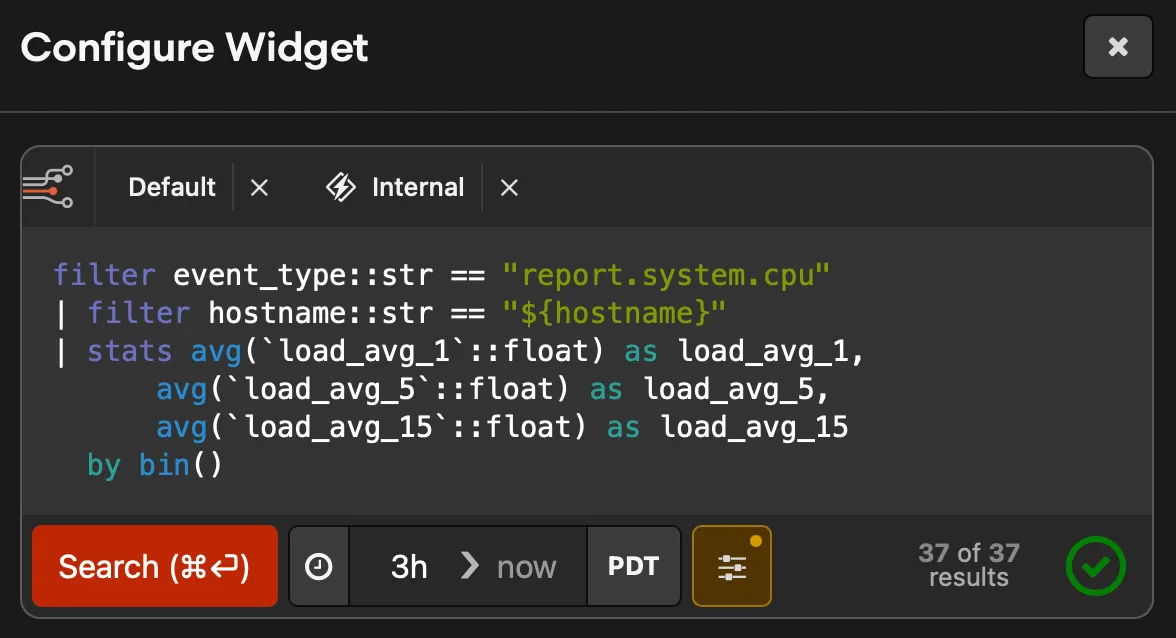 Once a parameter is defined, any widget on the dashboard that uses the same name will share the same value. To apply one parameter across several widgets, reference it from each widget’s query — either through the widget editor or by [editing the dashboard source](#editing-dashboard-source). #### Setting parameter values [Section titled “Setting parameter values”](#setting-parameter-values) There are three ways to set parameter values on a dashboard: 1. **URL parameters** — Add parameters directly to the URL (e.g., `?hostname=web-01`). Because parameters are URL-based, you can bookmark or share a link that already has the values filled in. 2. **Parameters popover** — Click the **Parameters** button (the slider icon in the dashboard toolbar, next to the date picker) to open a popover with a field for each parameter used on the dashboard. Enter values and click **Apply**, or click **Reset to defaults** to restore default values. 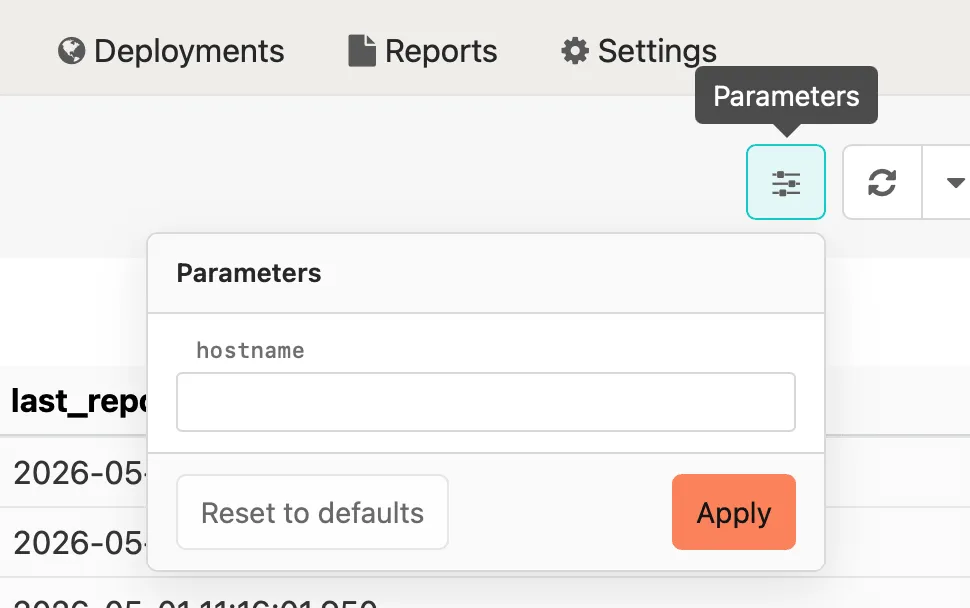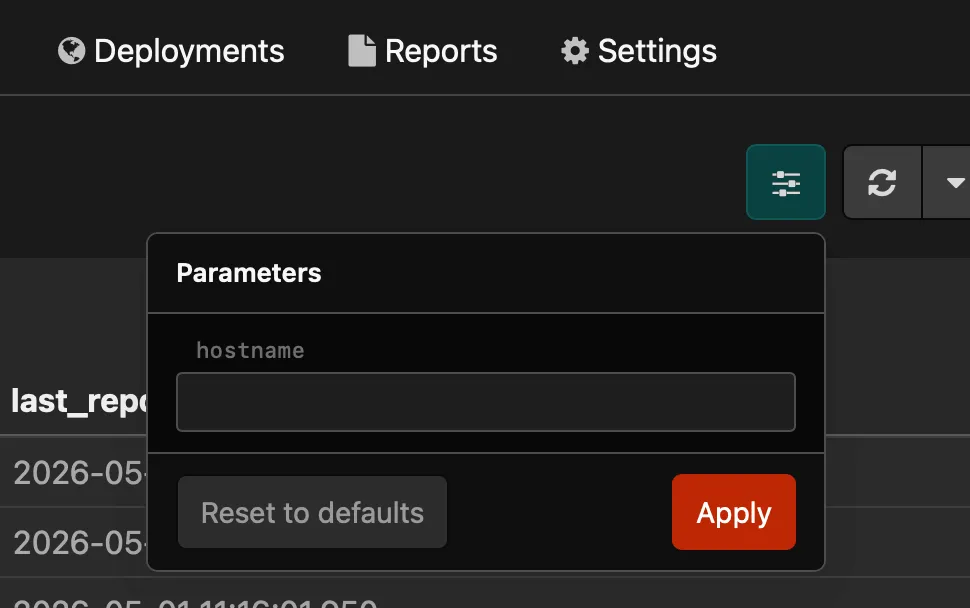 3. **From widget results** — Click a field value in a widget’s results. If the field name matches a parameter used on the dashboard, you’ll see a “set parameter” option that updates every widget using that parameter. #### Default values [Section titled “Default values”](#default-values) Giving a parameter a default with `${name:-default}` means the widget can render even when no value has been supplied. Defaults are useful for: * Setting a sensible baseline (e.g., `${env:-production}`) that viewers can override. * Ensuring a dashboard renders on first load before anyone has edited parameters. #### Parameters required state [Section titled “Parameters required state”](#parameters-required-state) When a widget references a parameter that has no default and no value has been supplied via the URL or the parameters popover, the widget displays a **Parameters required** message with an **Edit parameters** button. The **Parameters** button in the dashboard toolbar also shows an indicator dot, signaling that one or more values need to be set. Click either to open the parameters popover and supply the missing values. 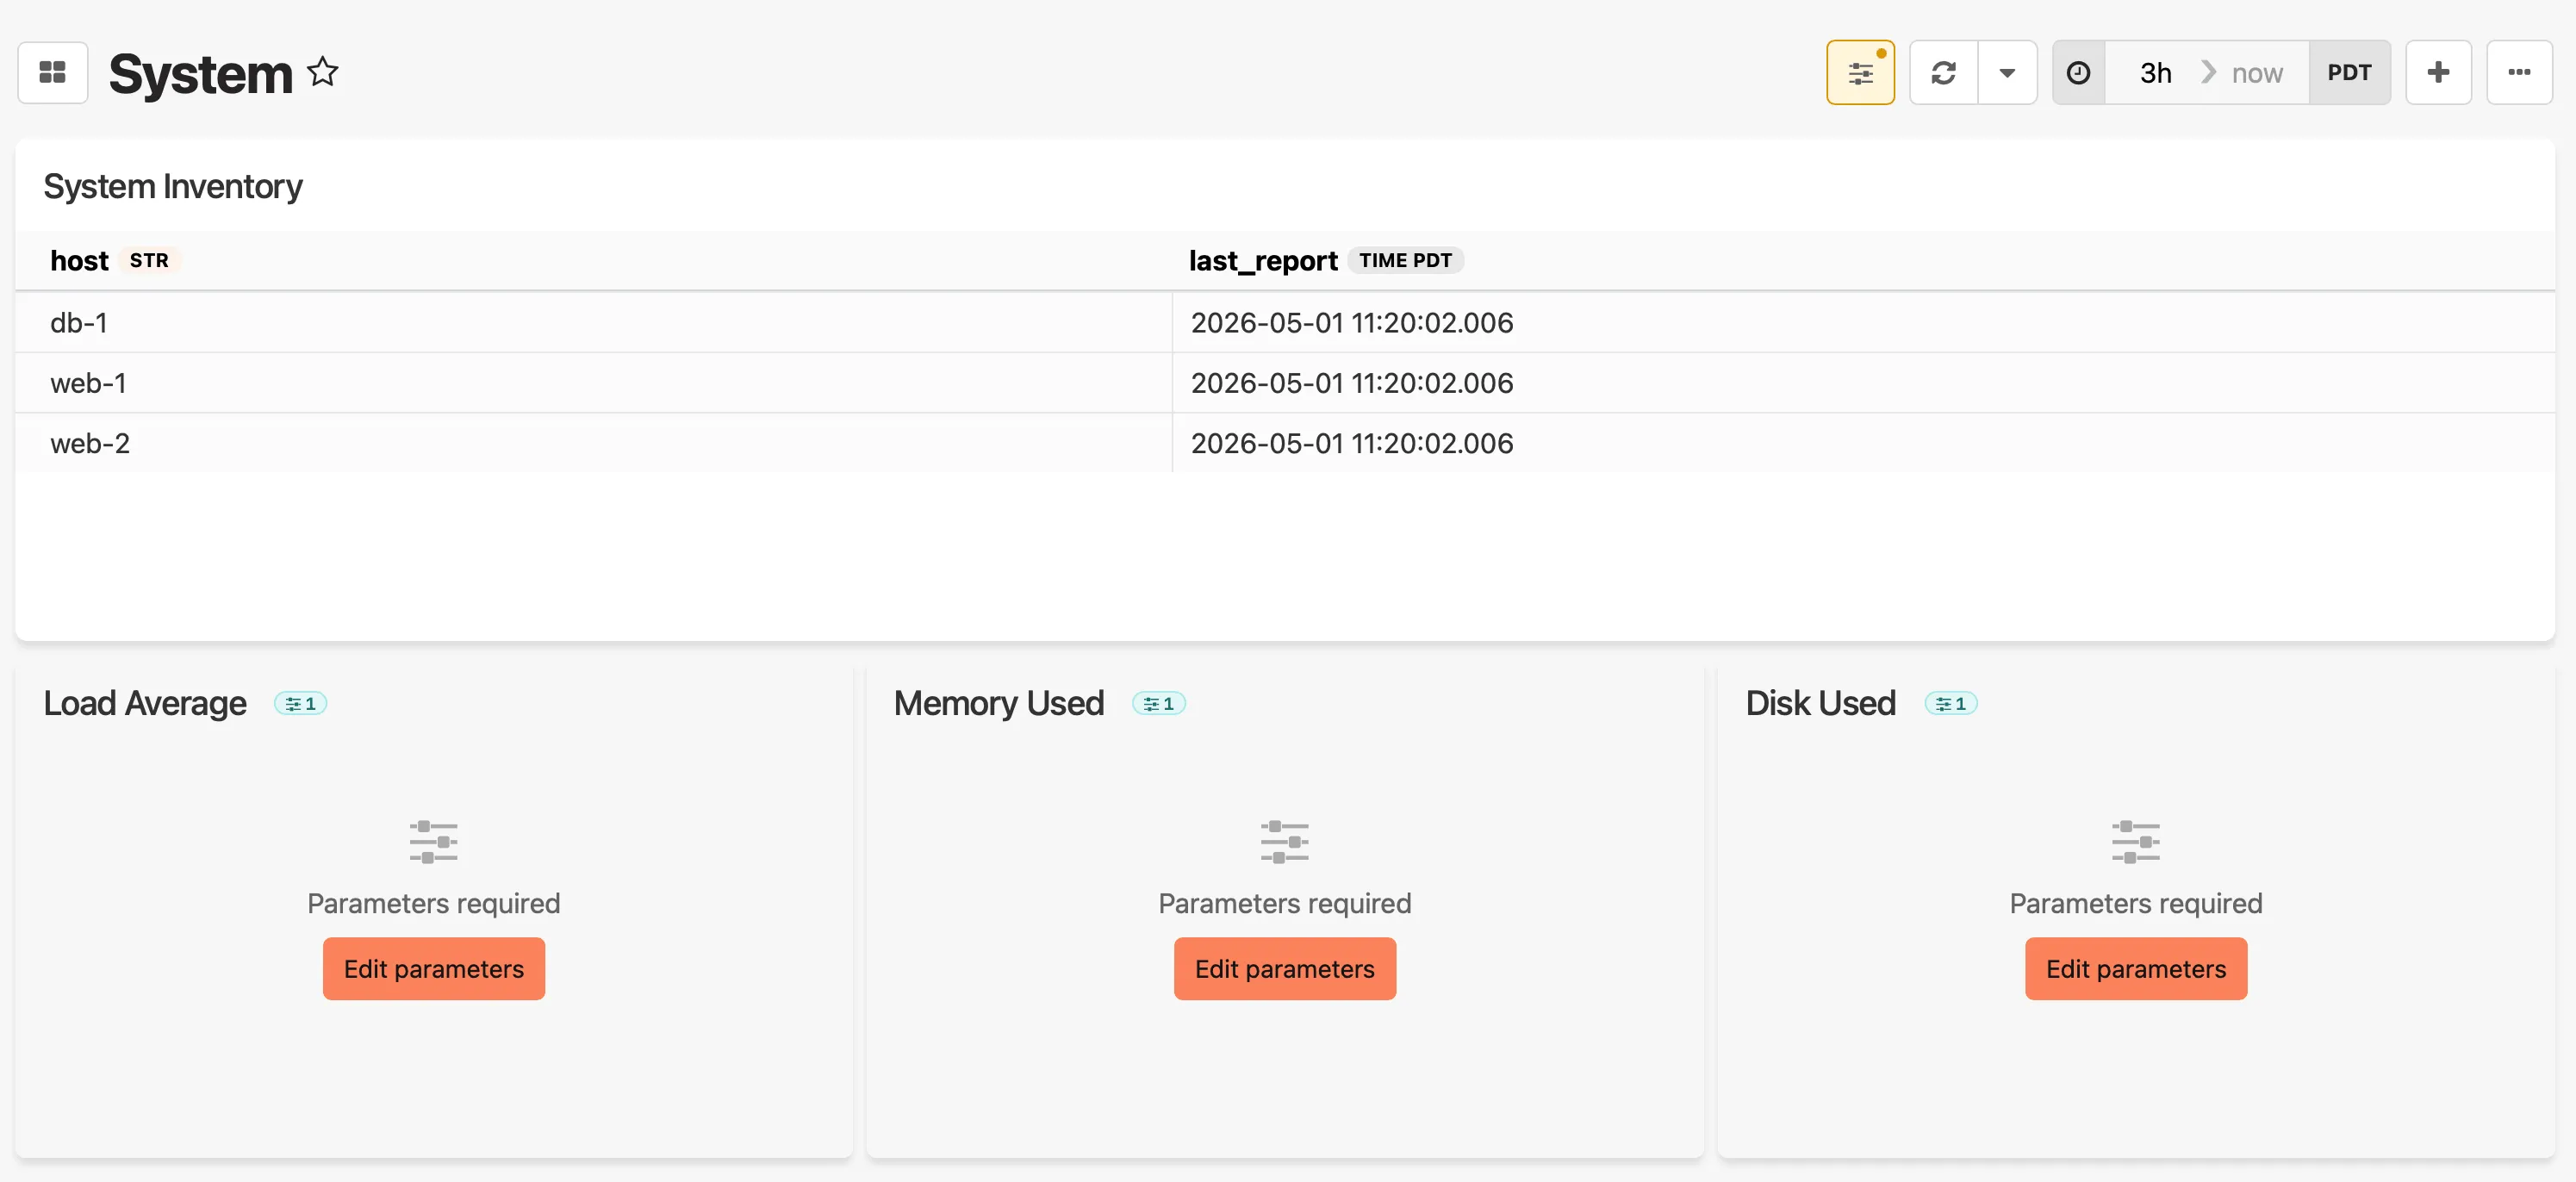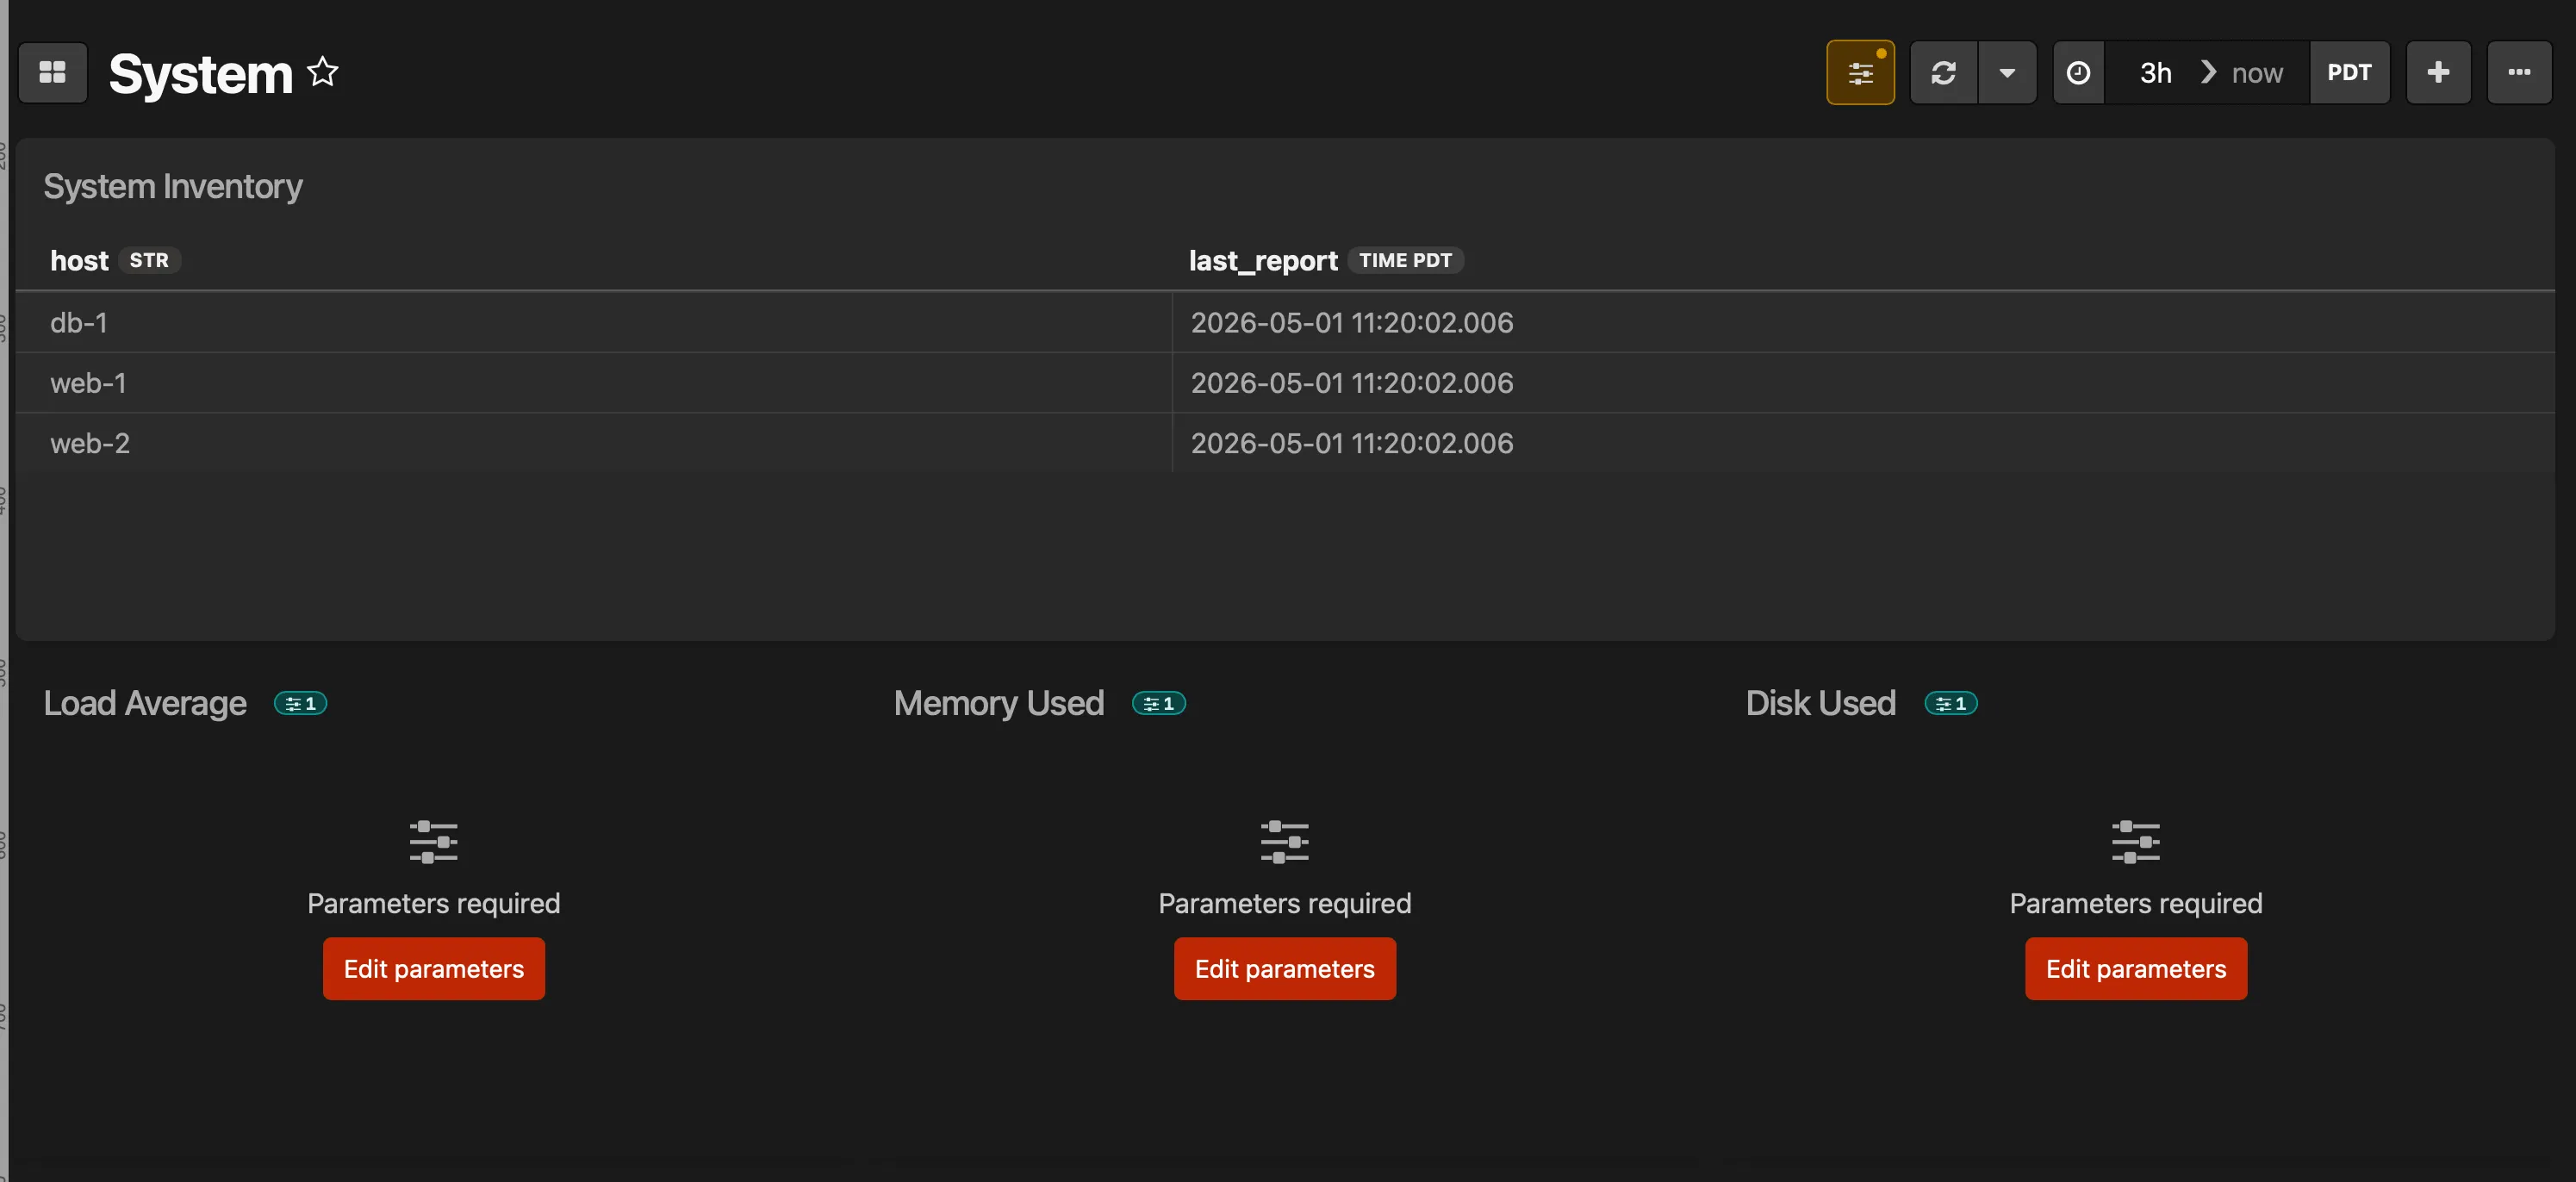 ### Editing dashboard source [Section titled “Editing dashboard source”](#editing-dashboard-source) For advanced customization, select **Edit source** to view and modify the entire dashboard configuration as YAML. This is useful for: * Making bulk changes without navigating the UI * Copying dashboards between projects * Sharing configurations with team members The editor validates your configuration against a predefined schema and displays helpful error messages if something’s wrong. Stream IDs are automatically converted to human-readable names, so you don’t need to manually update identifiers when moving configurations between projects. 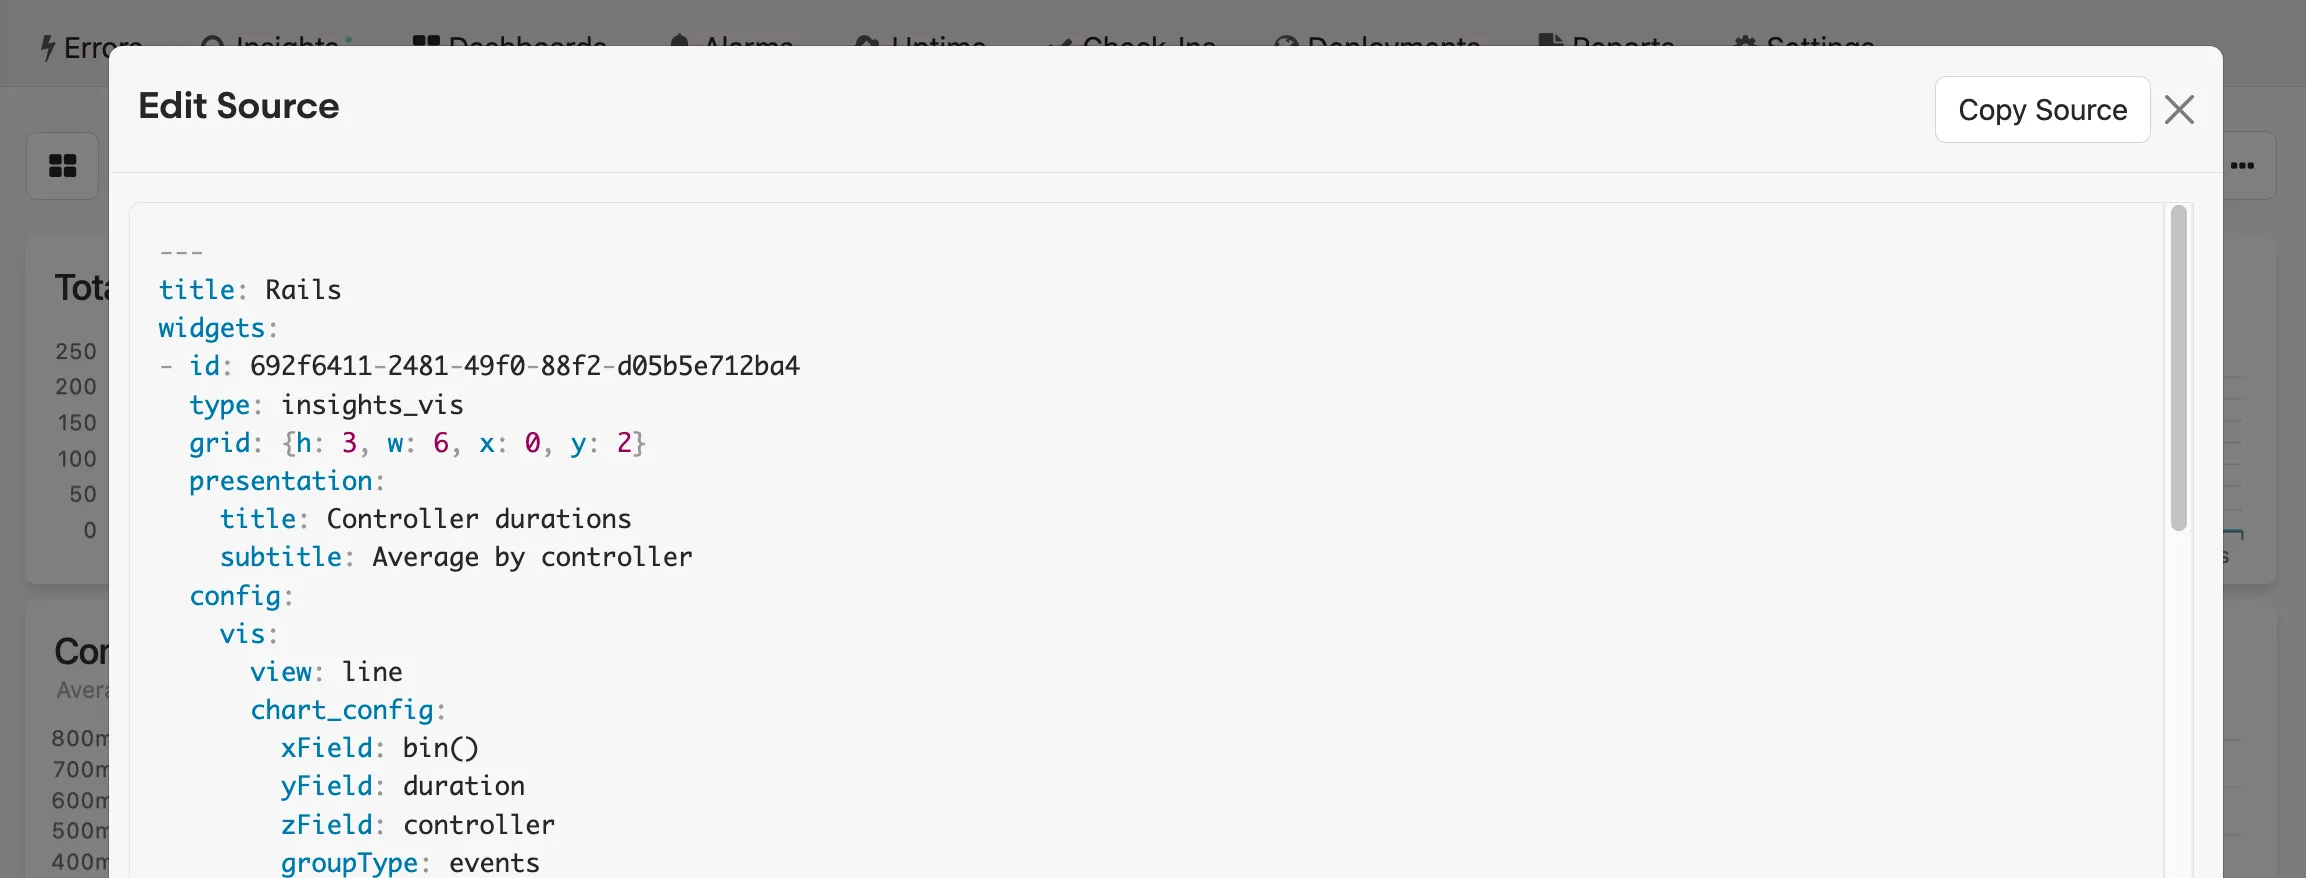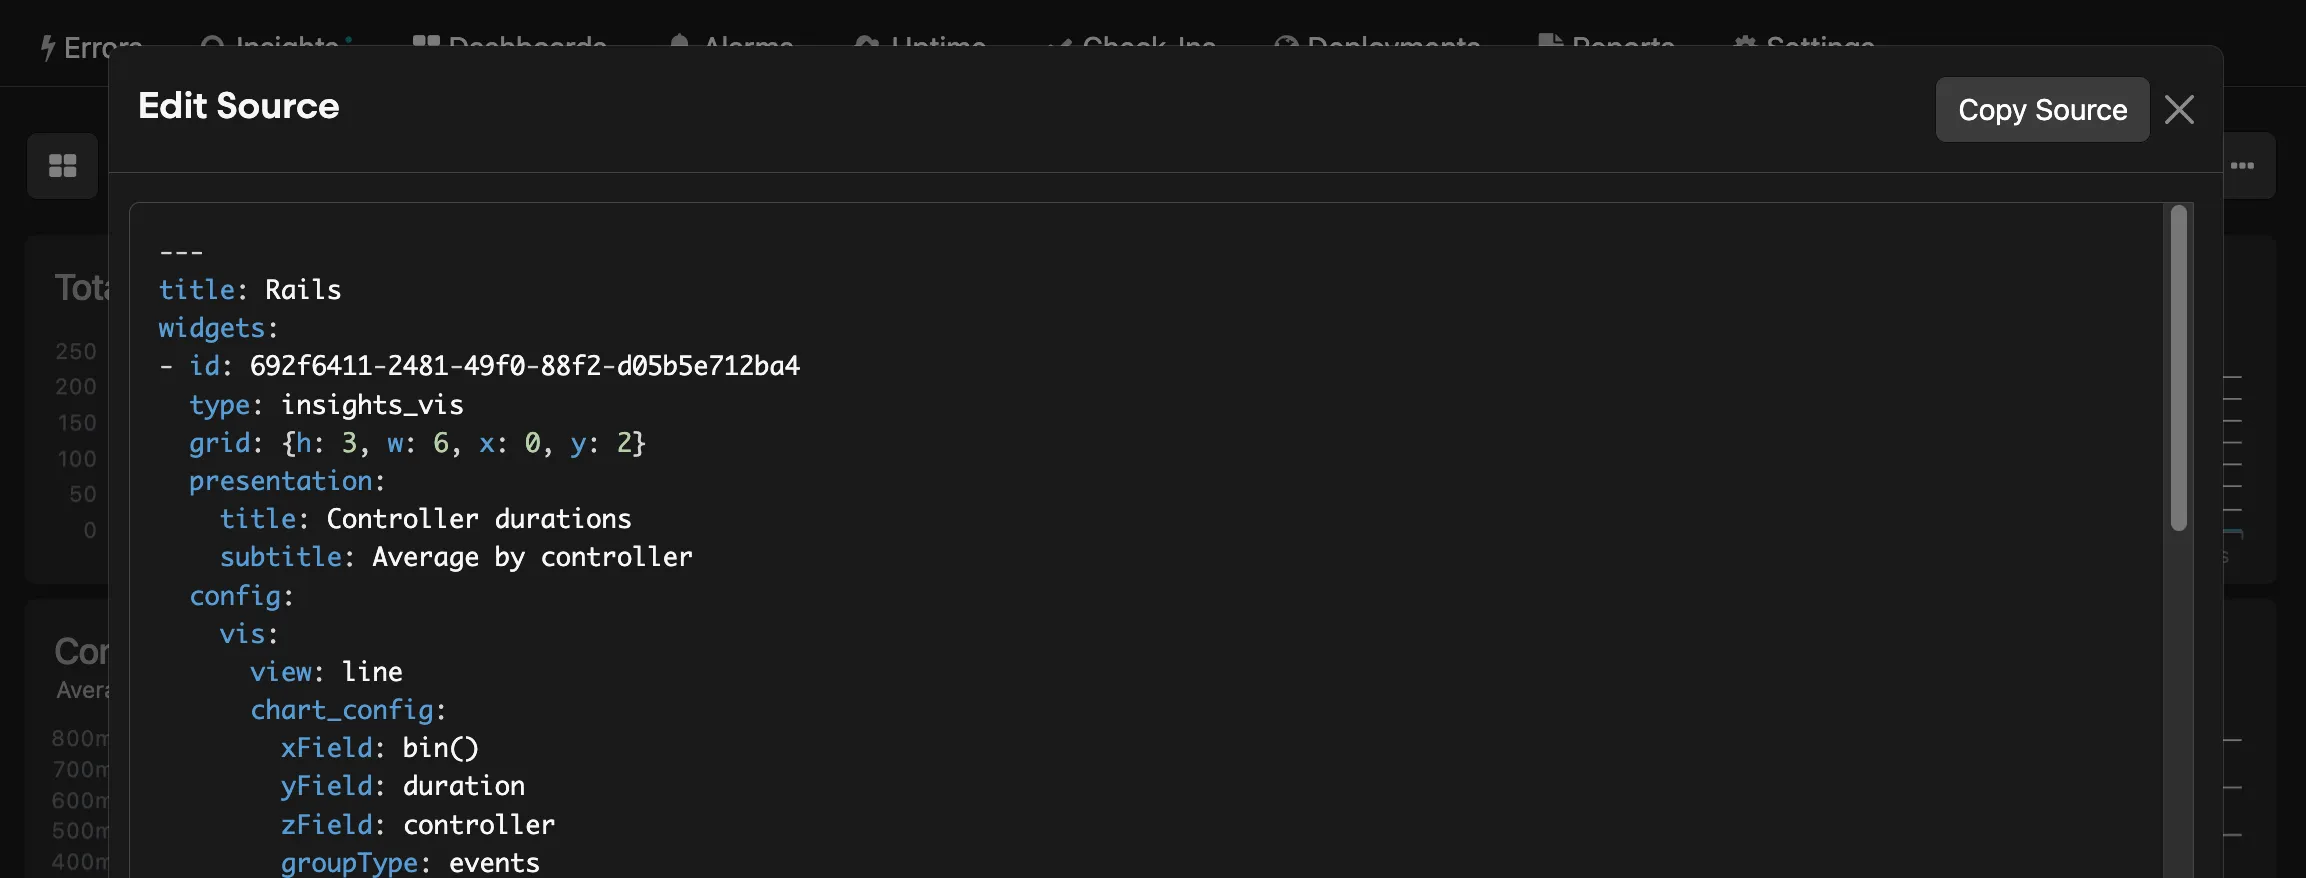 ## Available dashboards [Section titled “Available dashboards”](#available-dashboards) [Project Overview](/guides/dashboards/project-overview/)Deployments, errors, uptime, check-ins, and performance at a glance [Active Job](/guides/dashboards/active-job/)Job counts, durations, and failure rates by job class [Active Job Metrics](/guides/dashboards/active-job-metrics/)Pre-aggregated job throughput, durations, and stats by job class [Autotuner](/guides/dashboards/autotuner/)Heap growth, GC counts, and memory tuning suggestions [Celery](/guides/dashboards/celery/)Task counts by status, average durations, failures and retries [Django](/guides/dashboards/django/)Request durations, response status counts, slowest views and queries [Flask](/guides/dashboards/flask/)Request durations, response codes, and slowest views and queries by blueprint [Heroku](/guides/dashboards/heroku/)Router status codes, Postgres load averages, and slowest paths [Karafka](/guides/dashboards/karafka/)Consumer lag, processing durations, and broker errors by topic [Laravel](/guides/dashboards/laravel/)Request and job durations, response distributions, slowest controllers and queries [Net::HTTP Metrics](/guides/dashboards/net-http-metrics/)Outbound HTTP throughput, durations, and status codes by host [Oban](/guides/dashboards/oban/)Job counts by status, durations by worker, and slowest job runs [Phoenix](/guides/dashboards/phoenix/)Request stats, slowest controllers and Ecto queries, LiveView event performance [Puma](/guides/dashboards/puma/)Request backlog, running threads, and pool capacity over time [Rails](/guides/dashboards/rails/)Slow requests, queries, and partials; cache hit rates by controller [Rails Metrics](/guides/dashboards/rails-metrics/)Pre-aggregated throughput, controller durations, and DB/view timings [Sidekiq](/guides/dashboards/sidekiq/)Job counts, durations, and failure rates by worker [Sidekiq Metrics](/guides/dashboards/sidekiq-metrics/)Pre-aggregated job durations, queue depth, latency, and capacity [Solid Queue Metrics](/guides/dashboards/solid-queue-metrics/)Job statuses, active workers and dispatchers, and queue depths [System](/guides/dashboards/system/)CPU load averages, memory usage, and disk usage by device ## Next steps [Section titled “Next steps”](#next-steps) * Learn more about [Honeybadger Insights](/guides/insights/) * Try [BadgerQL](/guides/insights/badgerql/) to explore your data and create custom dashboard widgets * Set up [Insights Alarms](/guides/insights/alarms/) to turn your queries into actionable alerts * Send additional data from your [infrastructure](/guides/insights/#adding-data-from-other-sources) to Honeybadger
# Active Job dashboard
> Job counts, durations, and failure rates by job class
Drop in Dashboard for your ActiveJob instrumentation data Works with Solid Queue, GoodJob, and other ActiveJob backends. **This dashboard includes:** * Job counts over time by job class * Average job duration by job class over time * Job duration distribution (binned by 100ms, by job class) * Job status counts (success/failure) by job class * Aggregate job stats: successes, failures, total and average execution time * 10 slowest job runs (with details) To get started, make sure you have updated your Honeybadger gem to `>= 6.3`, then enable Insights instrumentation by including this in your `config/honeybadger.yml`:
```yaml
insights:
enabled: true
```
Check out the [Honeybadger client documentation](https://docs.honeybadger.io/lib/ruby/getting-started/sending-events-to-insights/) for more information. 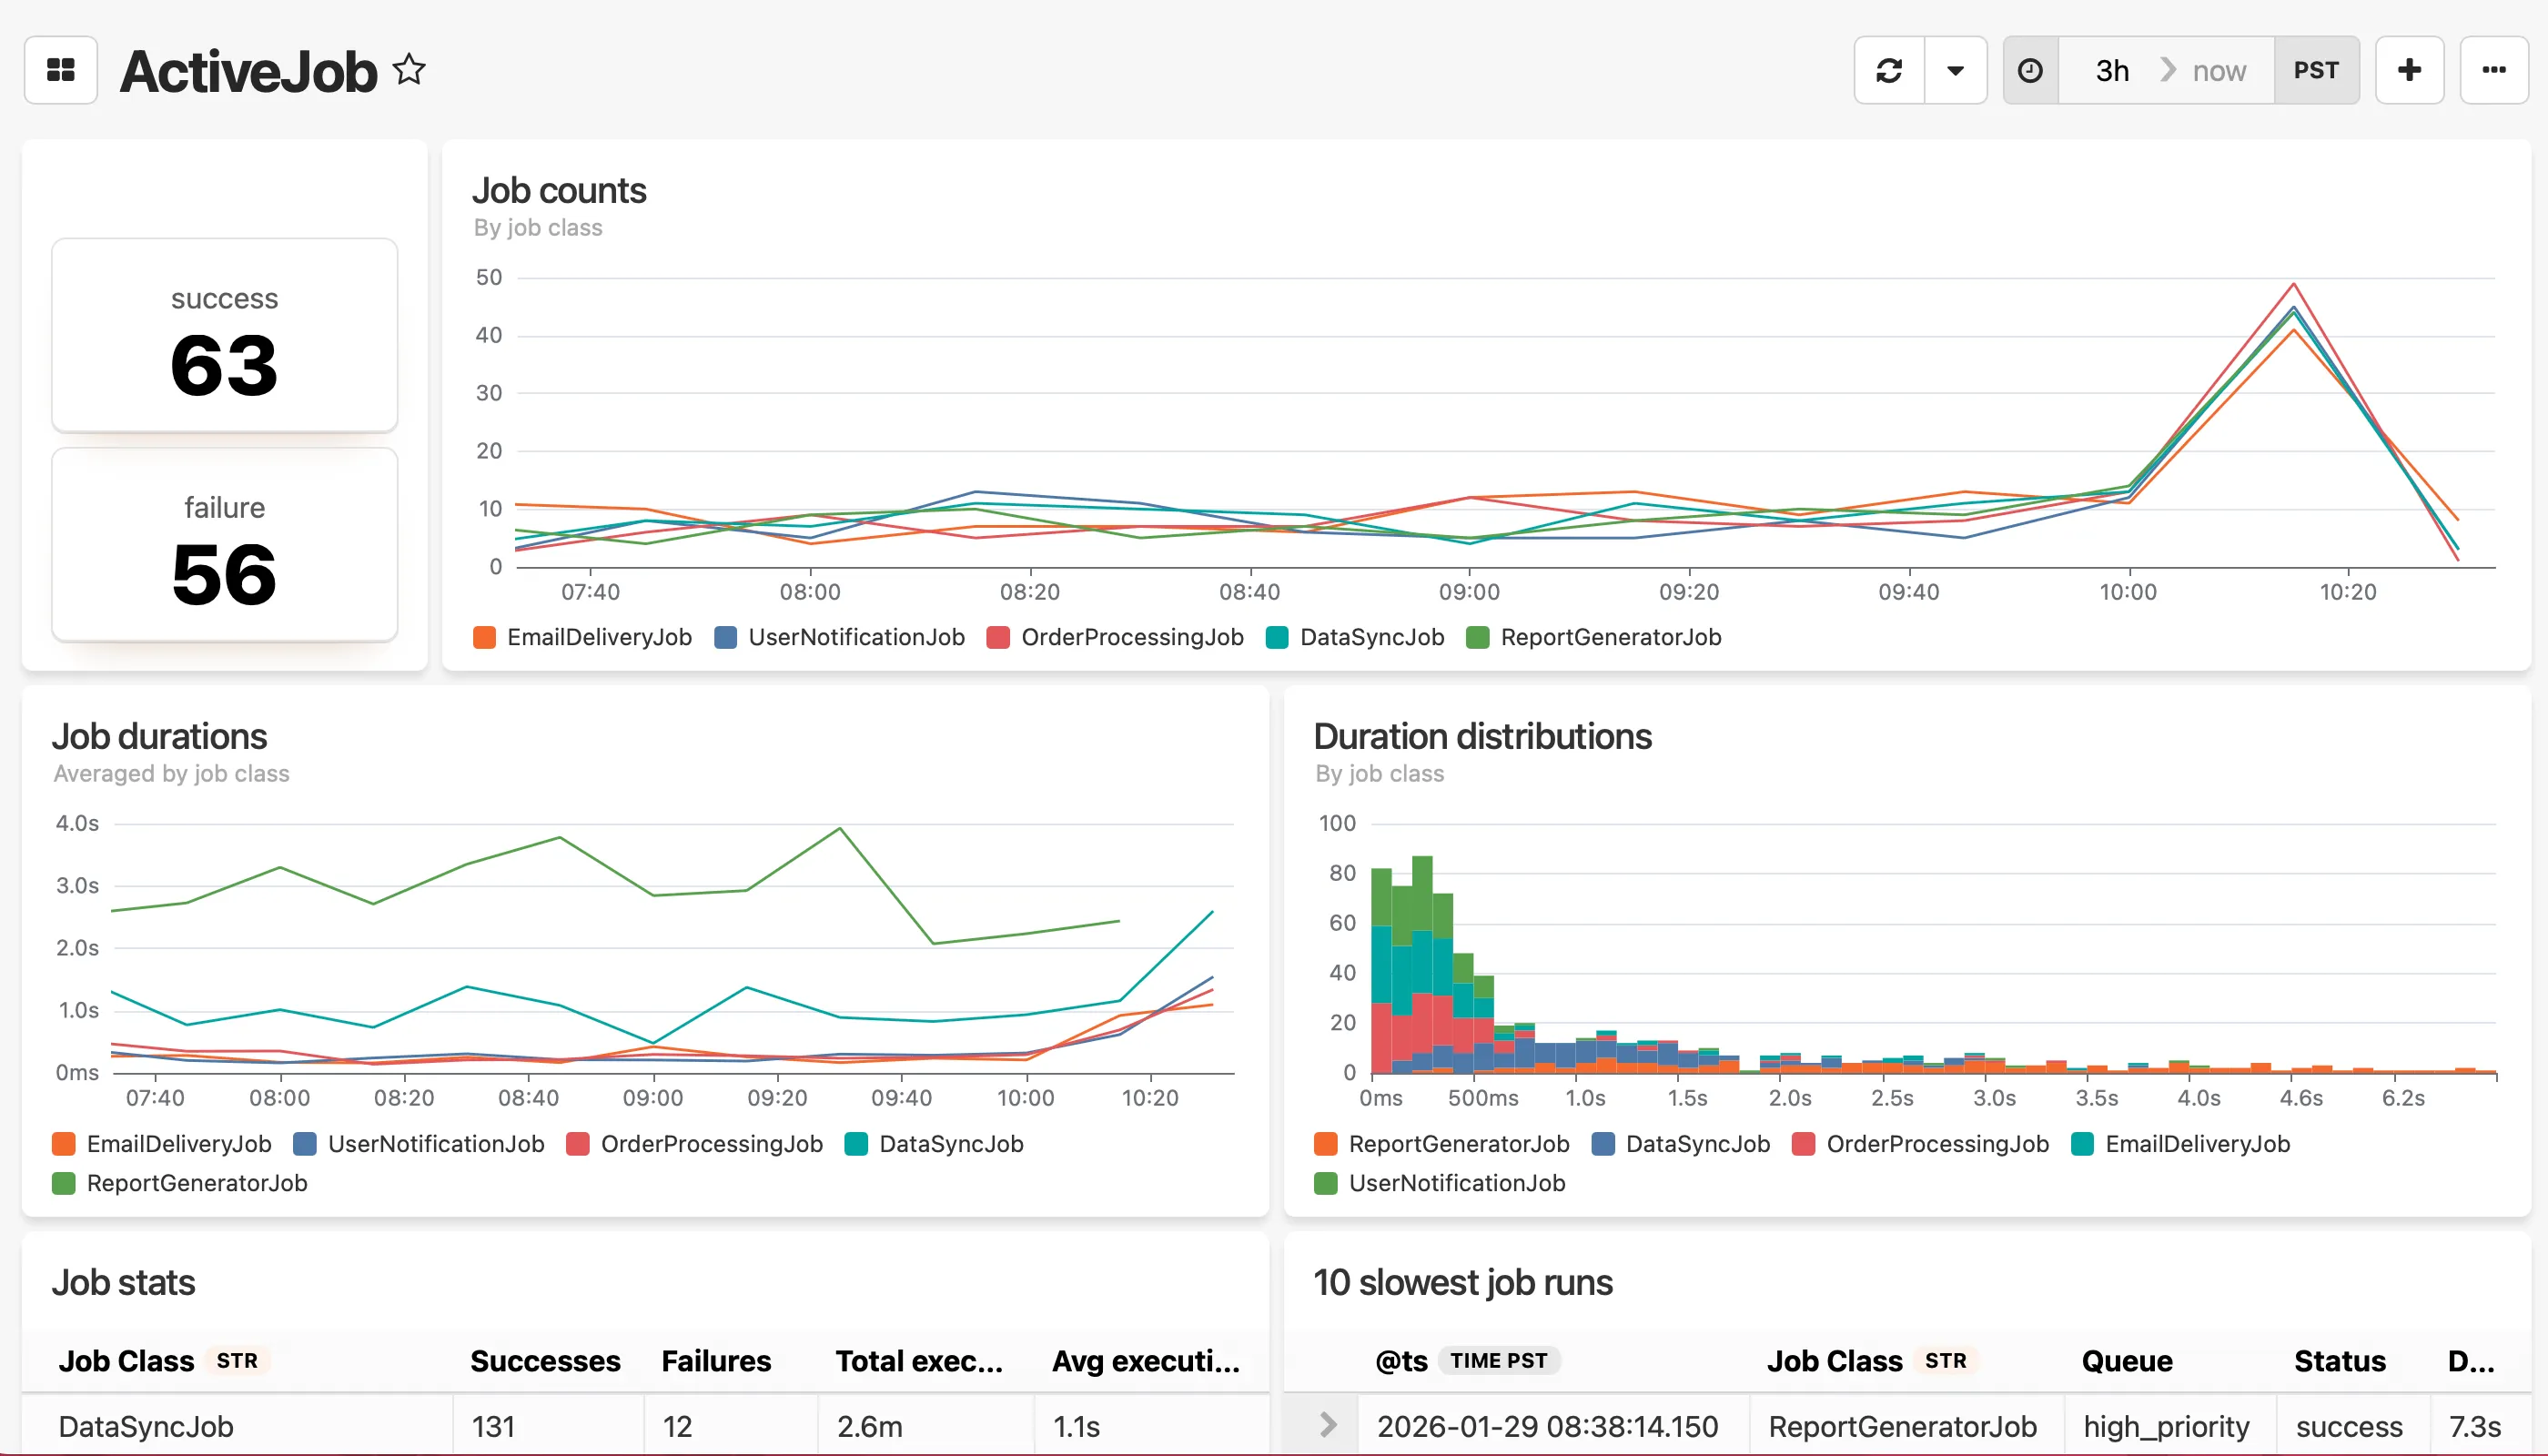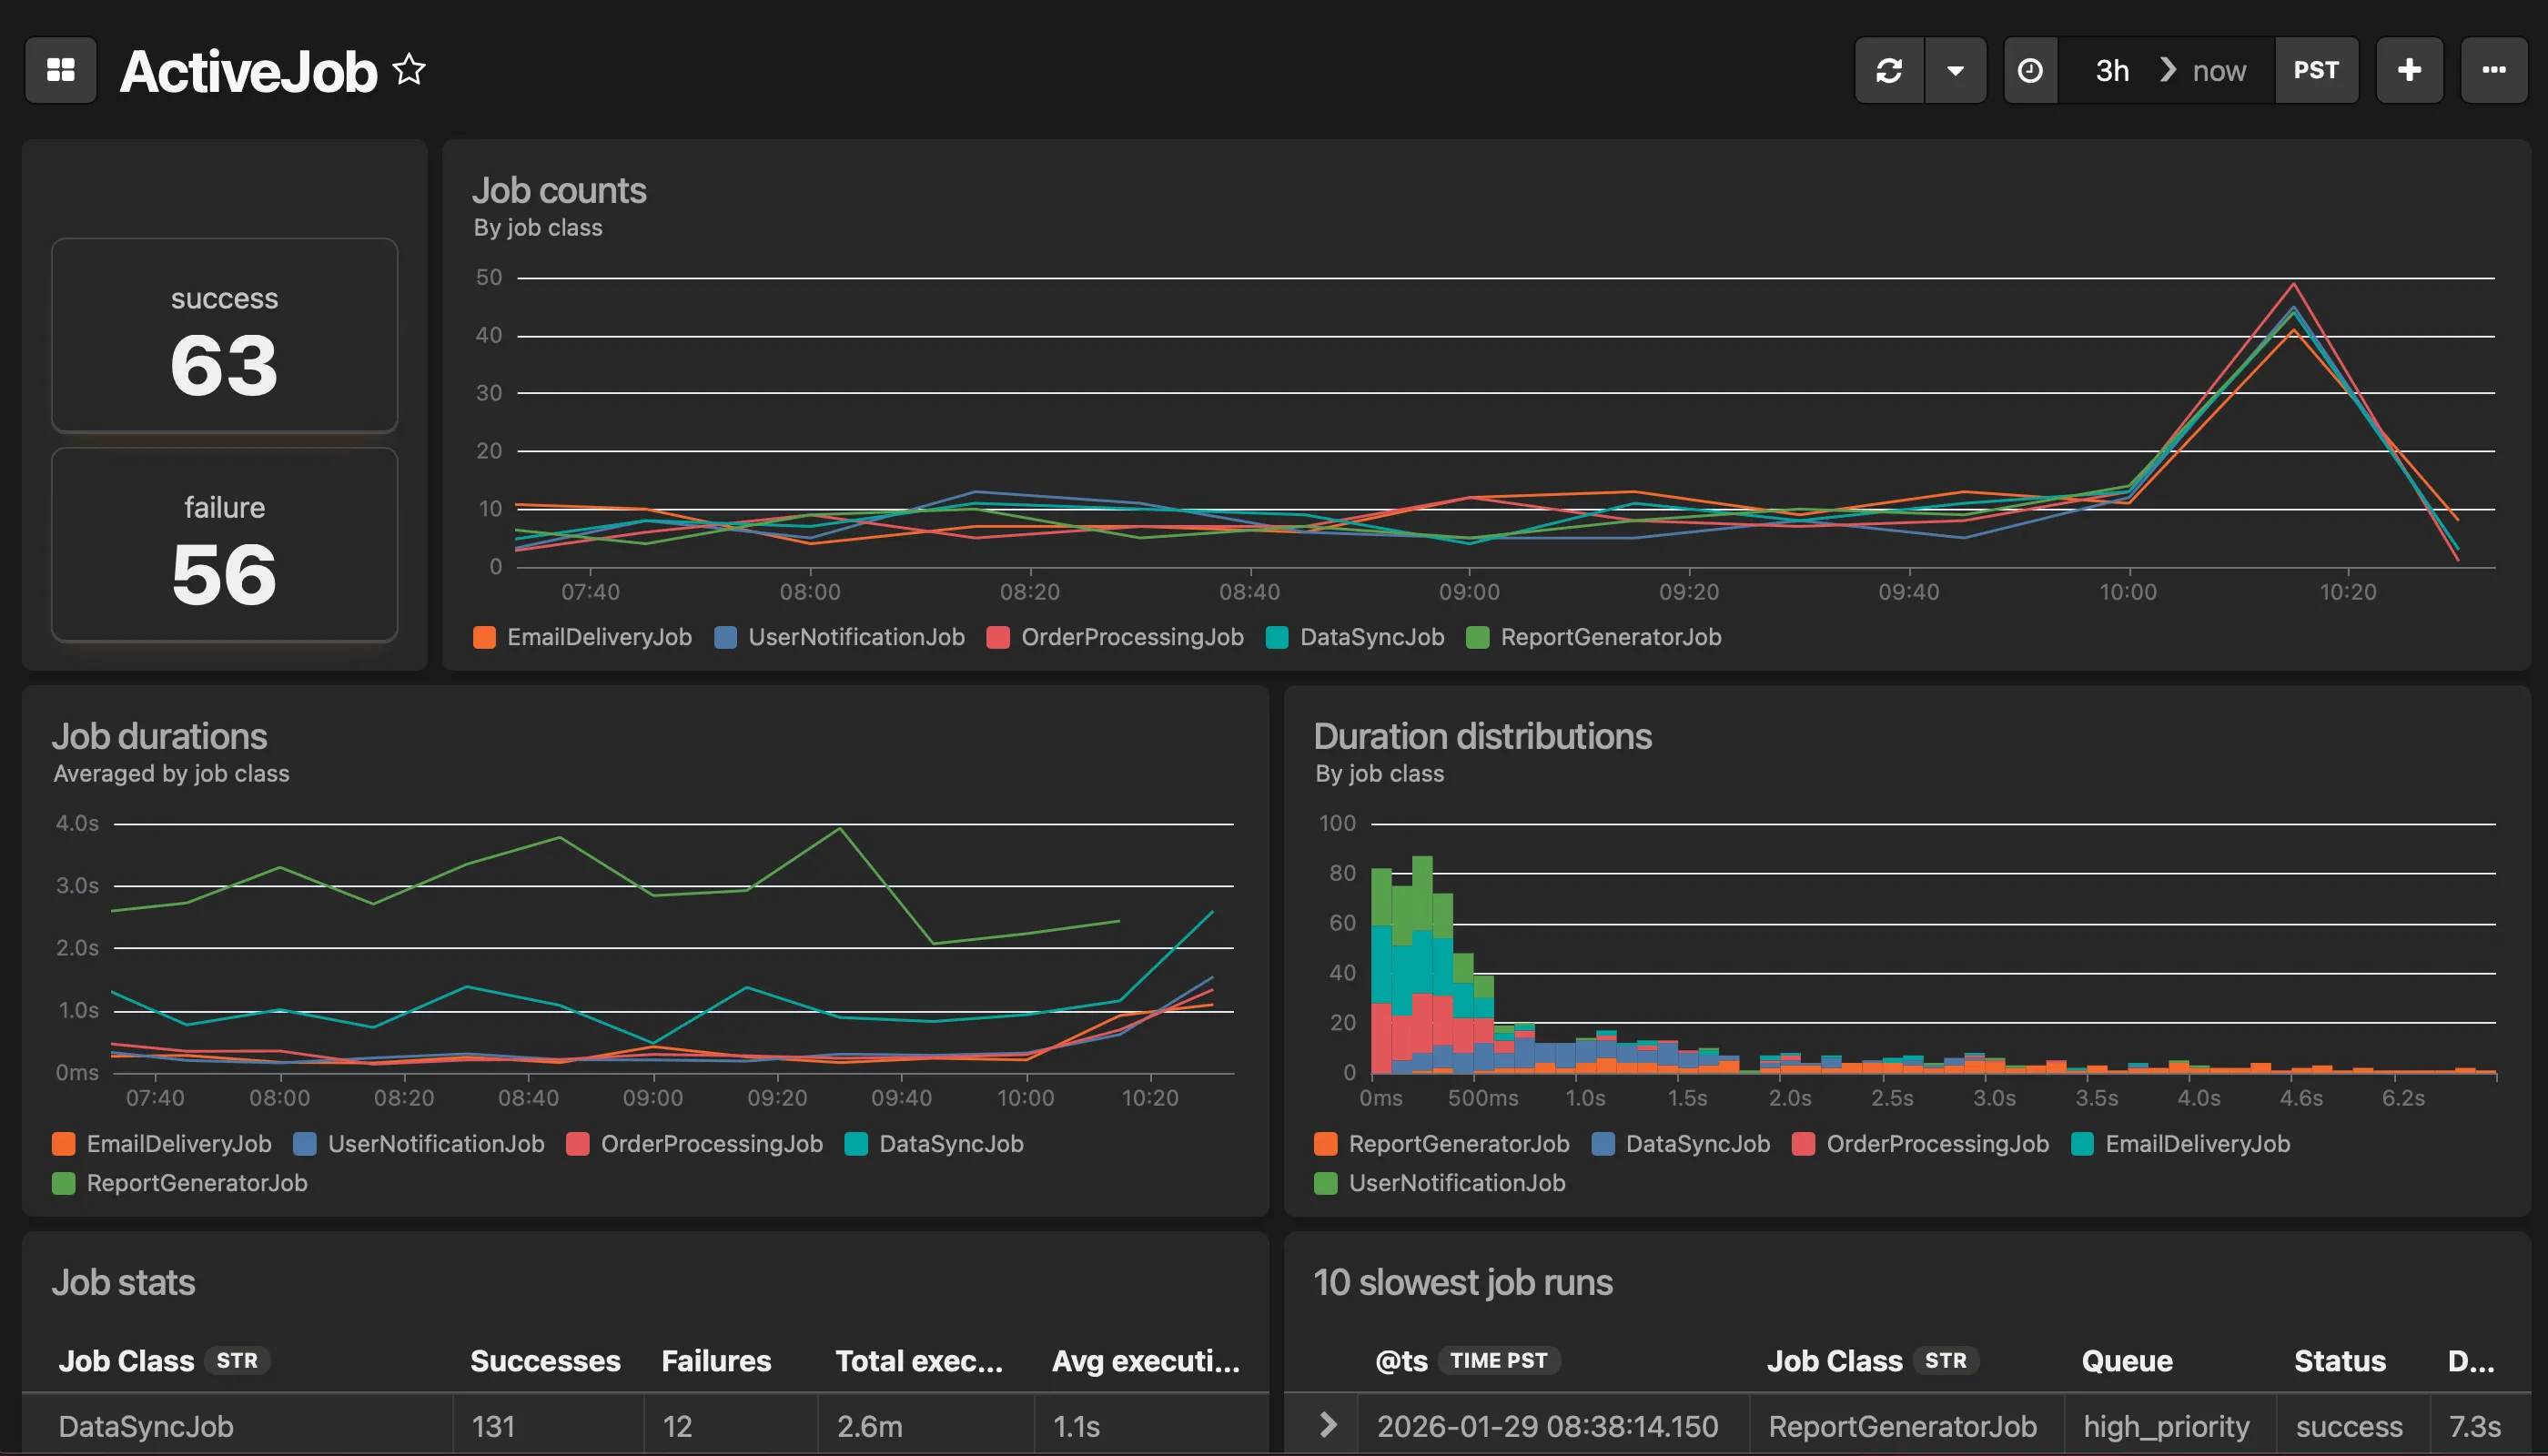
# Active Job Metrics dashboard
> Pre-aggregated job throughput, durations, and stats by job class
Drop in Dashboard for your ActiveJob metrics data This is the metrics-based counterpart to the ActiveJob (events) dashboard. Works with Solid Queue, GoodJob, and other ActiveJob backends. **This dashboard includes:** * Job throughput over time by job class * Job durations over time by job class * Job stats with min, max, avg durations To get started, make sure you have updated your Honeybadger gem to `>= 6.3`, then enable Insights metrics by including this in your `config/honeybadger.yml`:
```yaml
insights:
enabled: true
rails:
insights:
metrics: true
```
Check out the [Honeybadger client documentation](https://docs.honeybadger.io/lib/ruby/getting-started/sending-events-to-insights/) for more information. 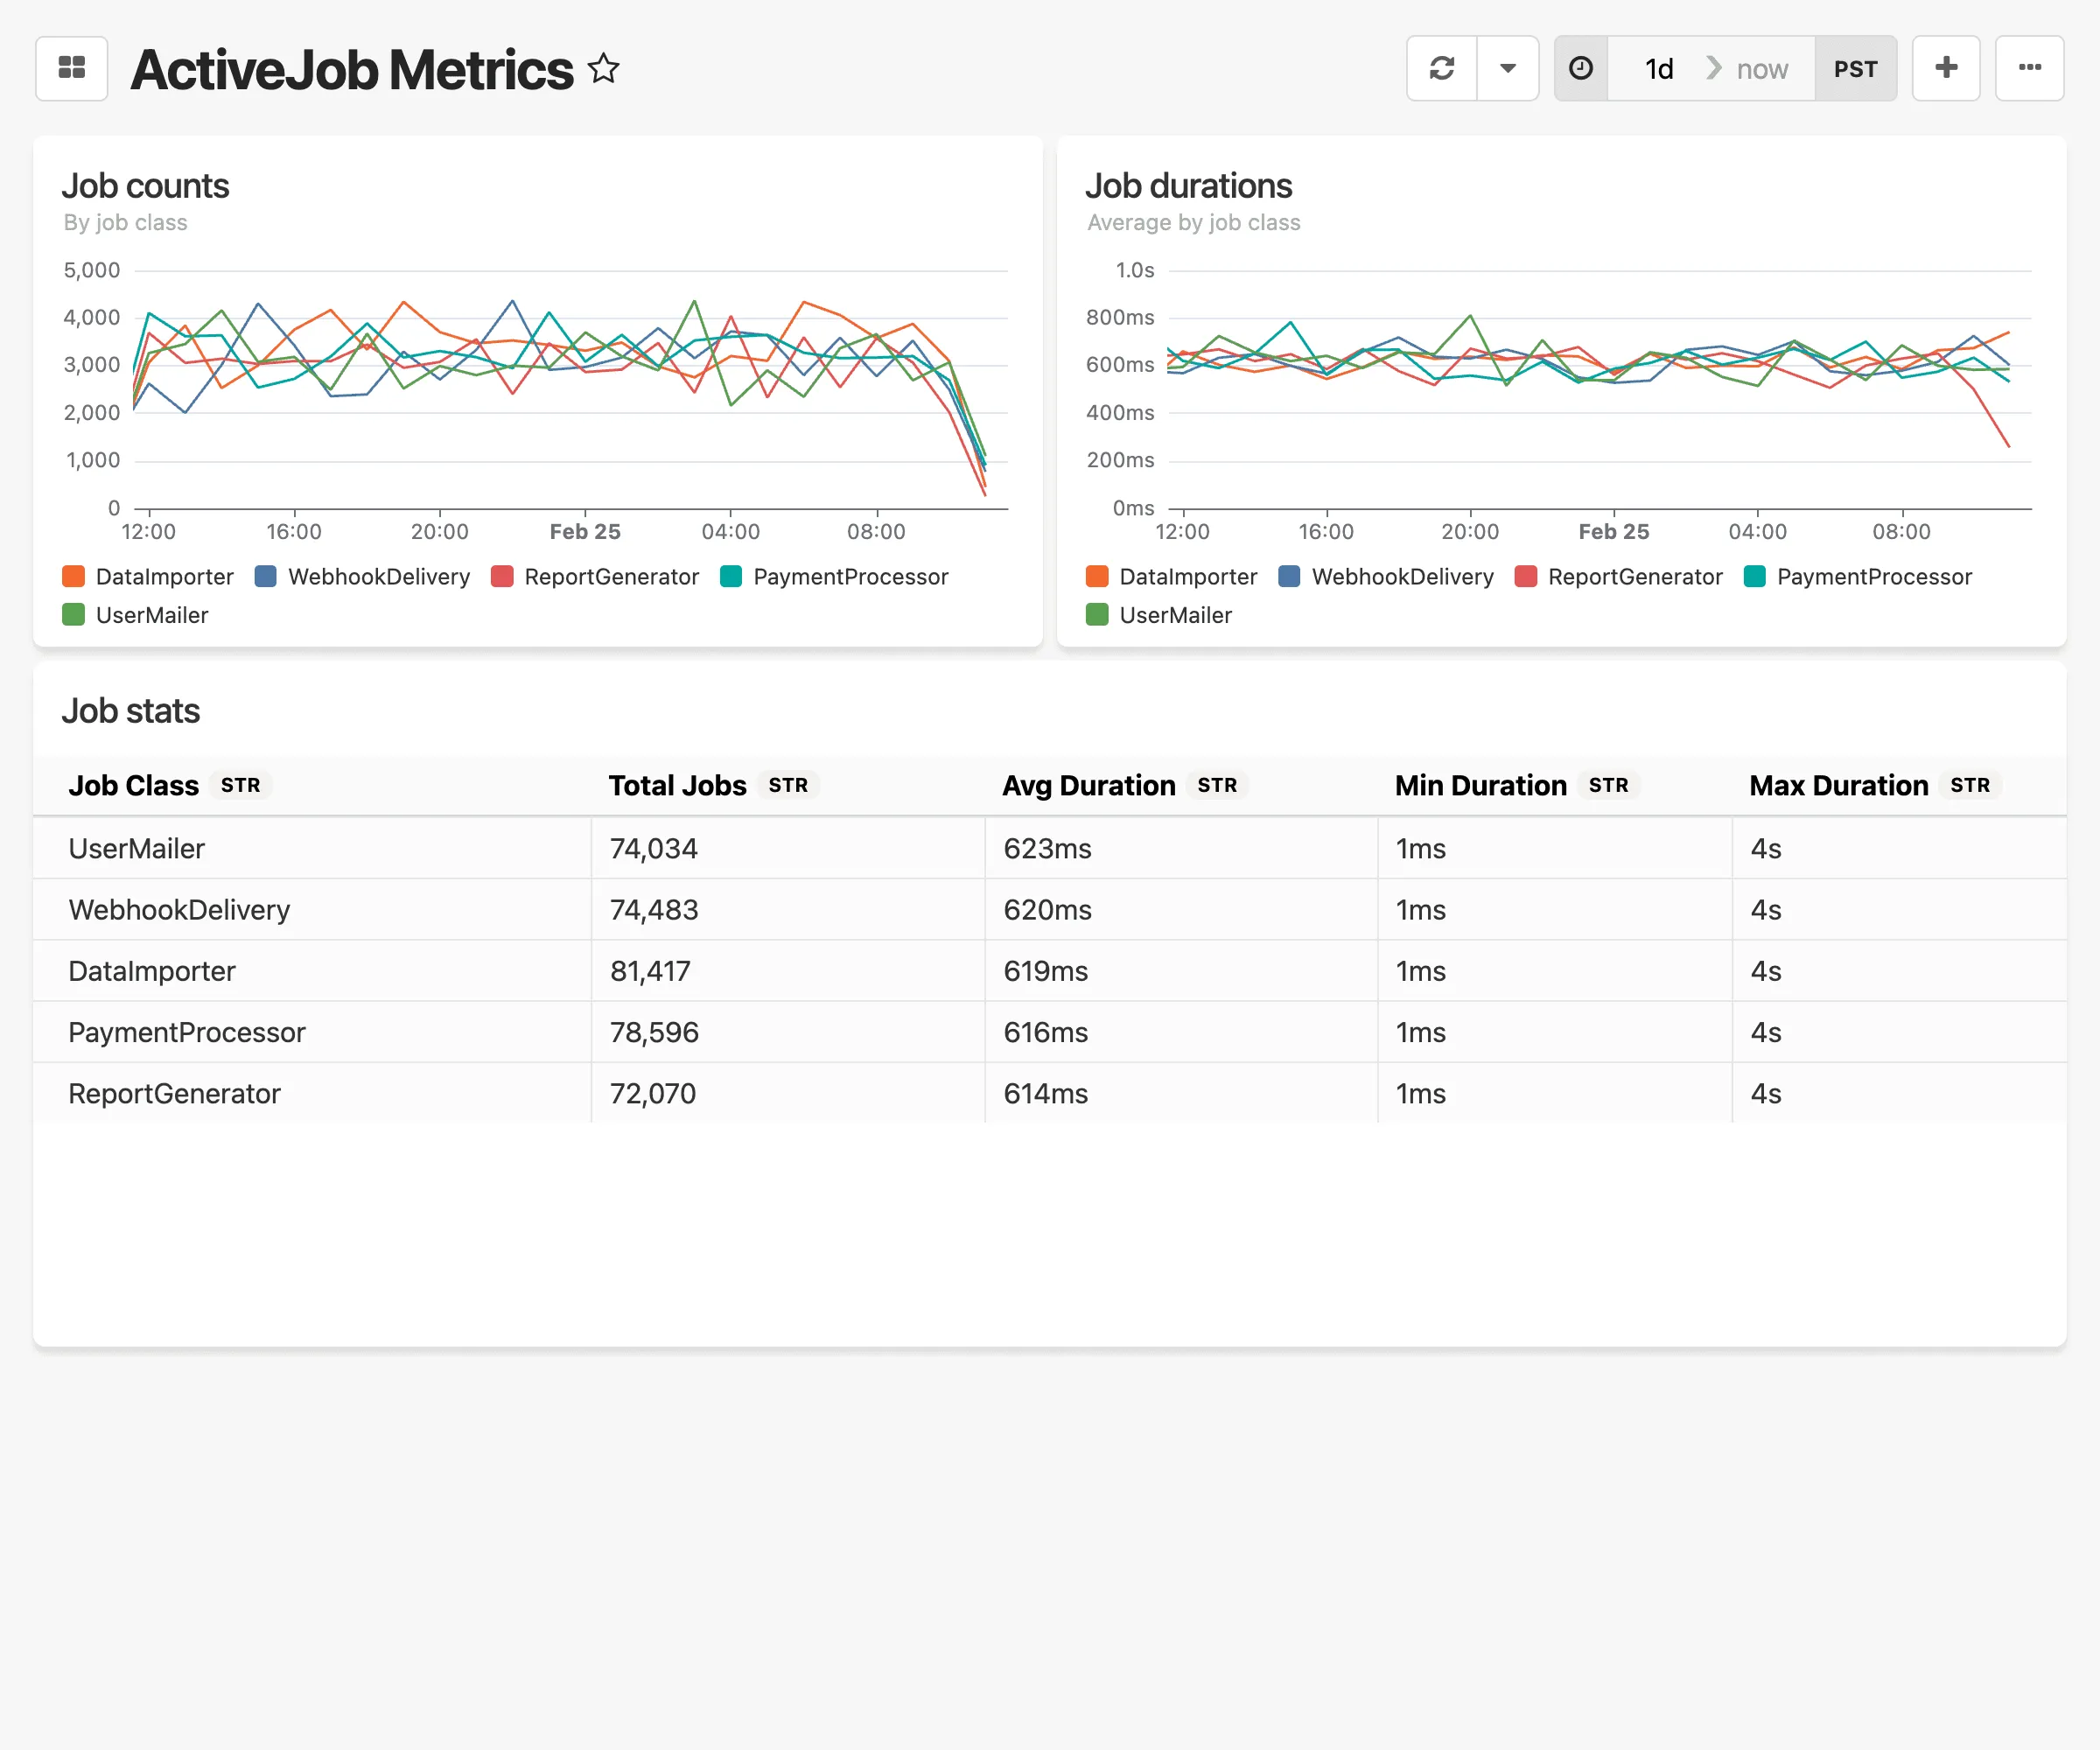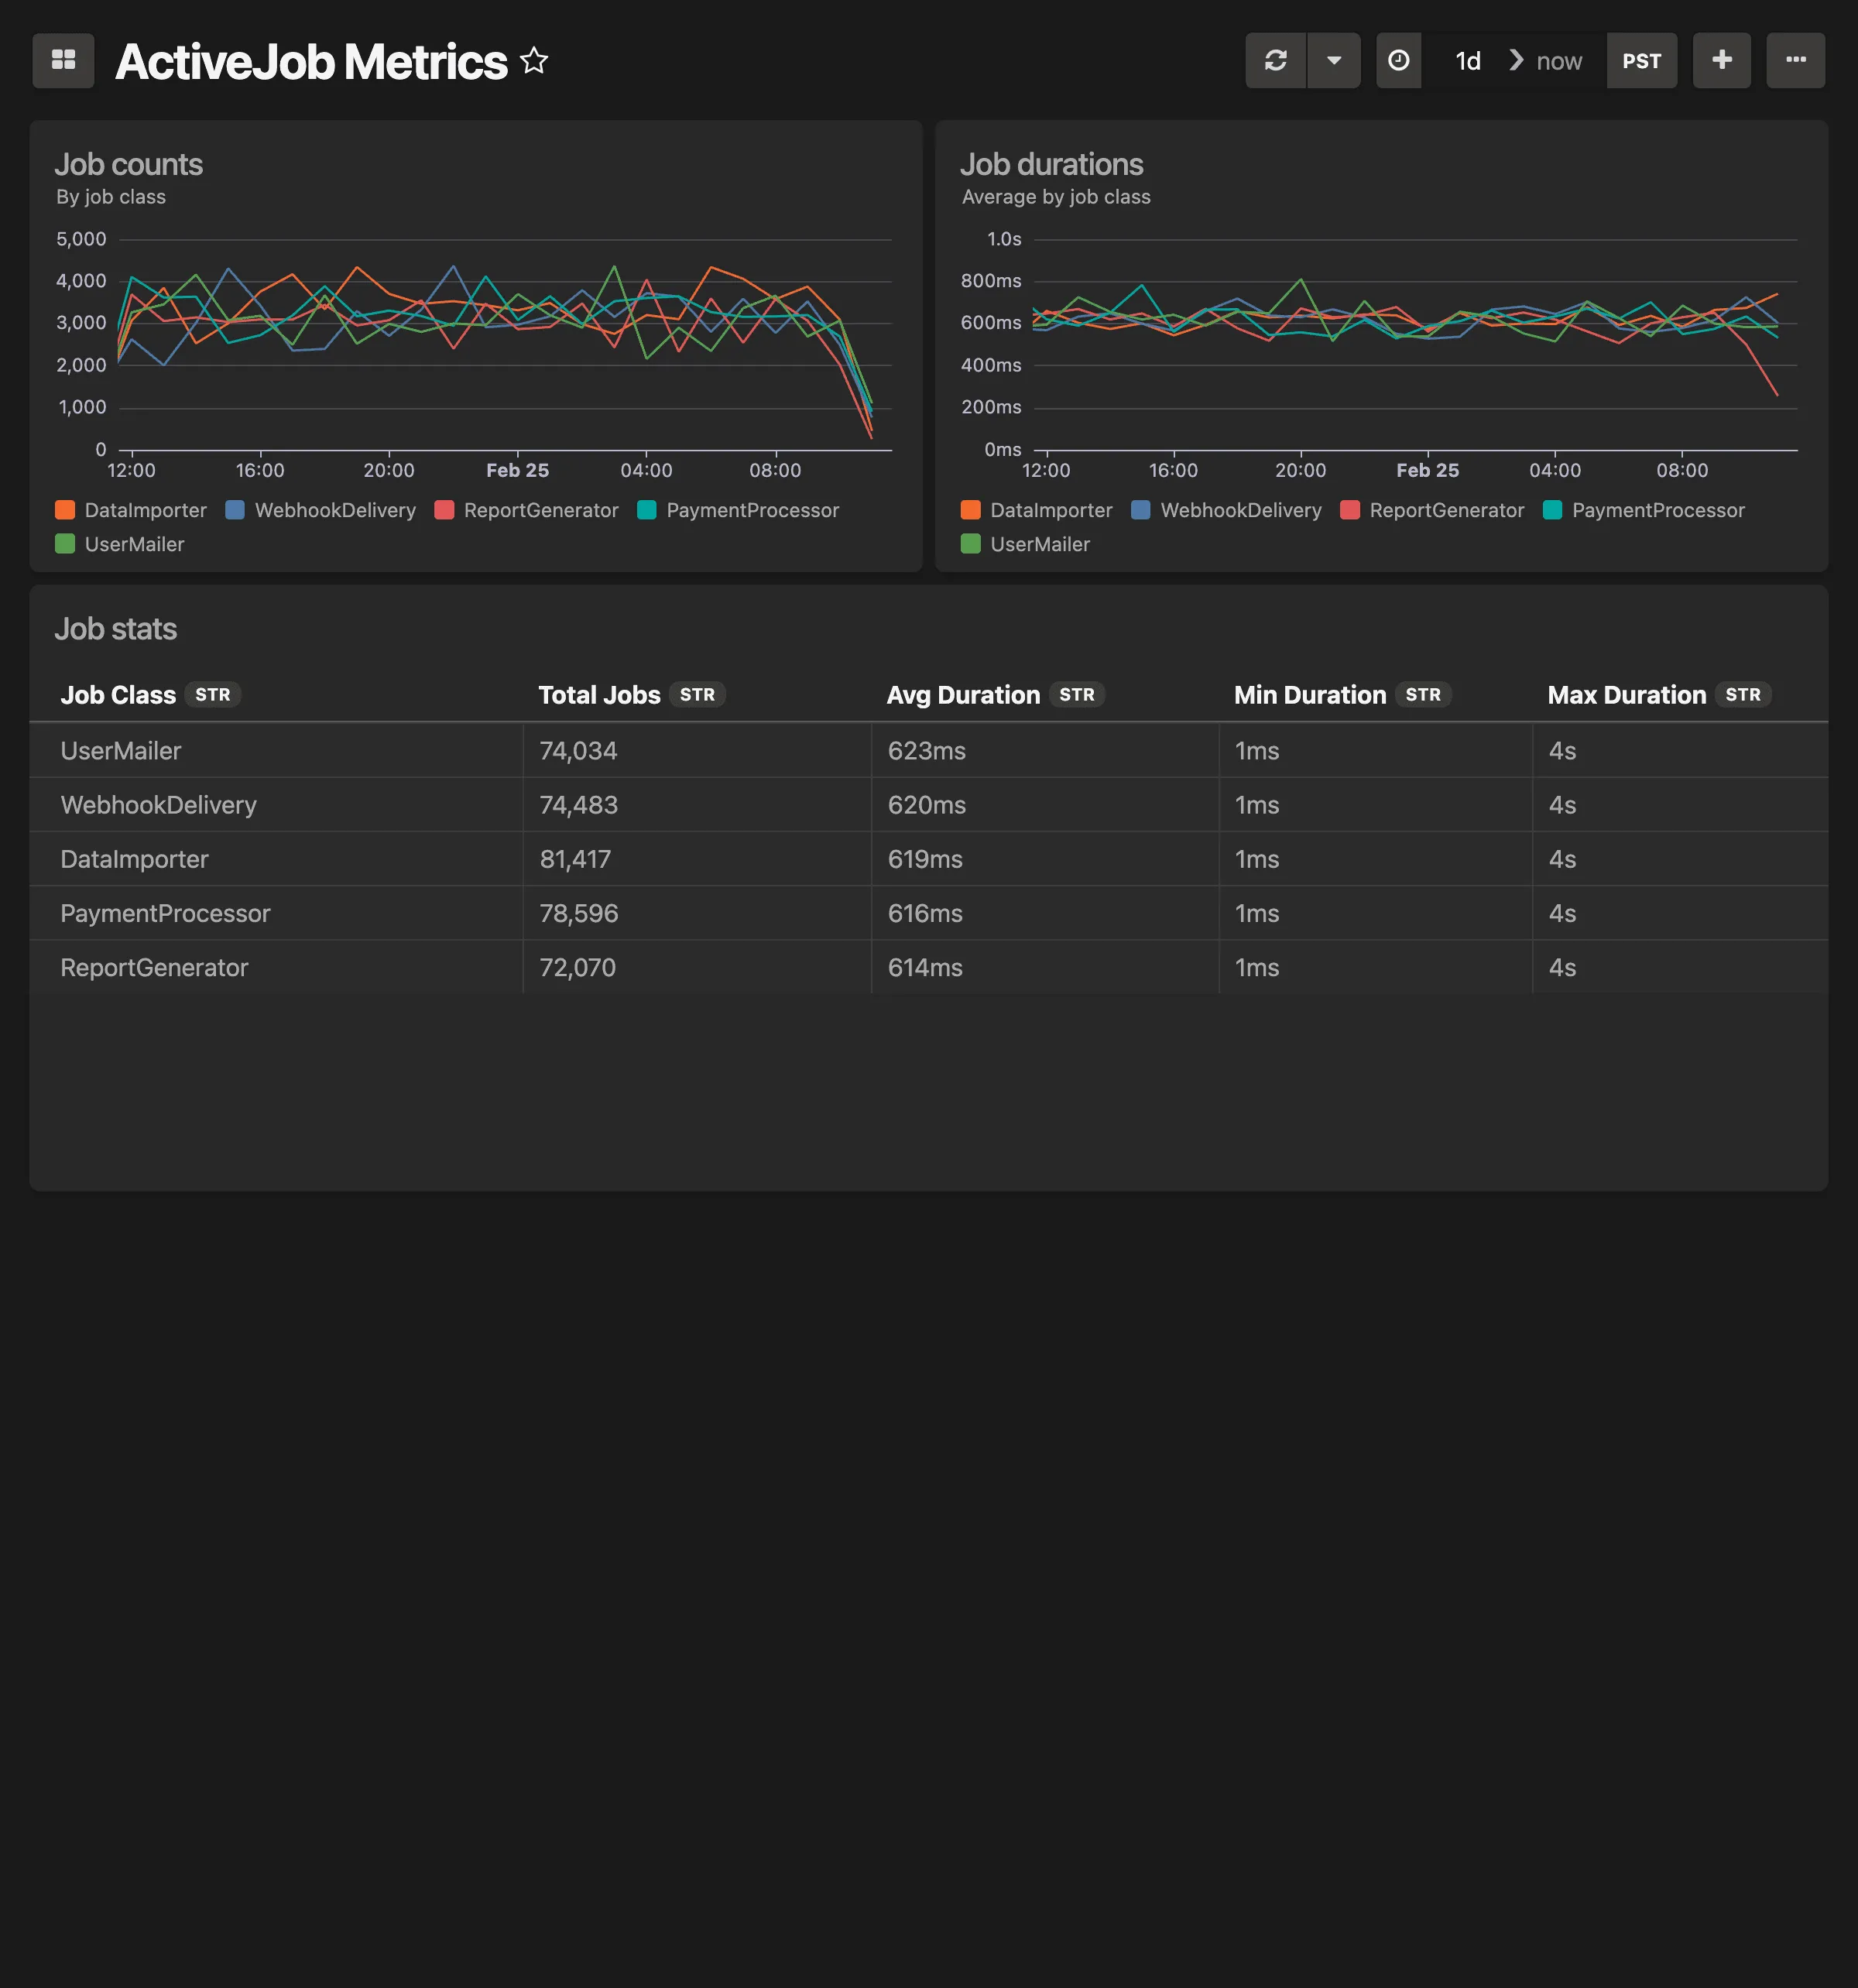
# Autotuner dashboard
> Heap growth, GC counts, and memory tuning suggestions
Drop in Dashboard for your Autotuner stats and reports **This dashboard includes:** * Heap Pages over time * Request Time over time * Garbage Collection Count over time * Autotuner Report suggestions To get started, make sure you have updated your Honeybadger gem to `>= 5.26`, then enable Insights instrumentation by including this in your `config/honeybadger.yml`:
```yaml
insights:
enabled: true
```
Check out the [Honeybadger client documentation](https://docs.honeybadger.io/lib/ruby/getting-started/sending-events-to-insights/) for more information. 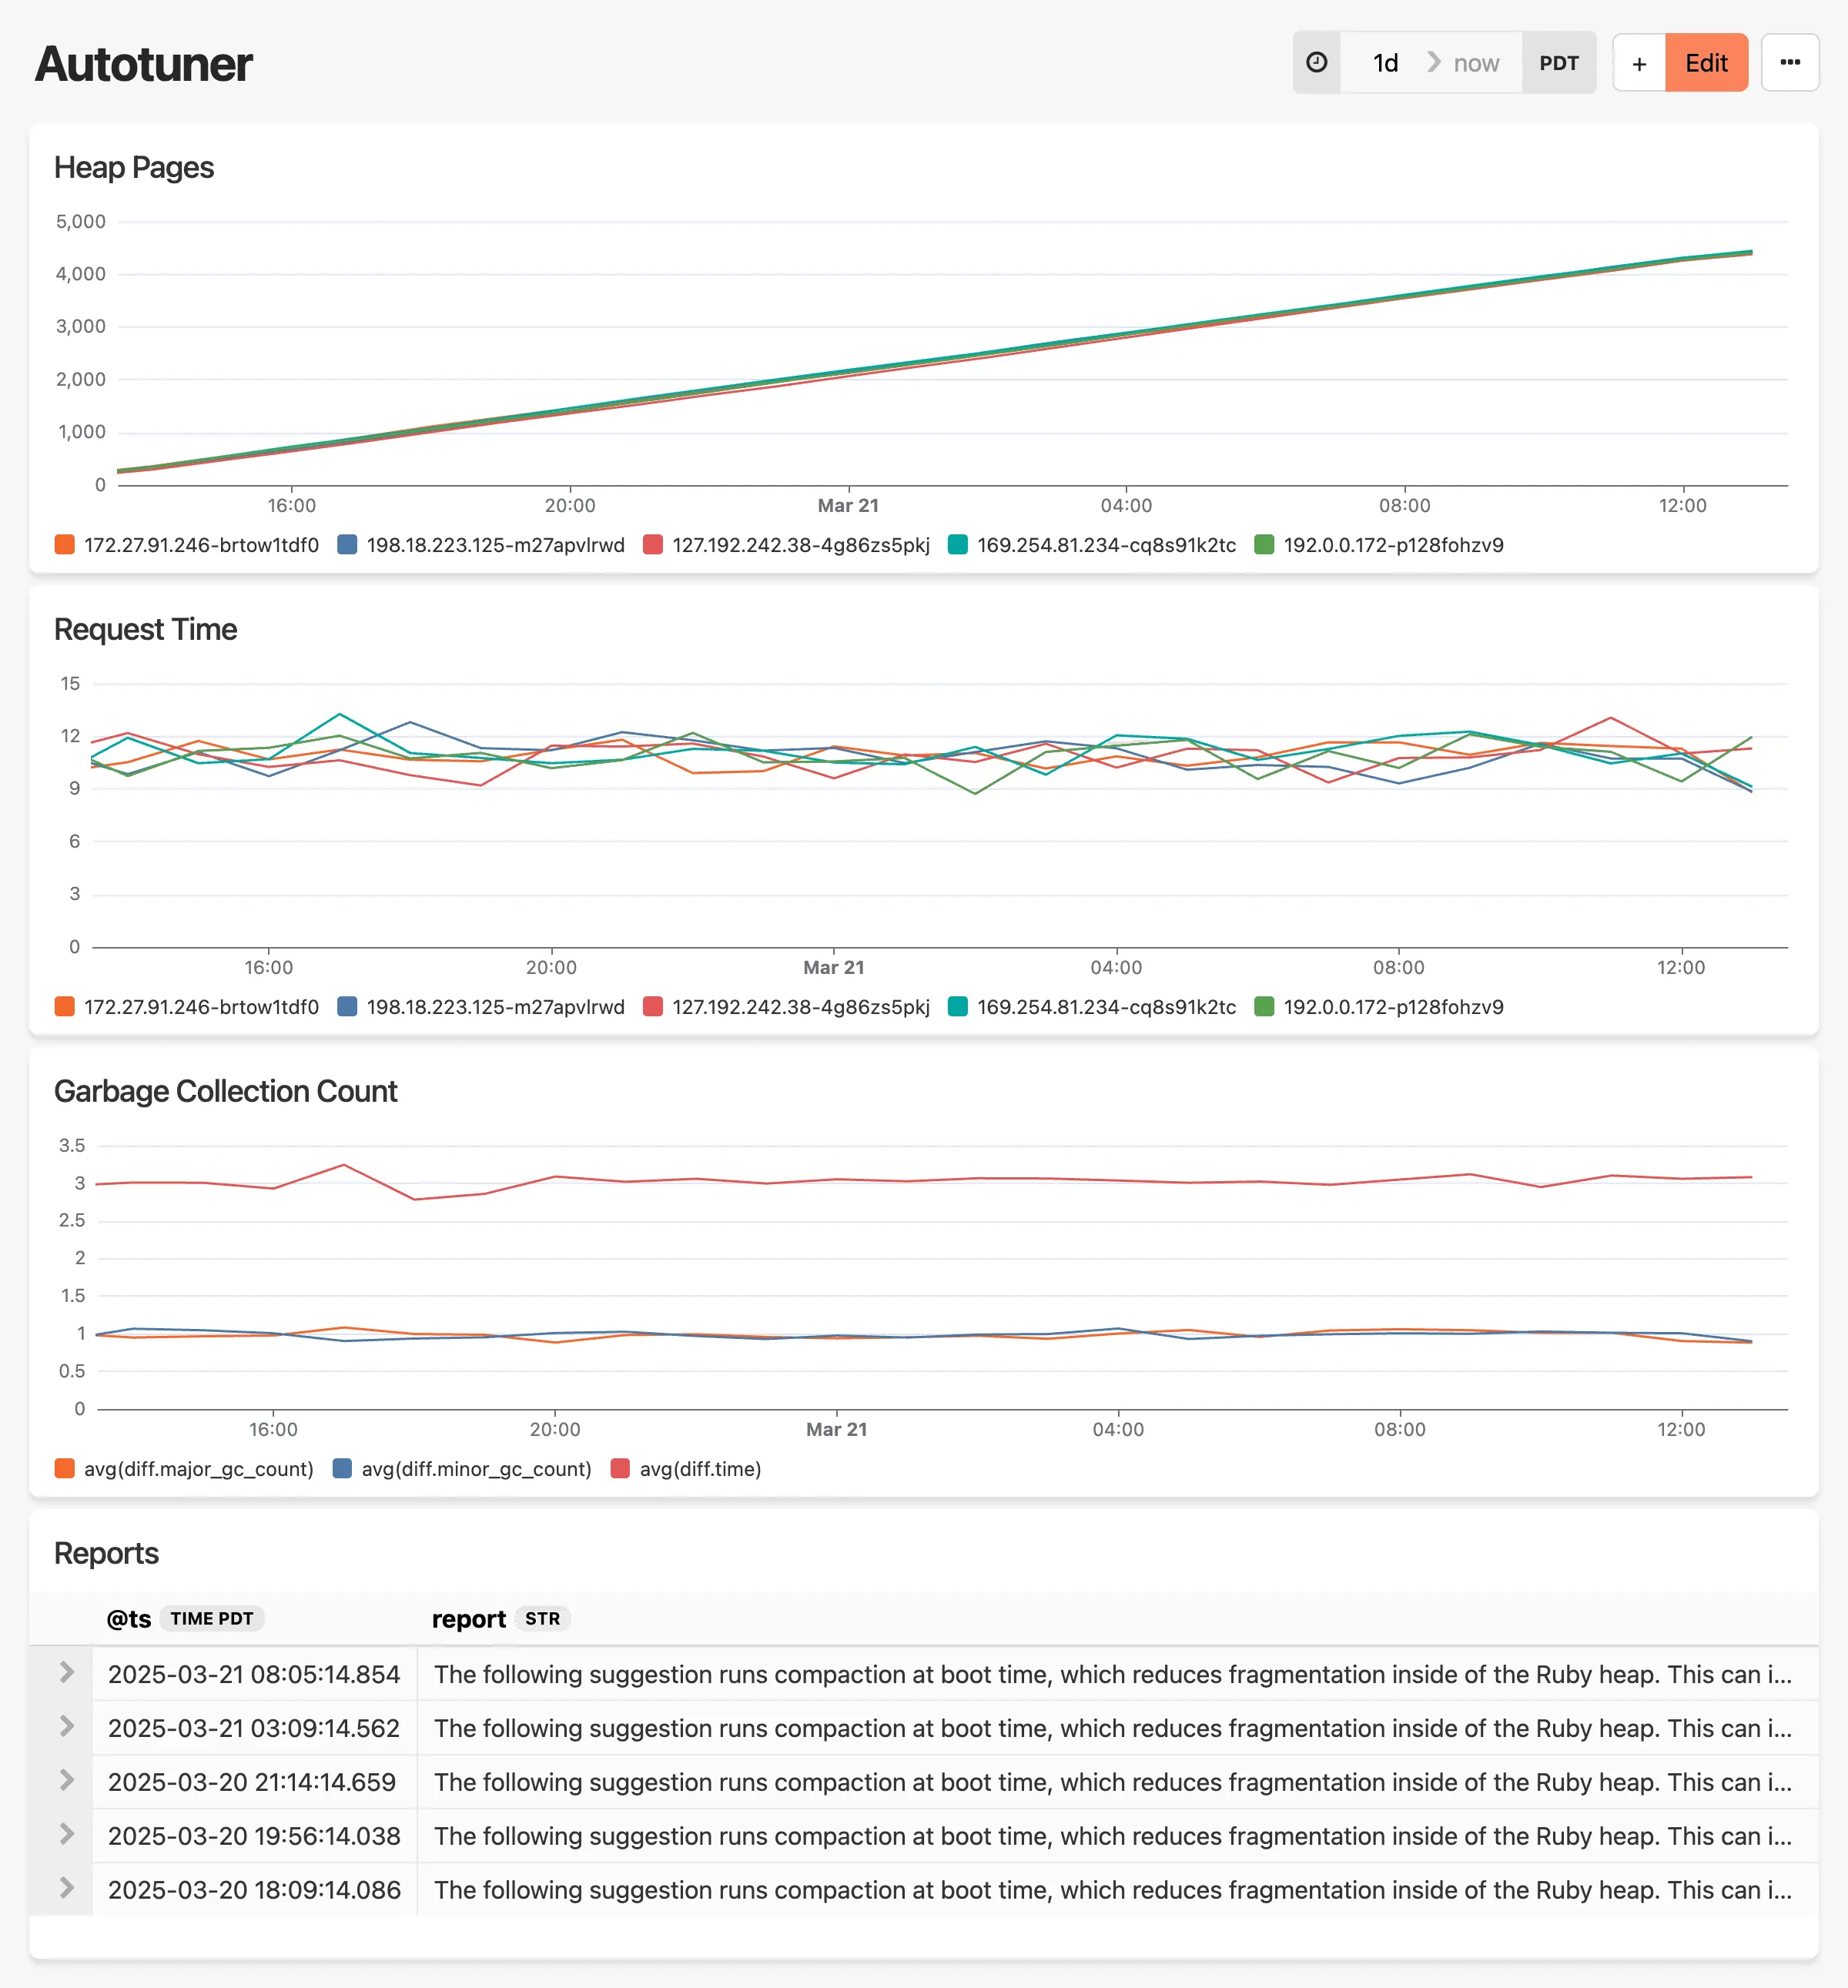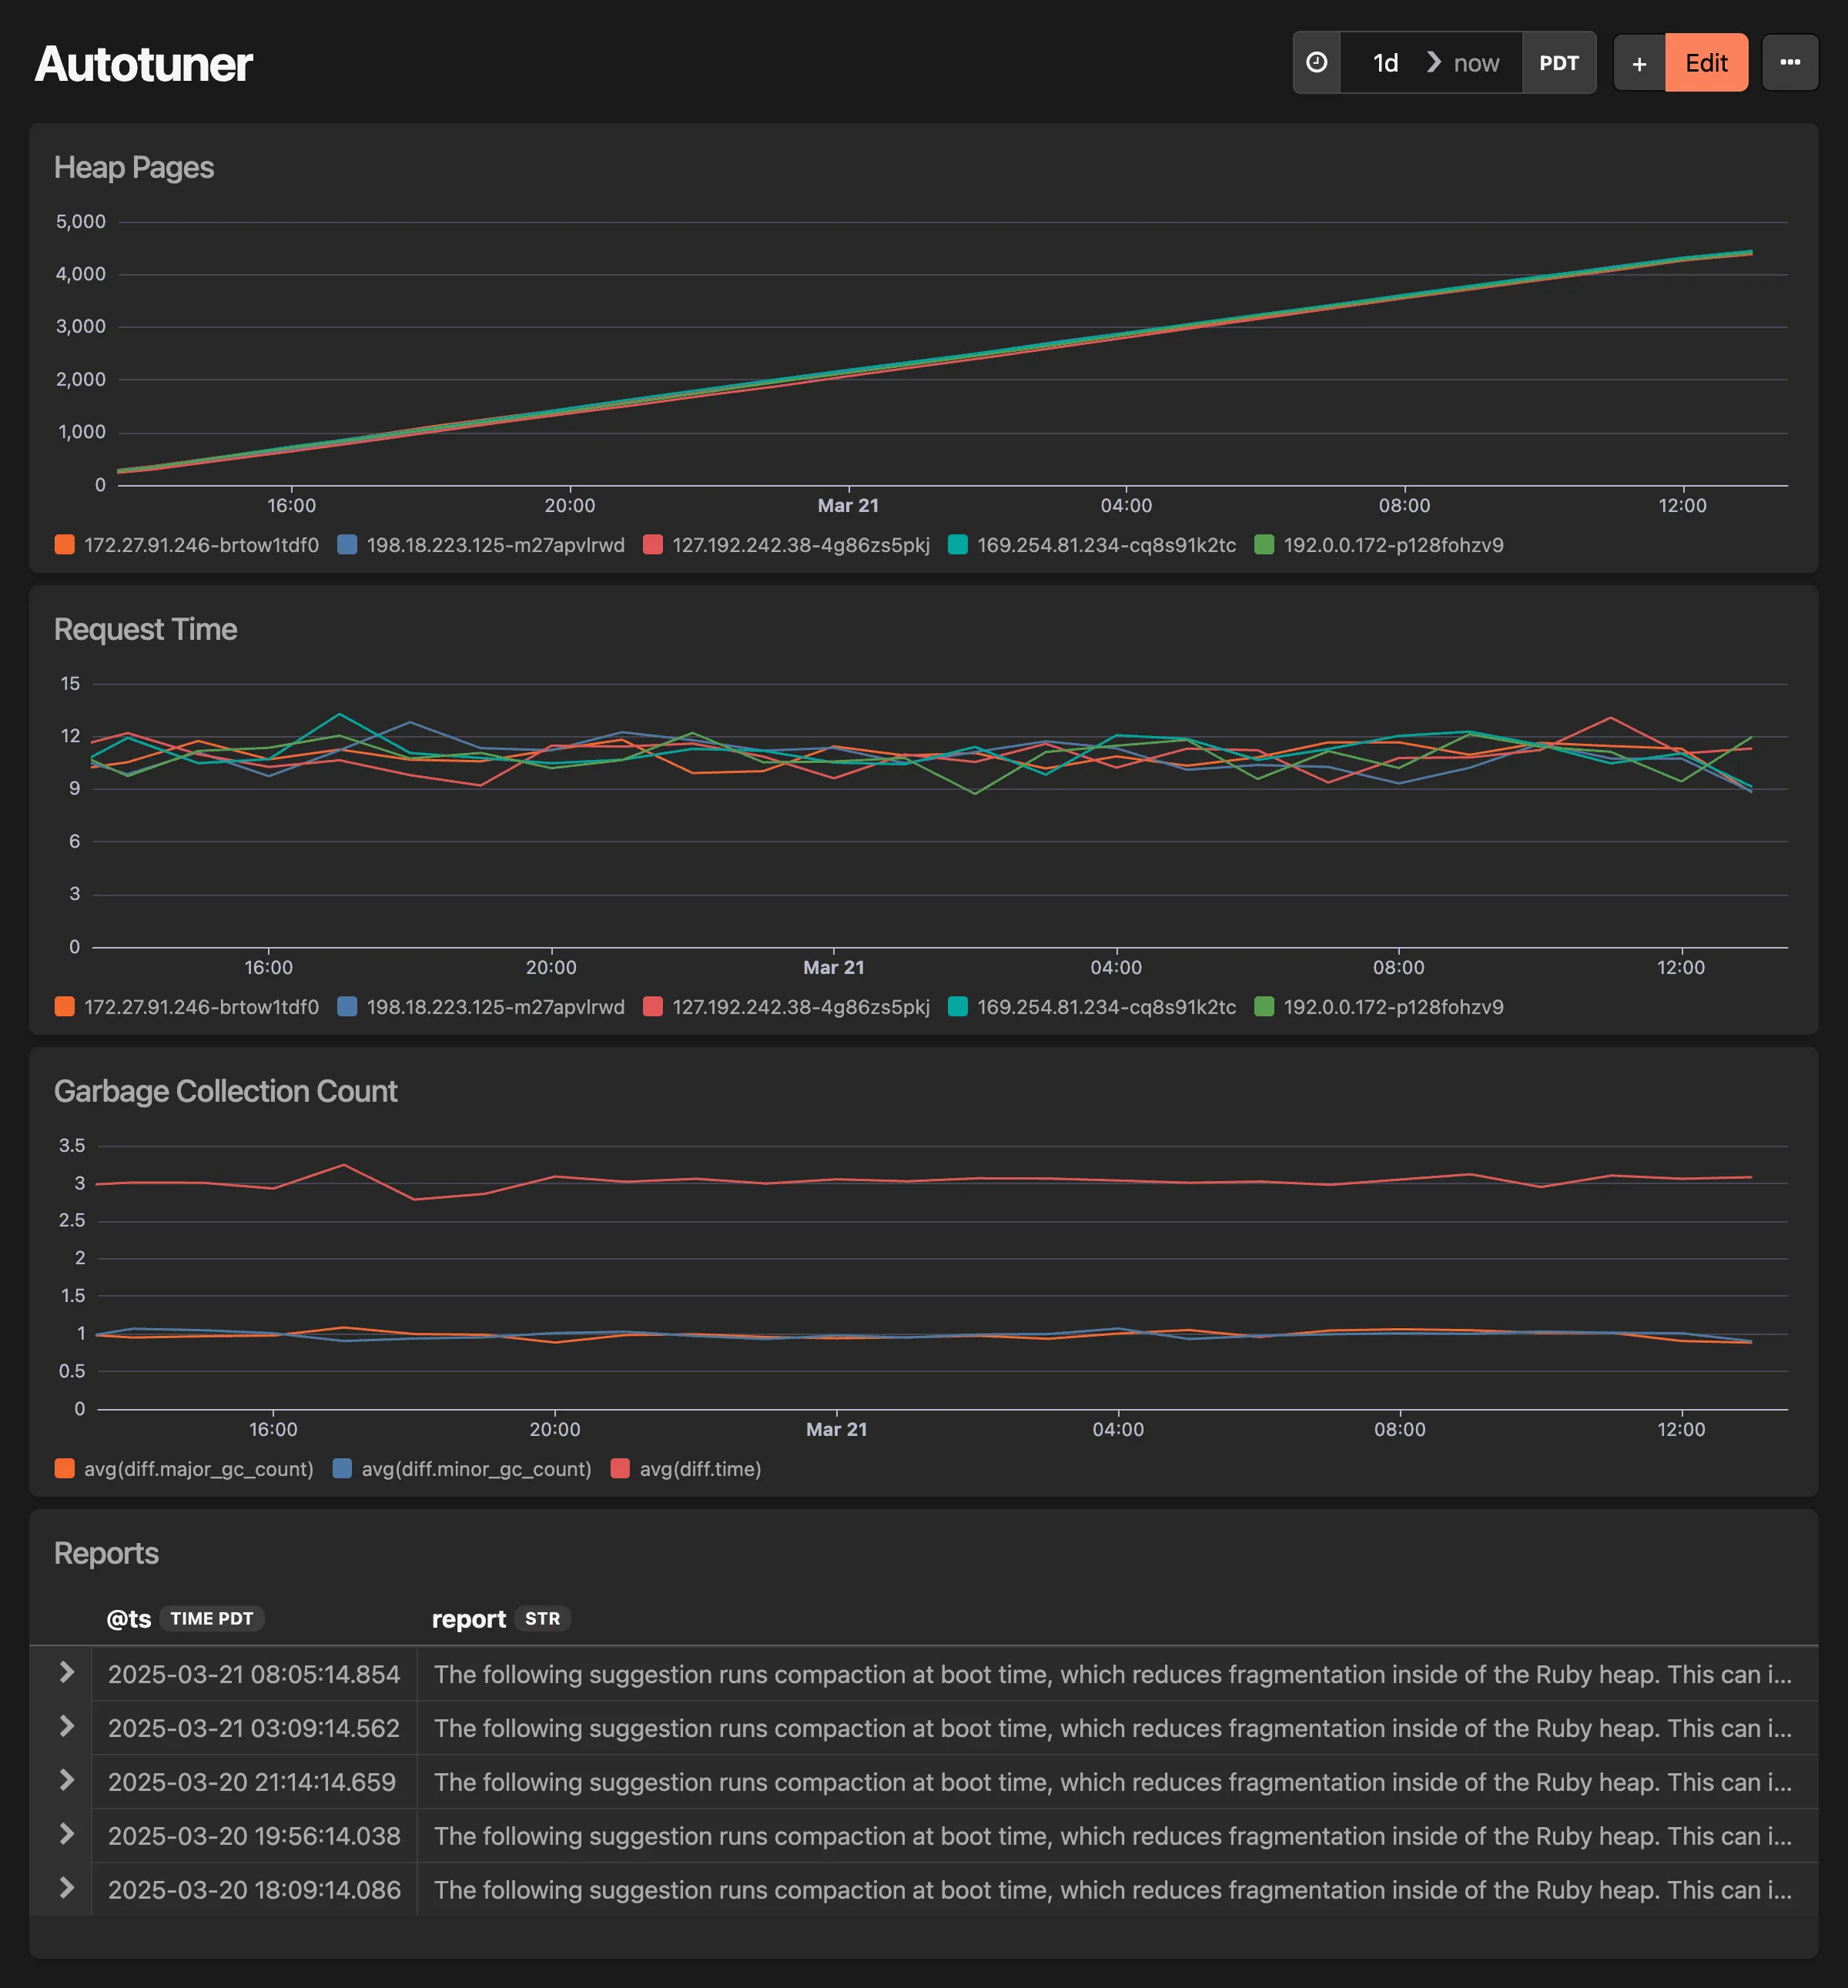
# Celery dashboard
> Task counts by status, average durations, failures and retries
Drop in Dashboard for your Celery instrumentation data **This dashboard includes:** * Task counts over time by status (SUCCESS, FAILURE, etc.) * Average task durations across all tasks * Overall task counts & average durations per task * Top 10 slowest task runs * Breakdown of failures, retries & other statuses * Total successful job count To get started, make sure you have updated Honeybadger to version 1.1.0 or later.
```yaml
pip install --upgrade honeybadger
```
And enable Insights instrumentation by including this in your config:
```py
celery.conf.update(
HONEYBADGER_INSIGHTS_ENABLED = True,
)
```
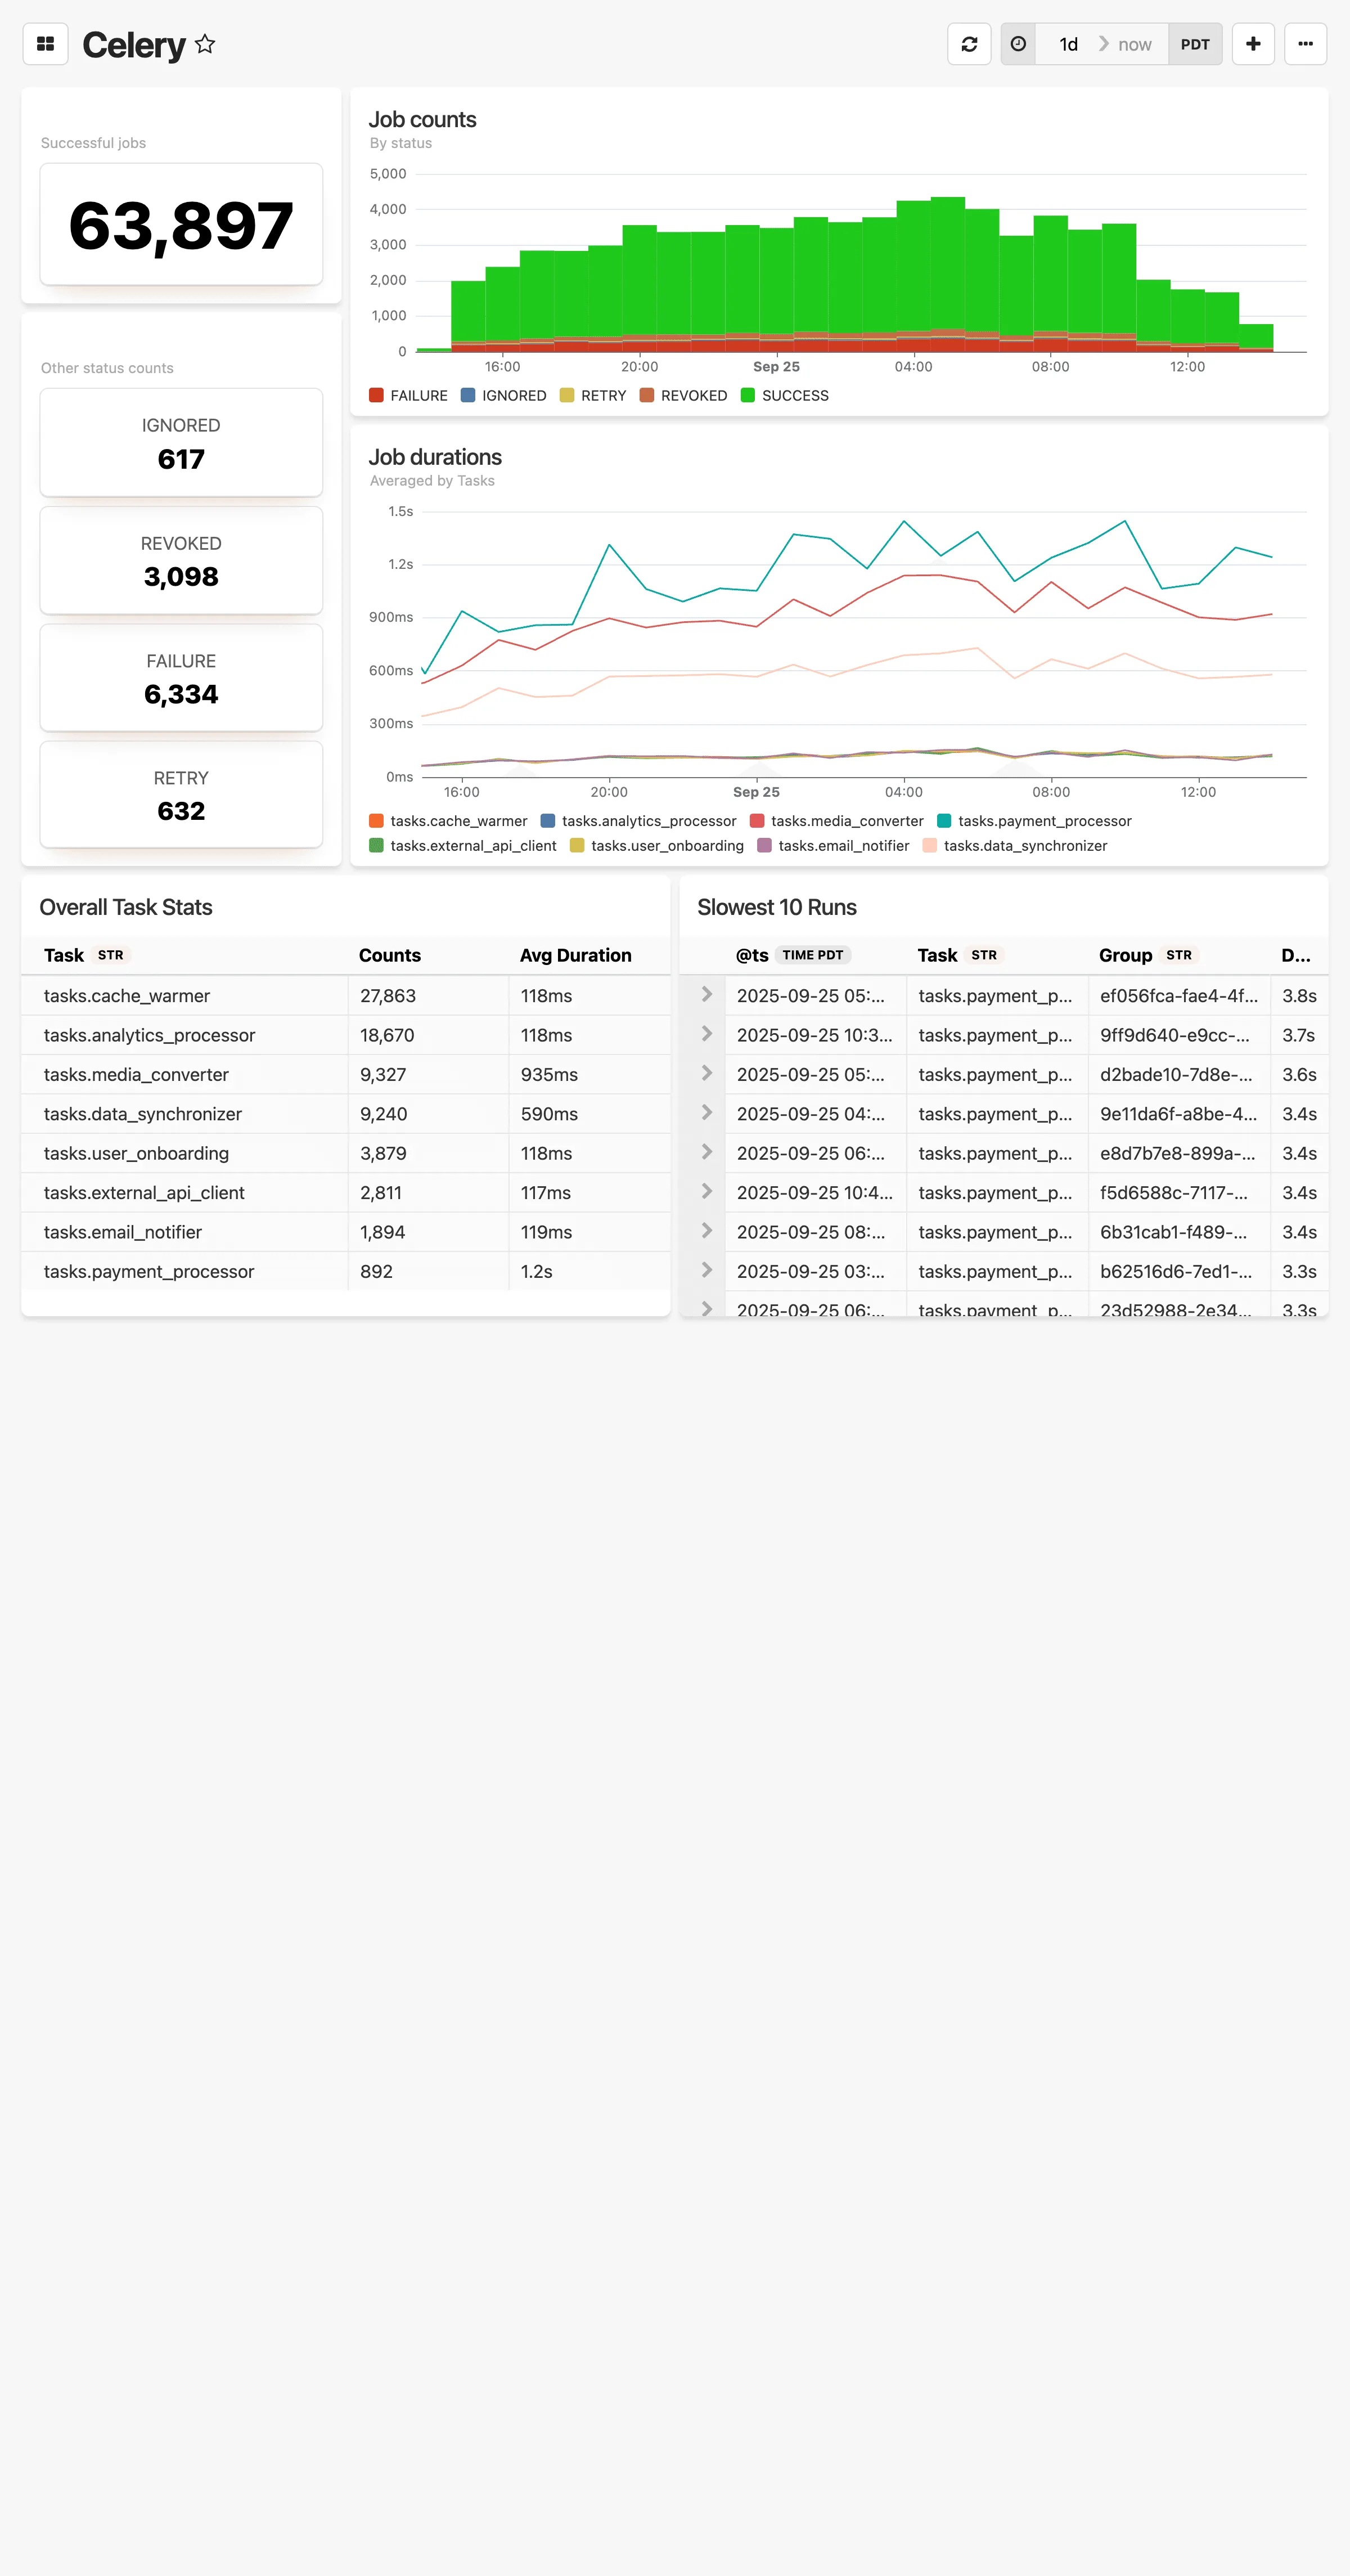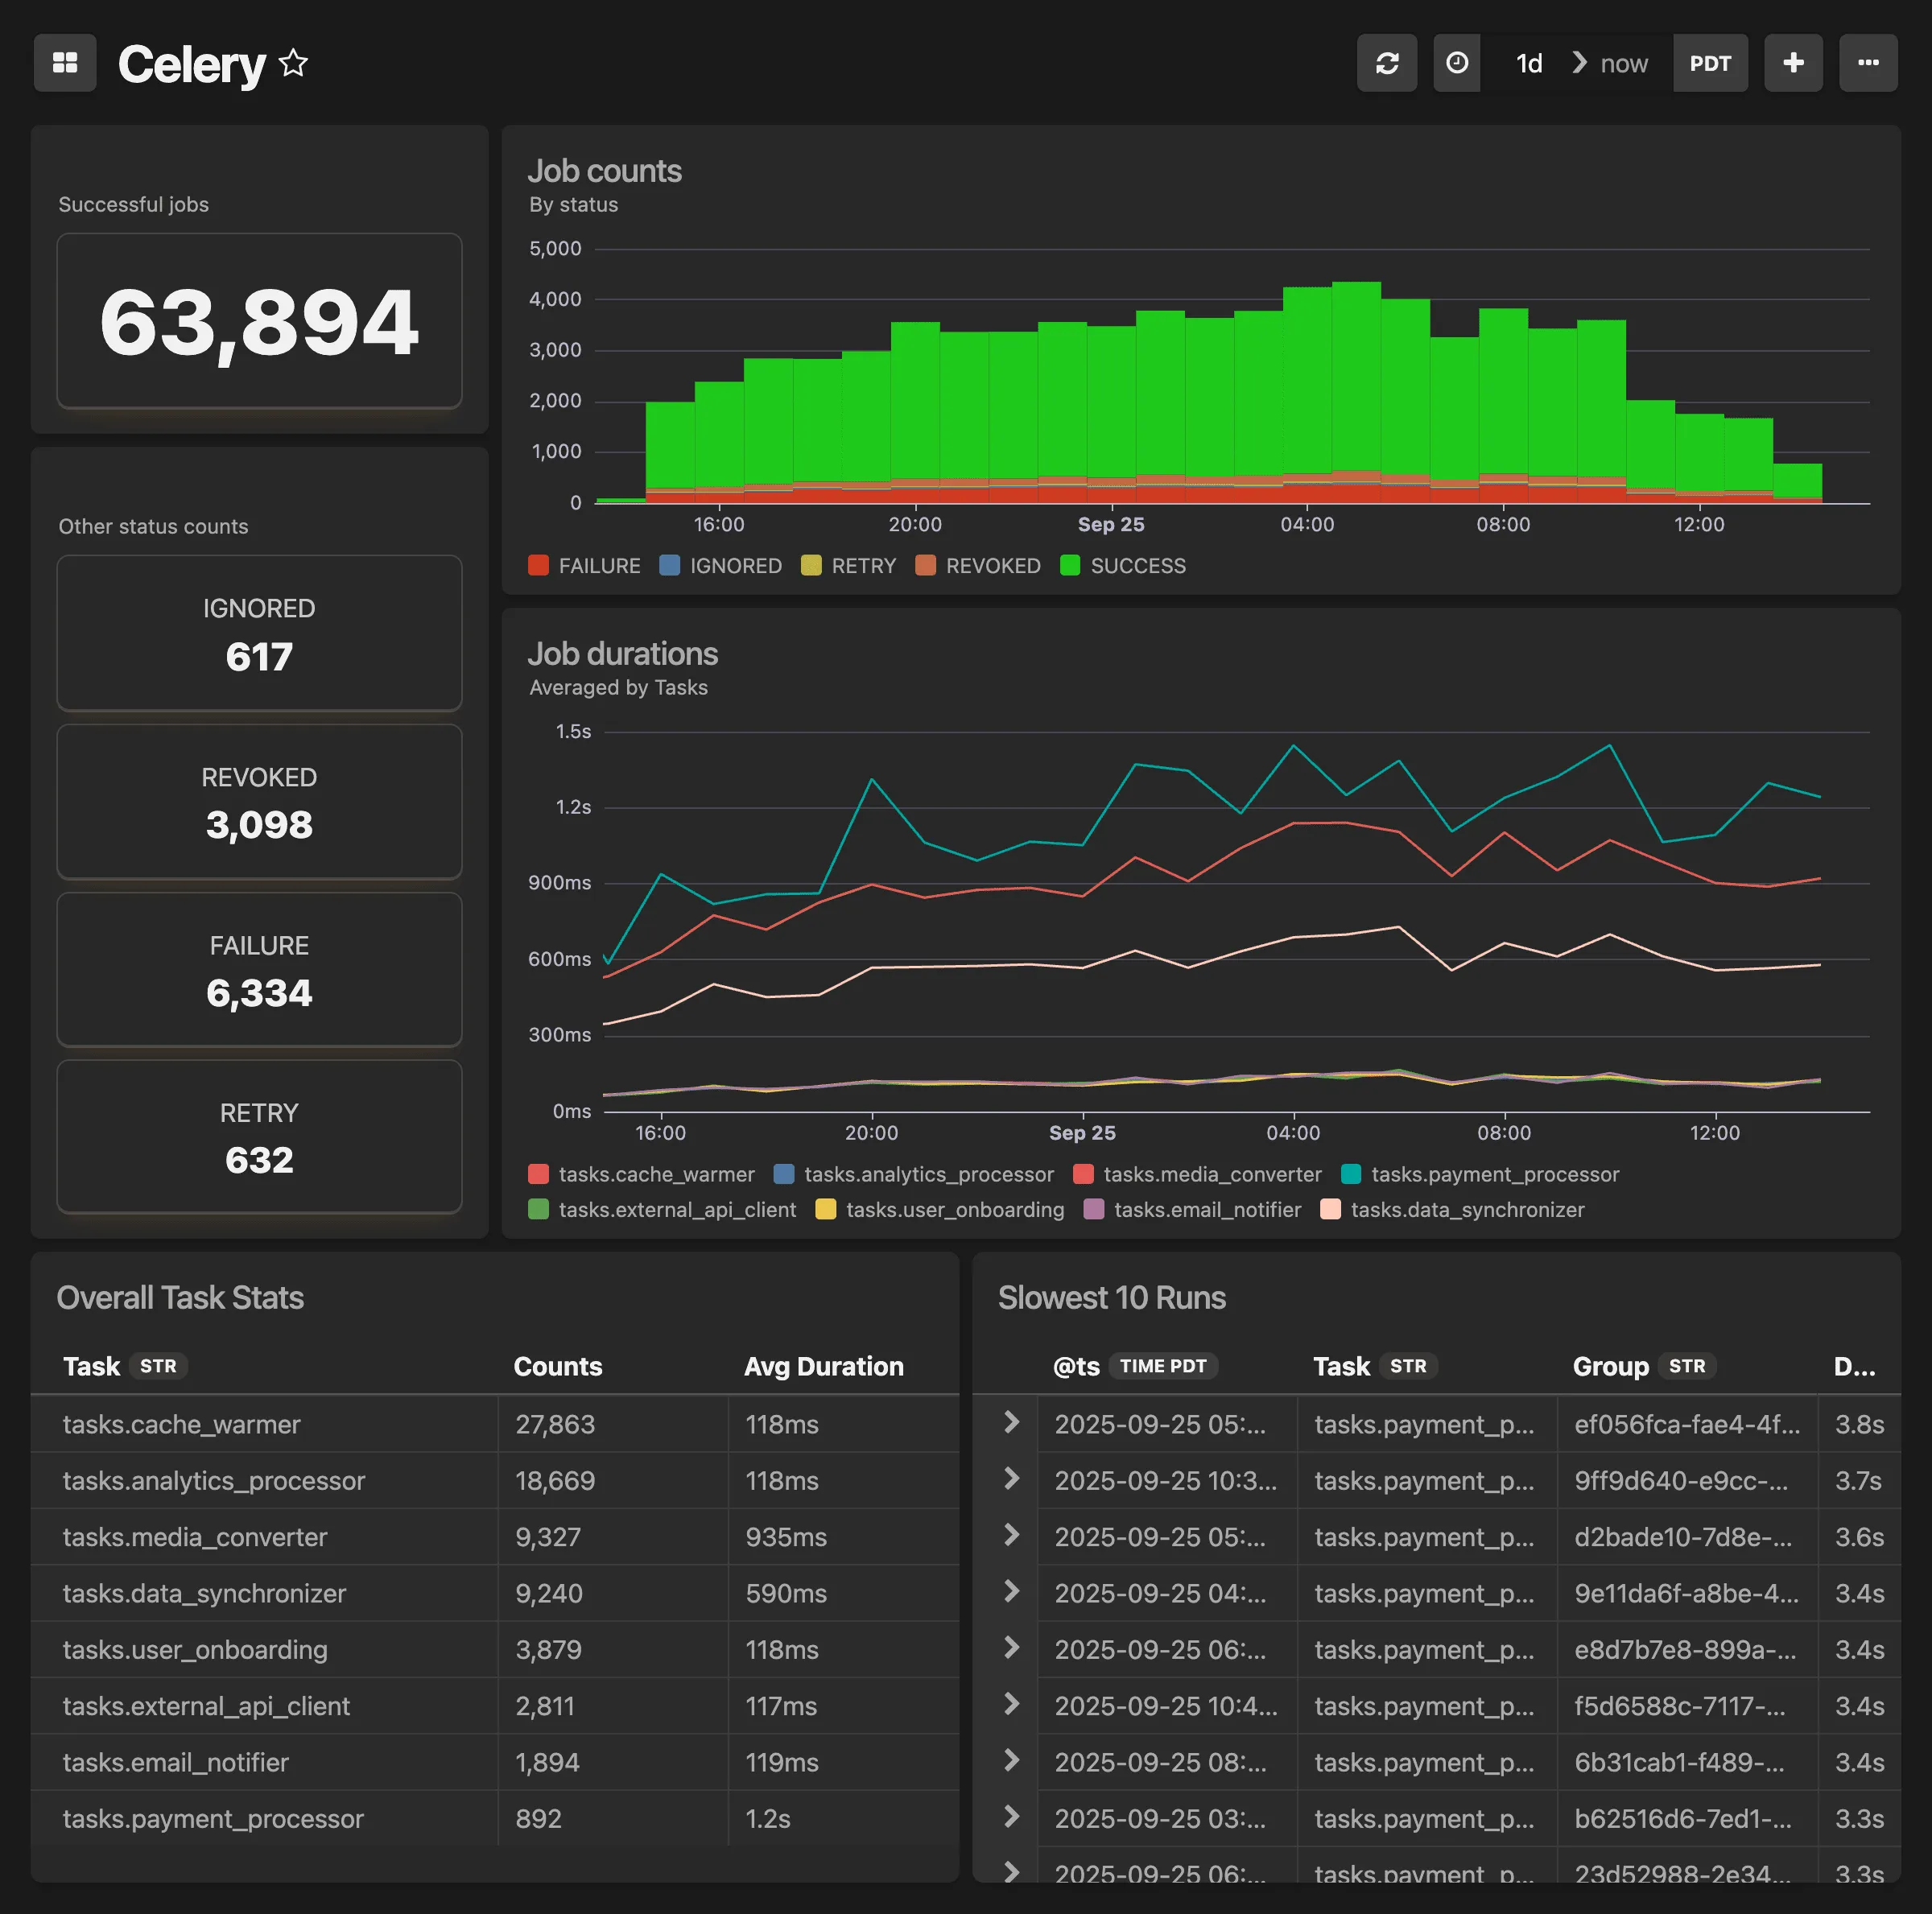
# Django dashboard
> Request durations, response status counts, slowest views and queries
Drop in Dashboard for your Django instrumentation data **This dashboard includes:** * Request duration distributions (binned by 100 ms) * Response counts over time, grouped by status codes (2XX, 3XX, 4XX, 5XX) * Average response durations by view * Average response durations by app * Total request counts over time * Slowest views (avg/max durations and Apdex) * Top 10 slowest database queries To get started, make sure you have updated Honeybadger to version 1.1.0 or later.
```yaml
pip install --upgrade honeybadger
```
And enable Insights instrumentation by including this in your config:
```py
HONEYBADGER = {
'INSIGHTS_ENABLED': True,
}
```
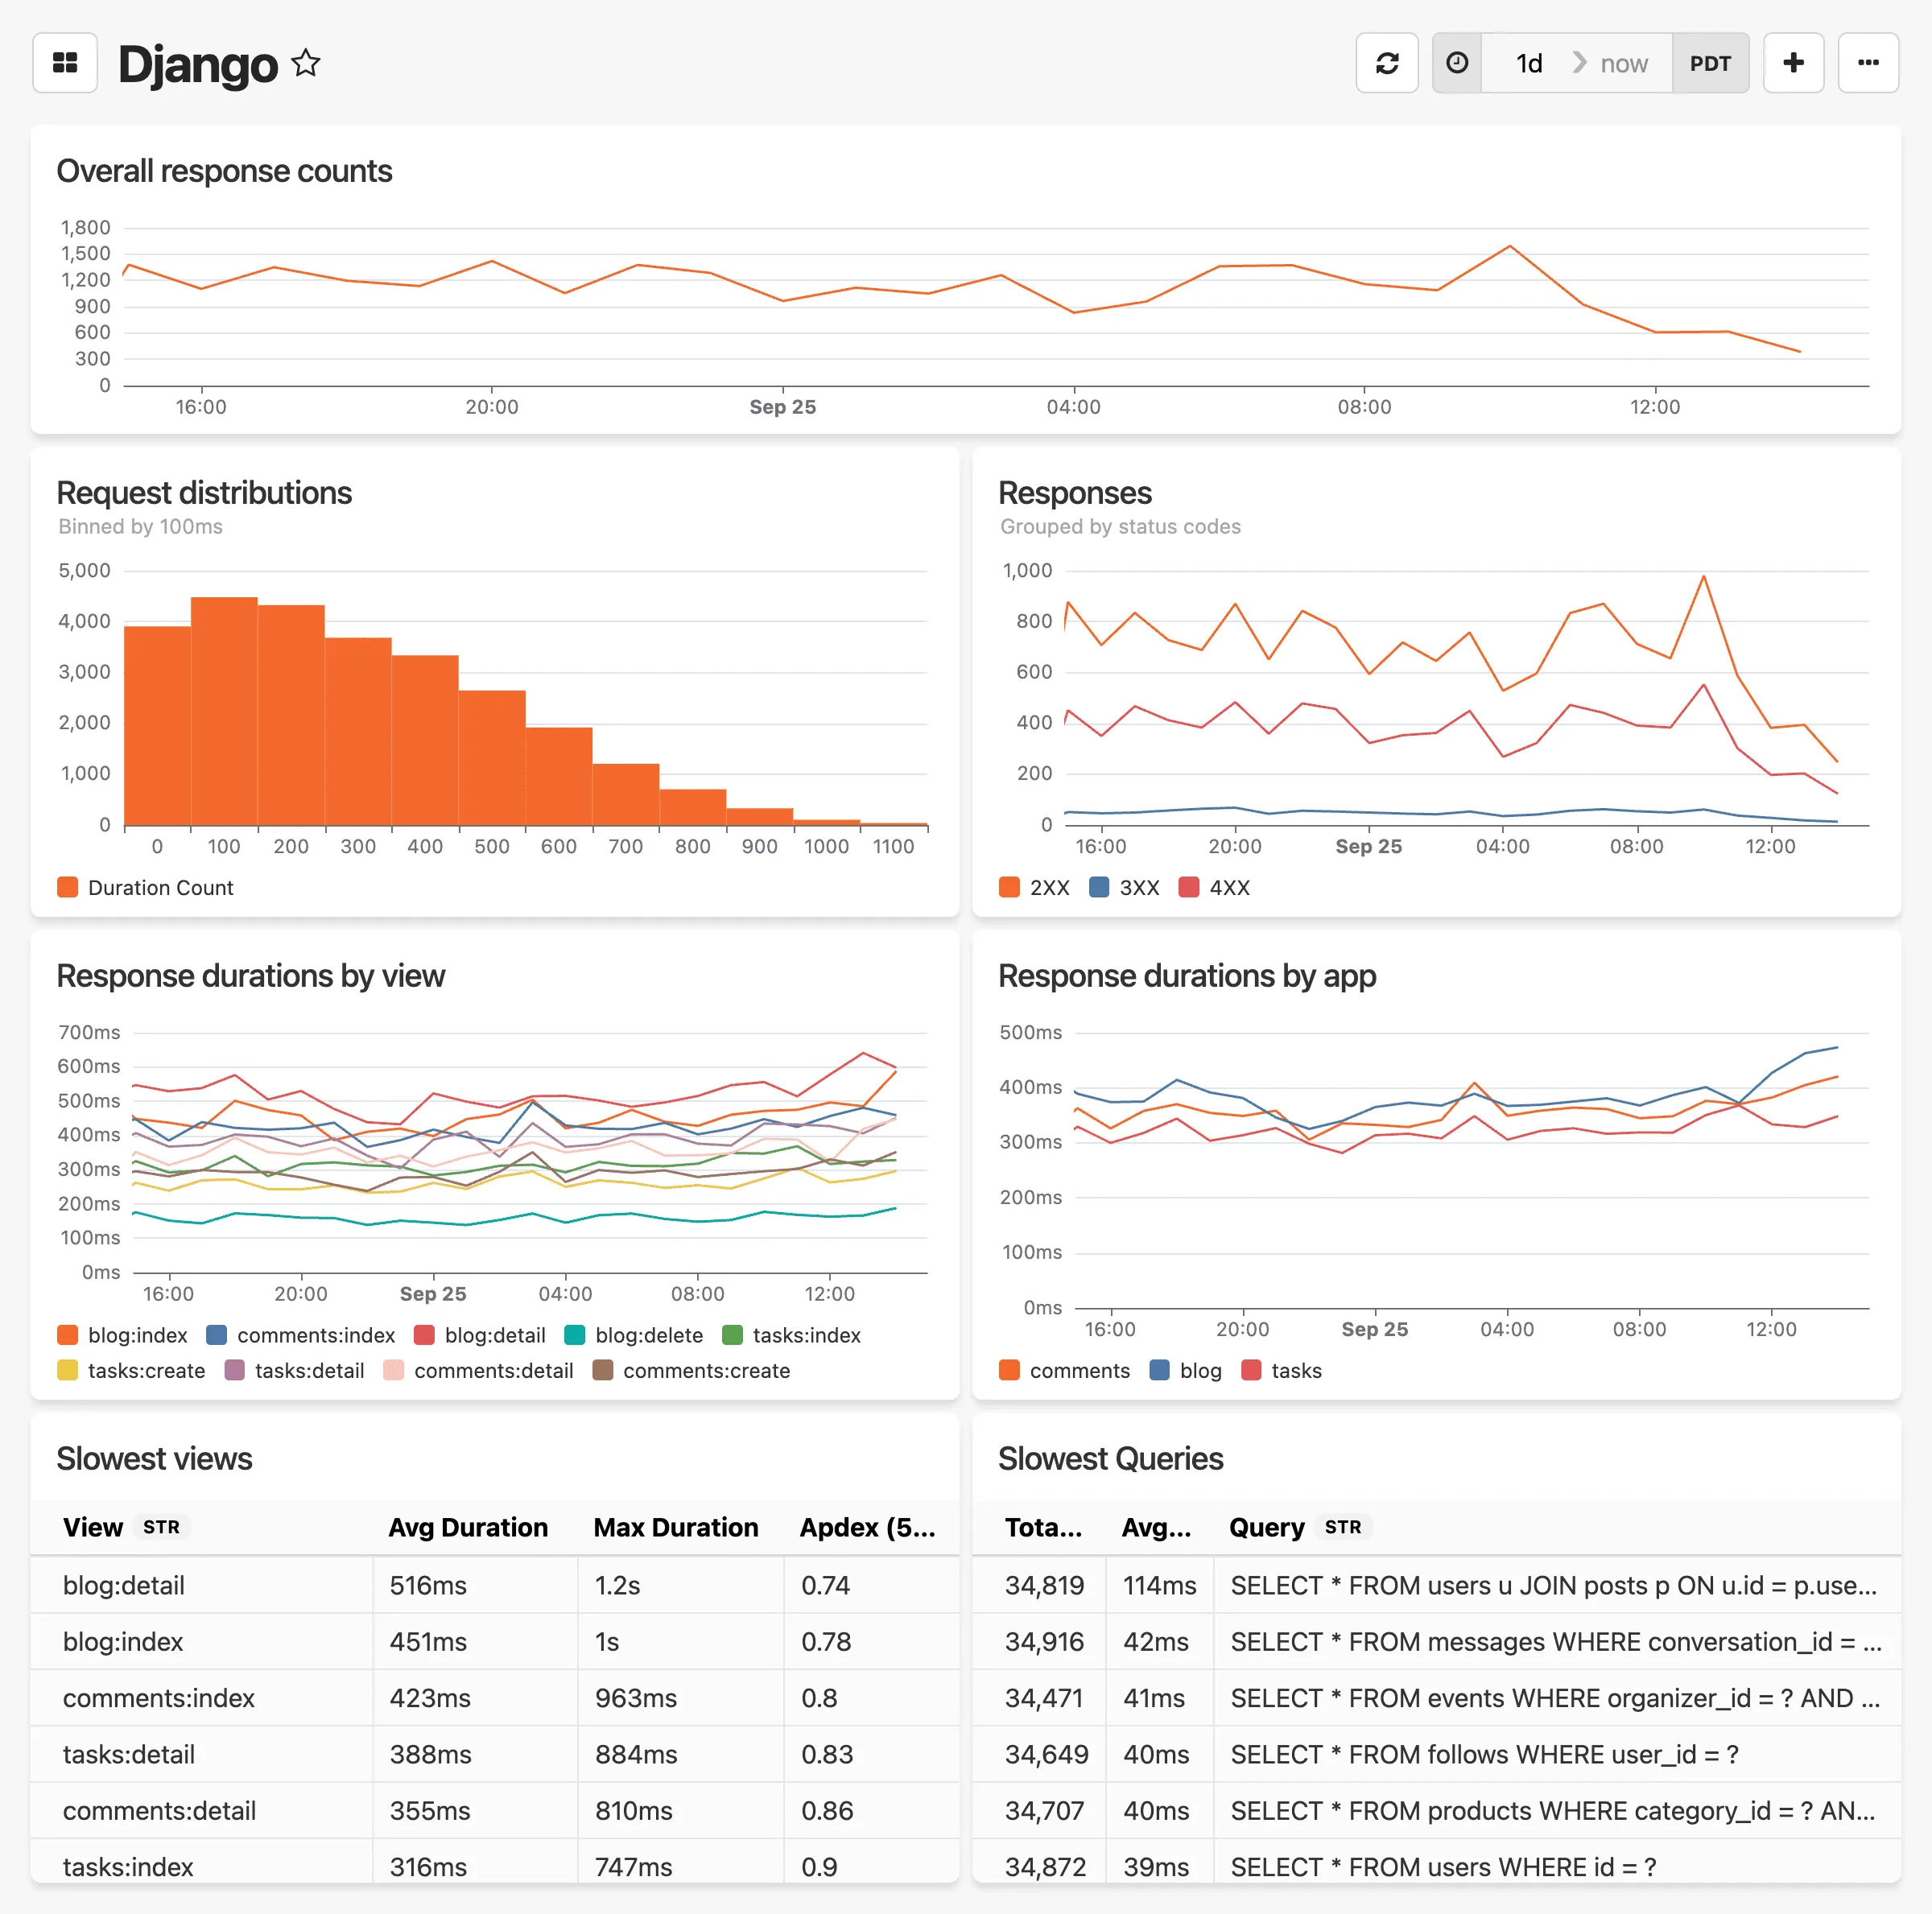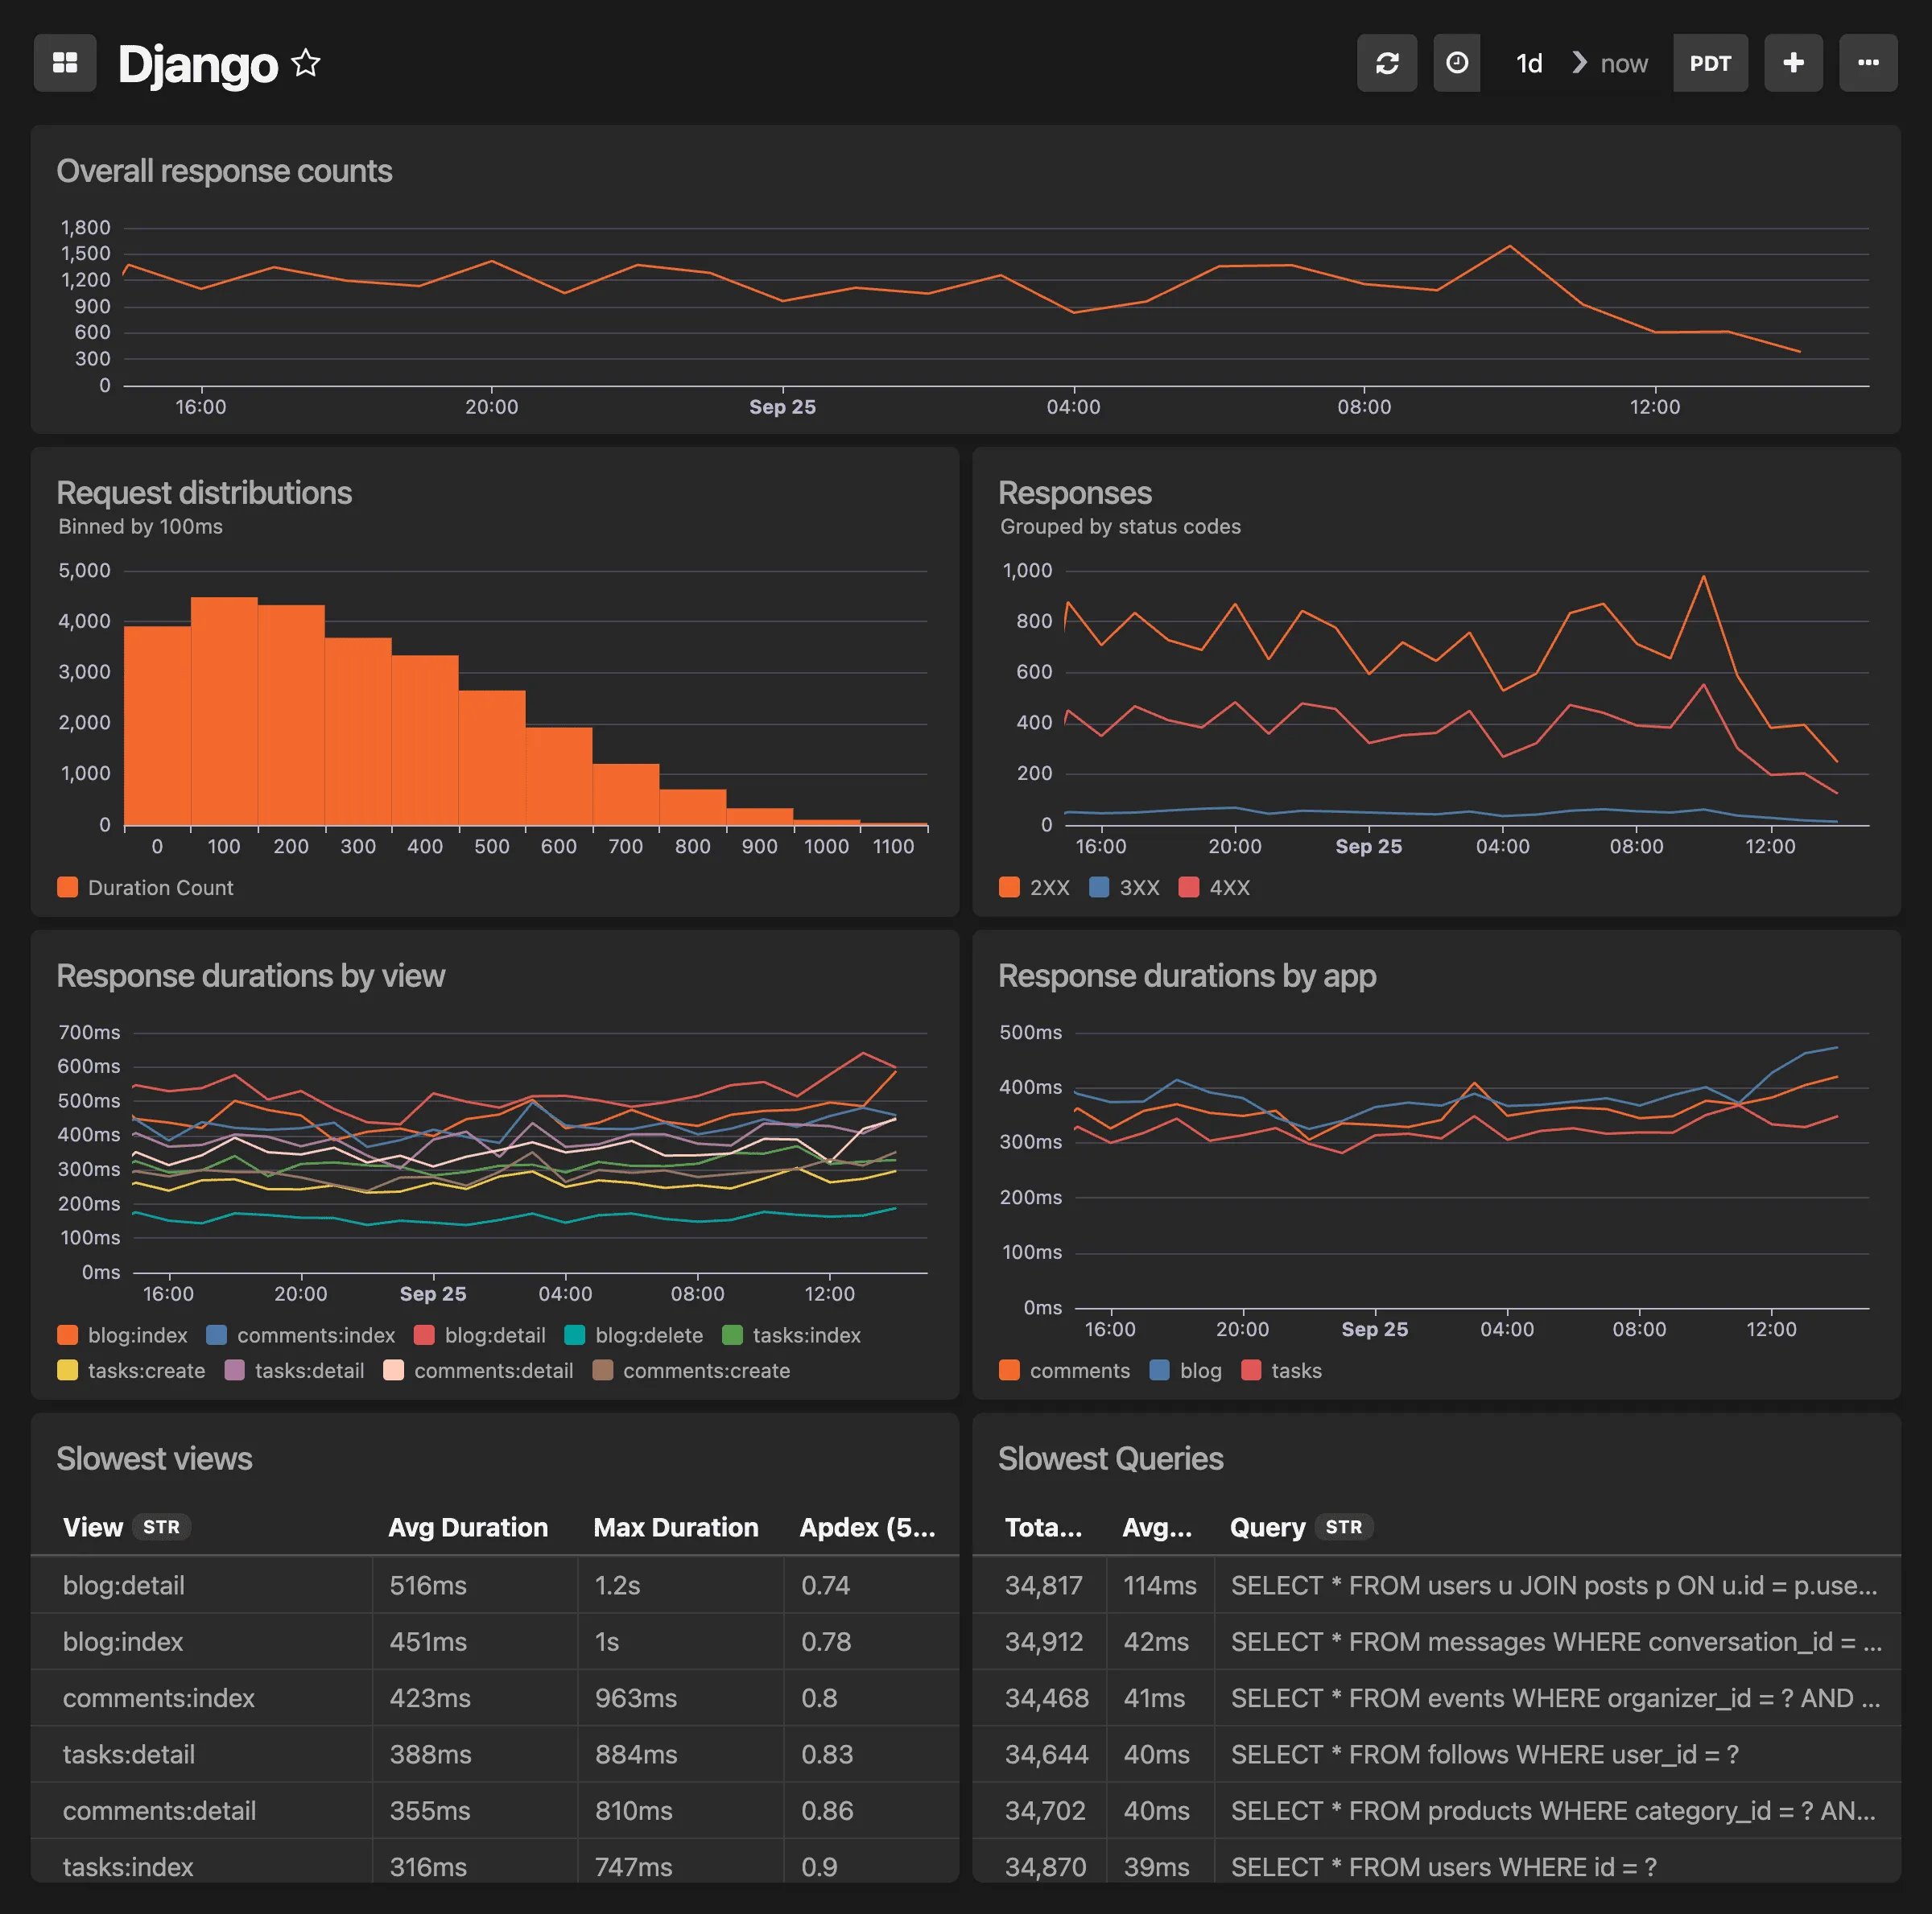
# Flask dashboard
> Request durations, response codes, and slowest views and queries by blueprint
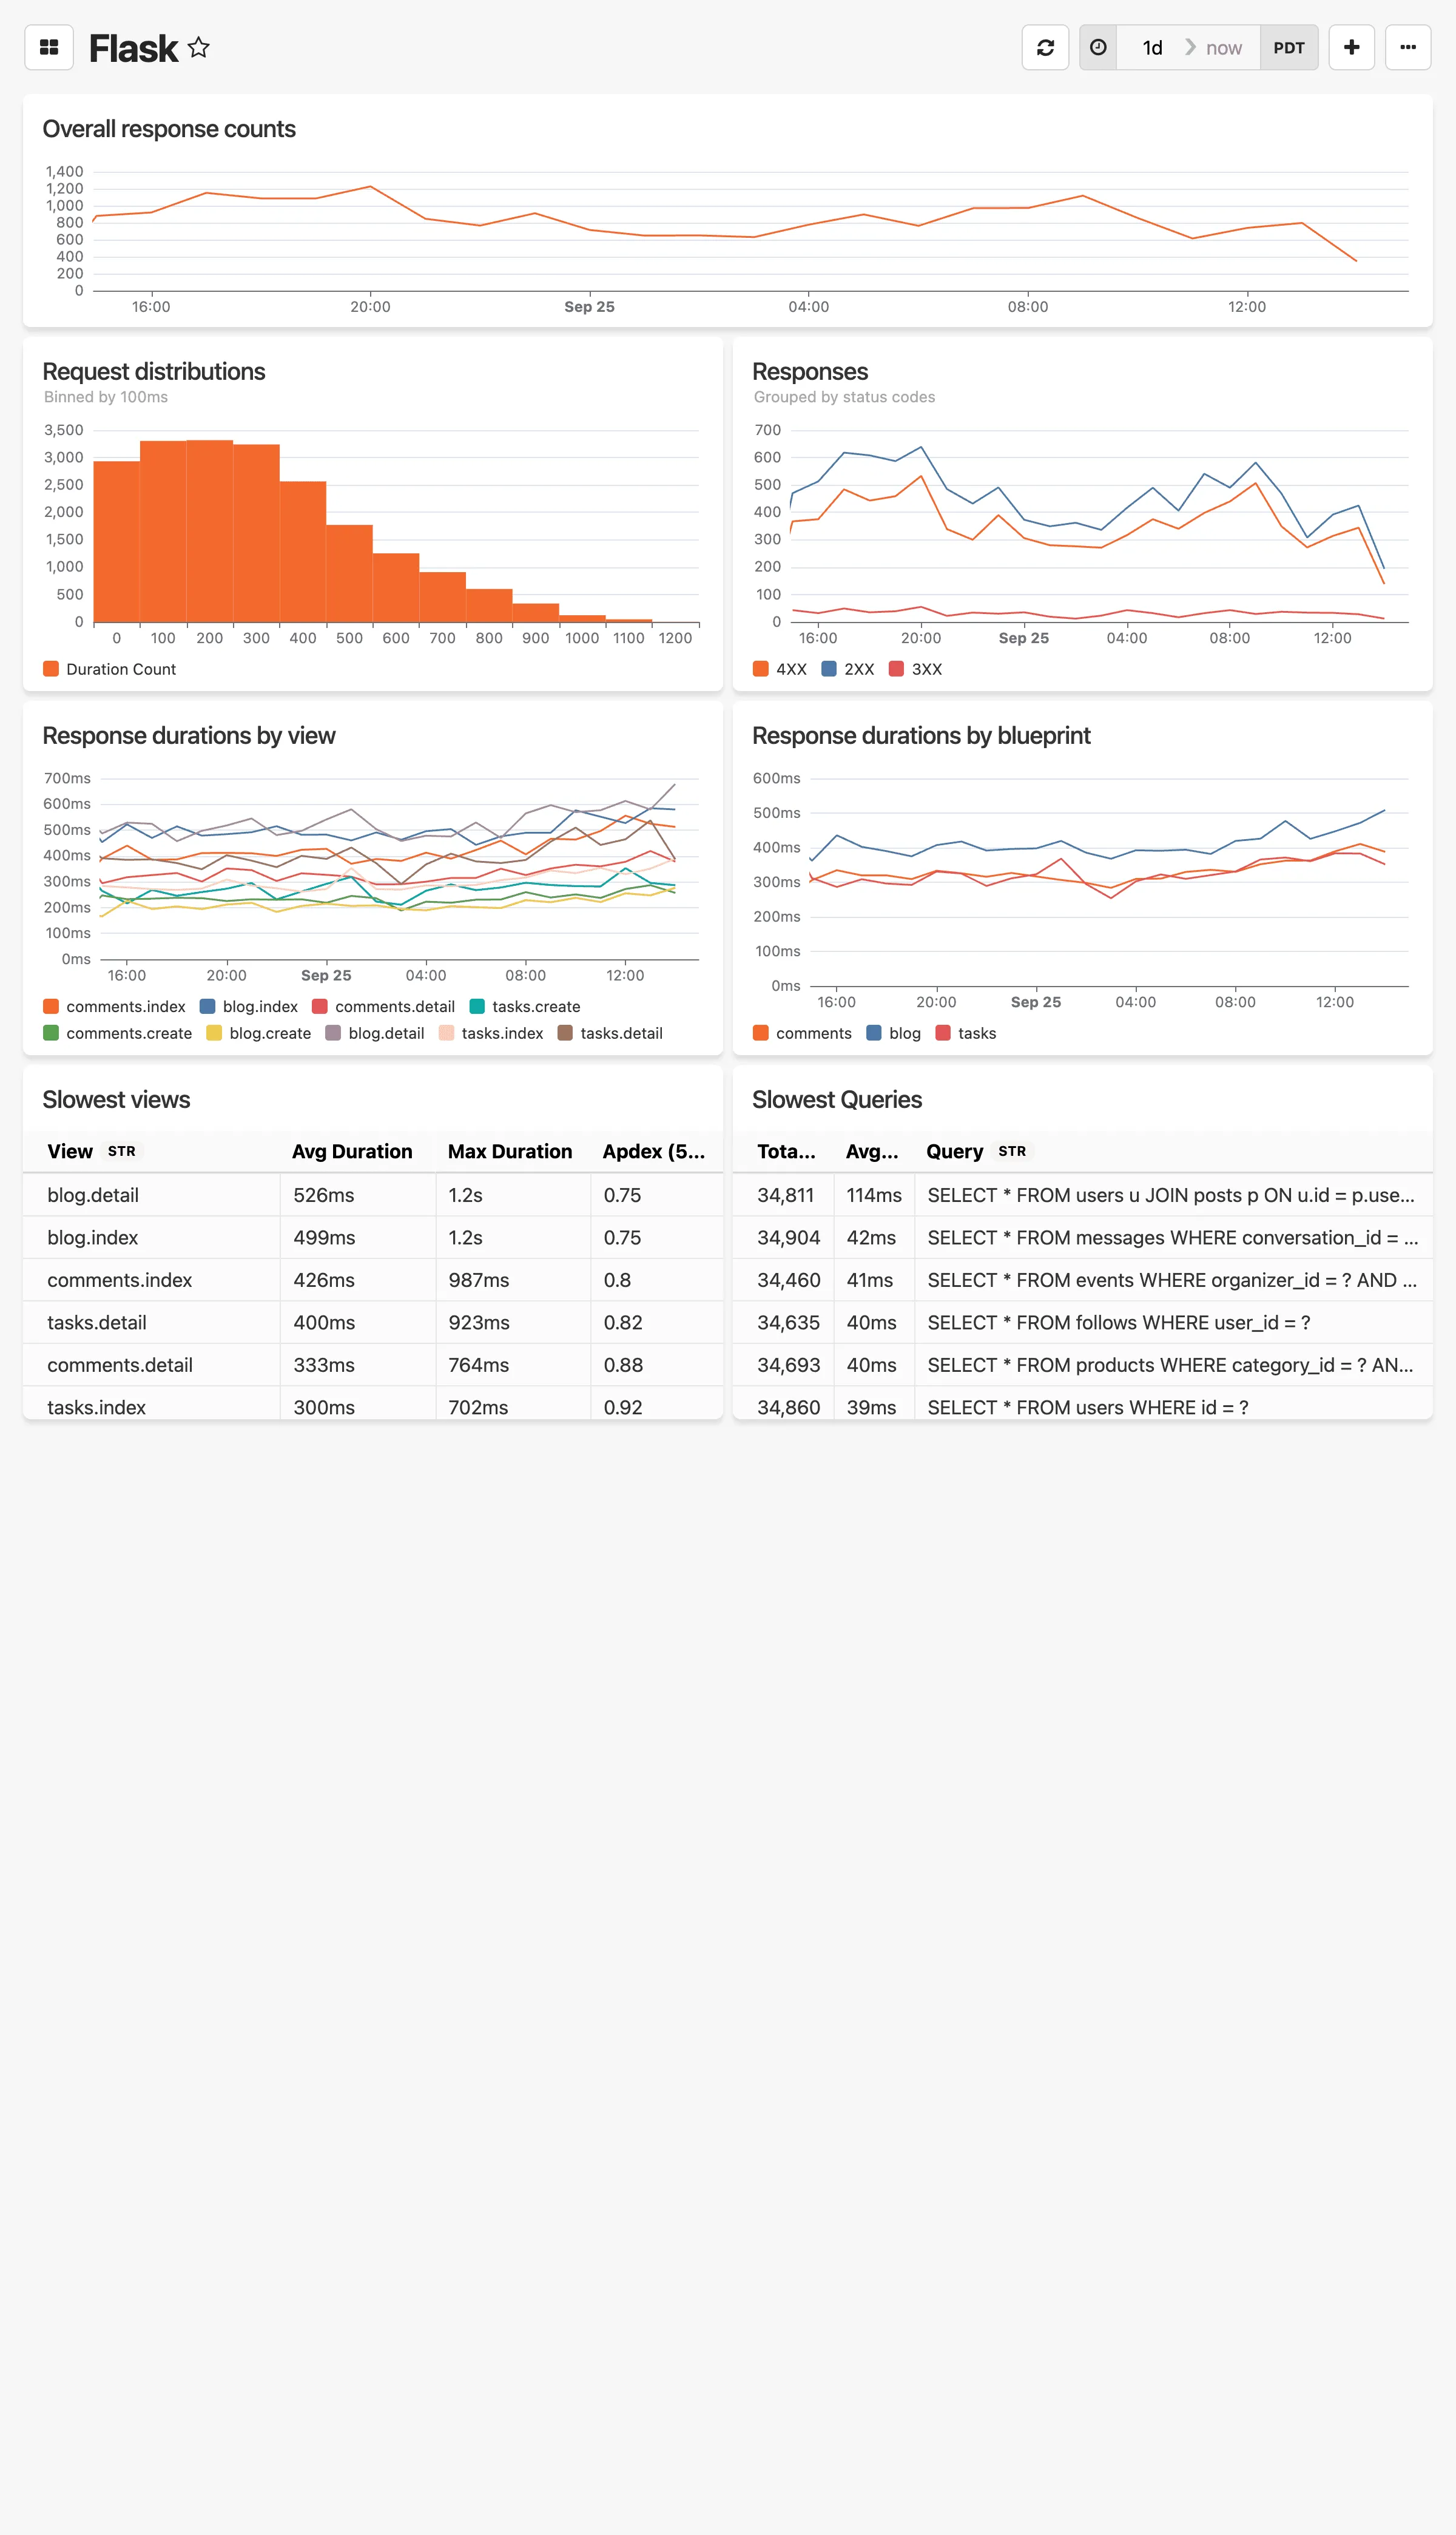
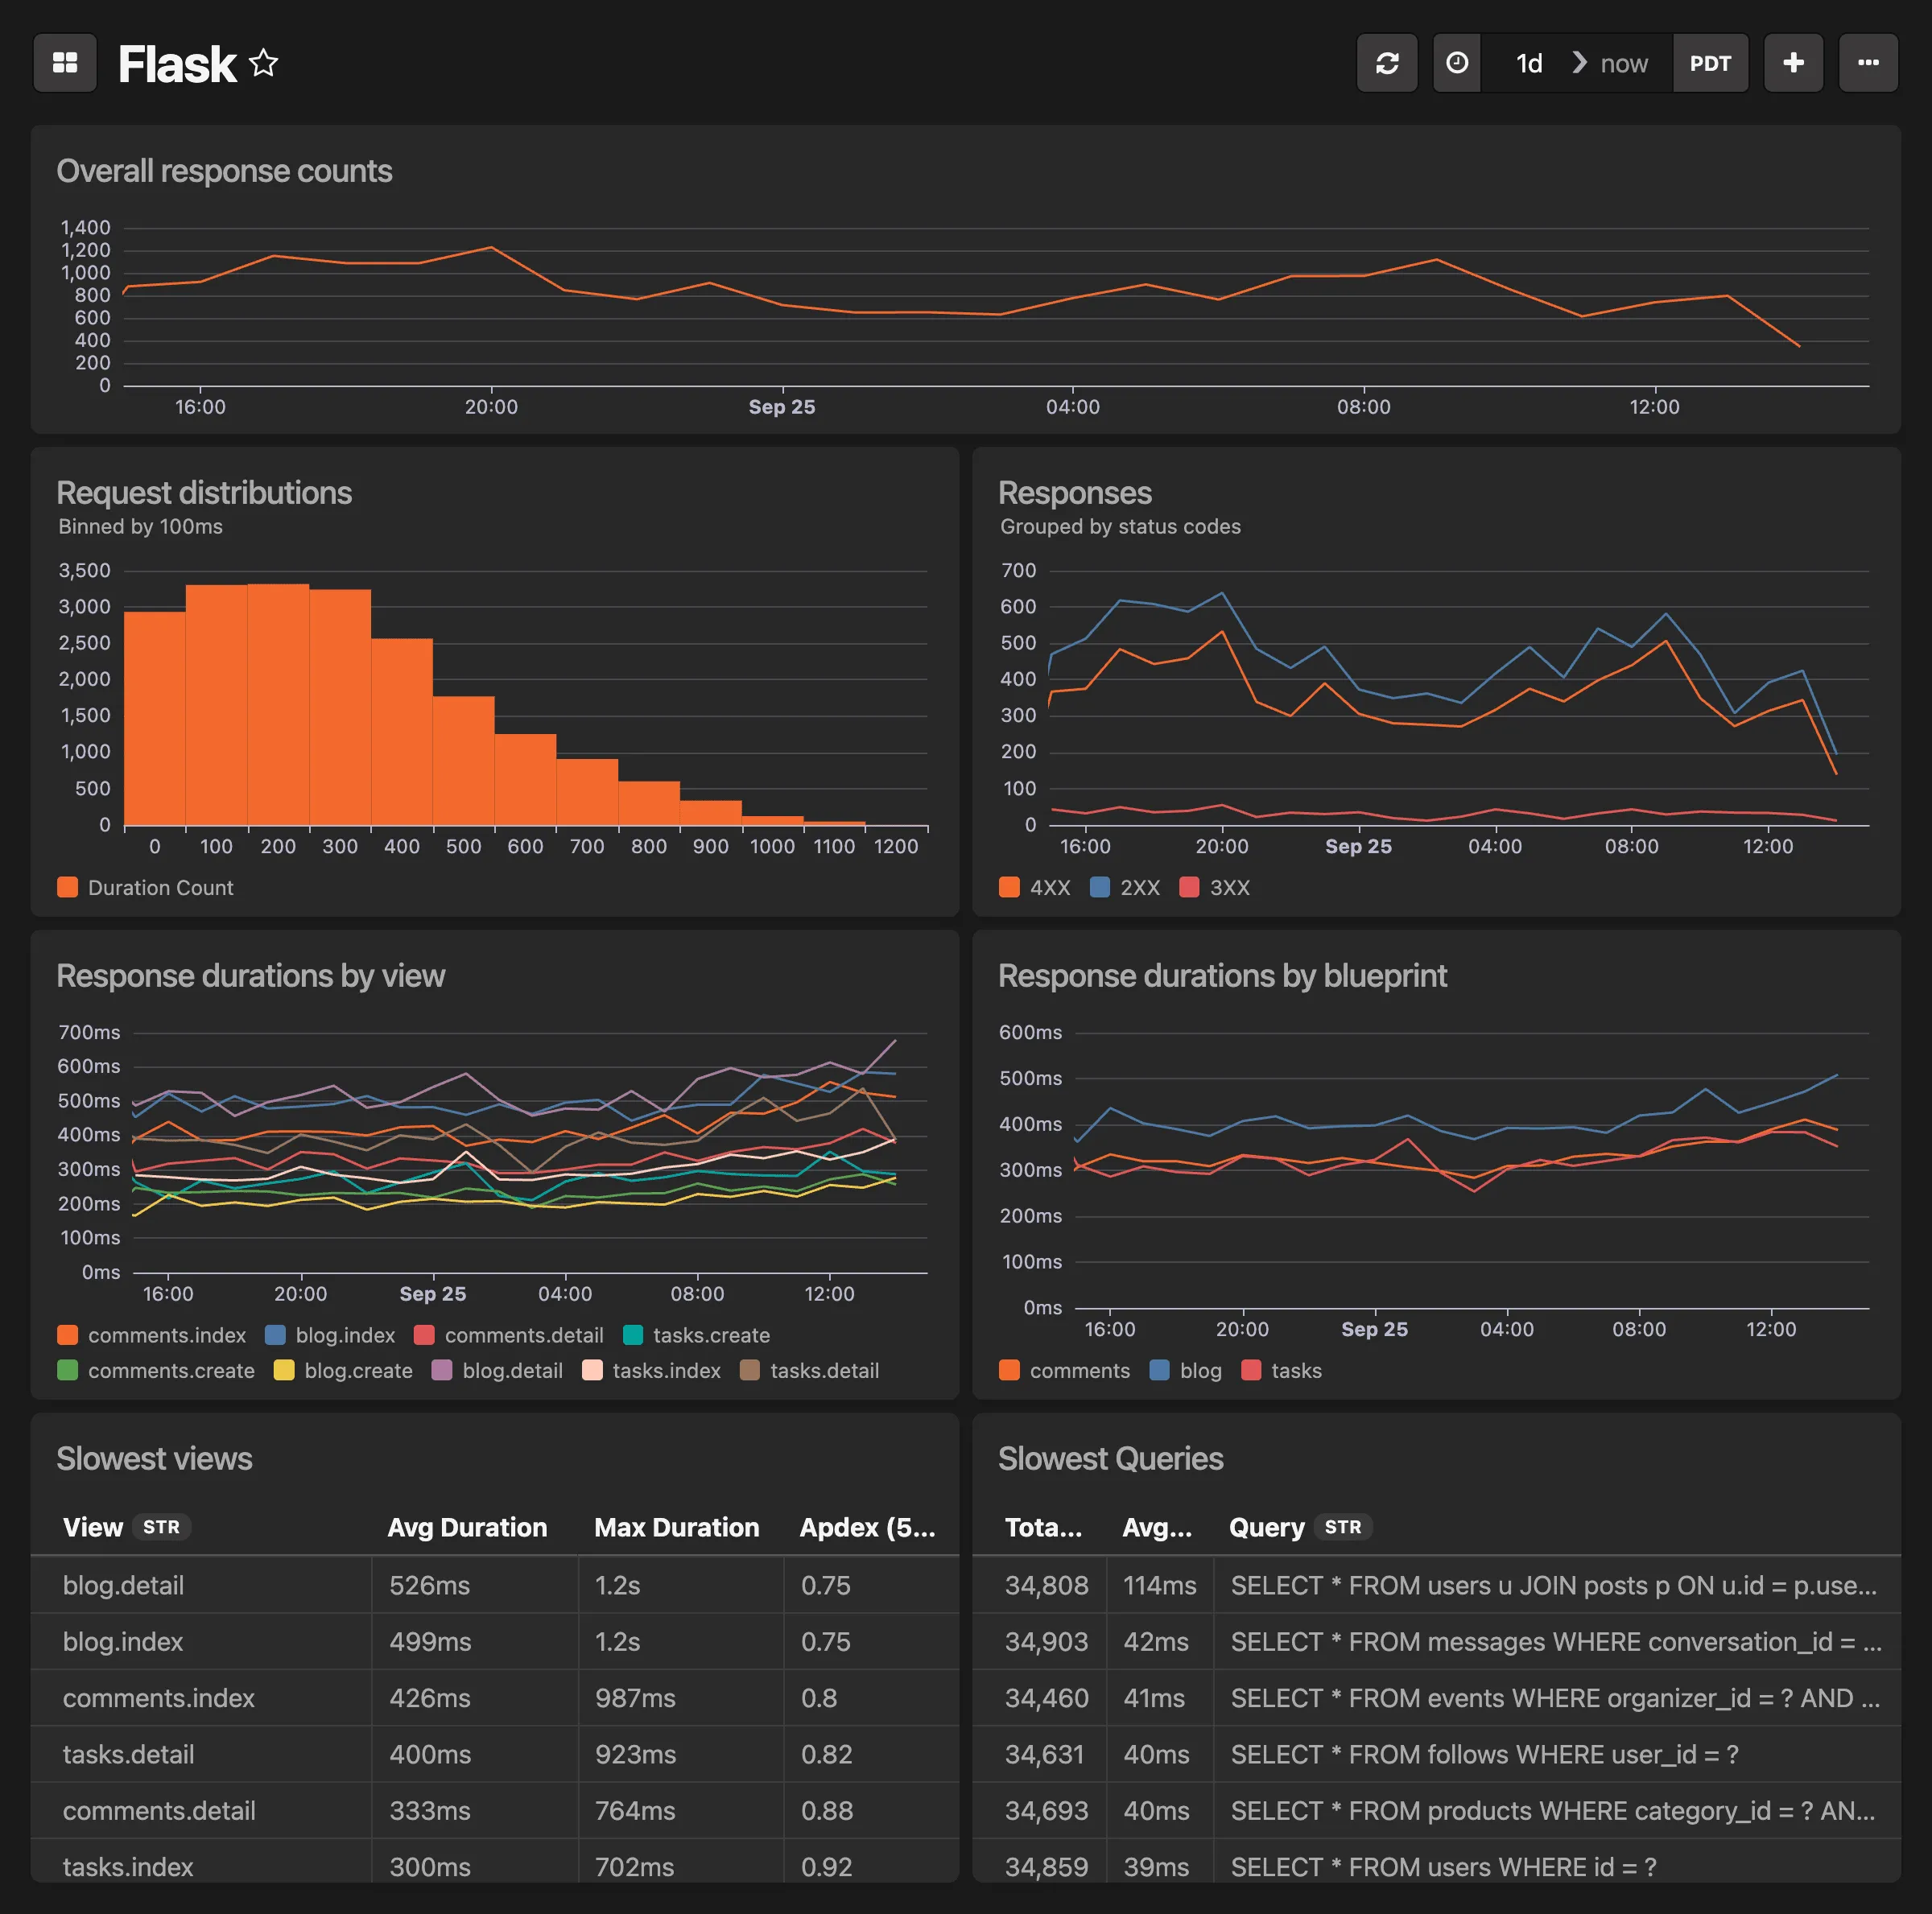
Ready-made dashboard for monitoring Flask applications **This dashboard includes:** * Average response durations by view * Average response durations by blueprint * Response counts over time, grouped by status codes (2XX, 3XX, 4XX, 5XX) * Total request count over time * Top 10 slowest views (avg/max durations and Apdex) * Request duration distribution histogram (binned by 100 ms) * Top 10 slowest database queries To get started, make sure you have updated Honeybadger to version 1.1.0 or later.
```yaml
pip install --upgrade honeybadger
```
And enable Insights instrumentation by including this in your config:
```py
class Config:
HONEYBADGER_INSIGHTS_ENABLED = True
```
# Heroku dashboard
> Router status codes, Postgres load averages, and slowest paths
Ready made dashboard for monitoring Heroku apps. All that is required is to set up your [Heroku log drain](https://docs.honeybadger.io/guides/insights/integrations/heroku/). **This dashboard includes:** * Router response status code groupings * Postgres load averages (1m, 5m, 15m interval samples) * Query response time percentiles (50, 90, 99 percentiles) * Top 10 avg slowest response times by path 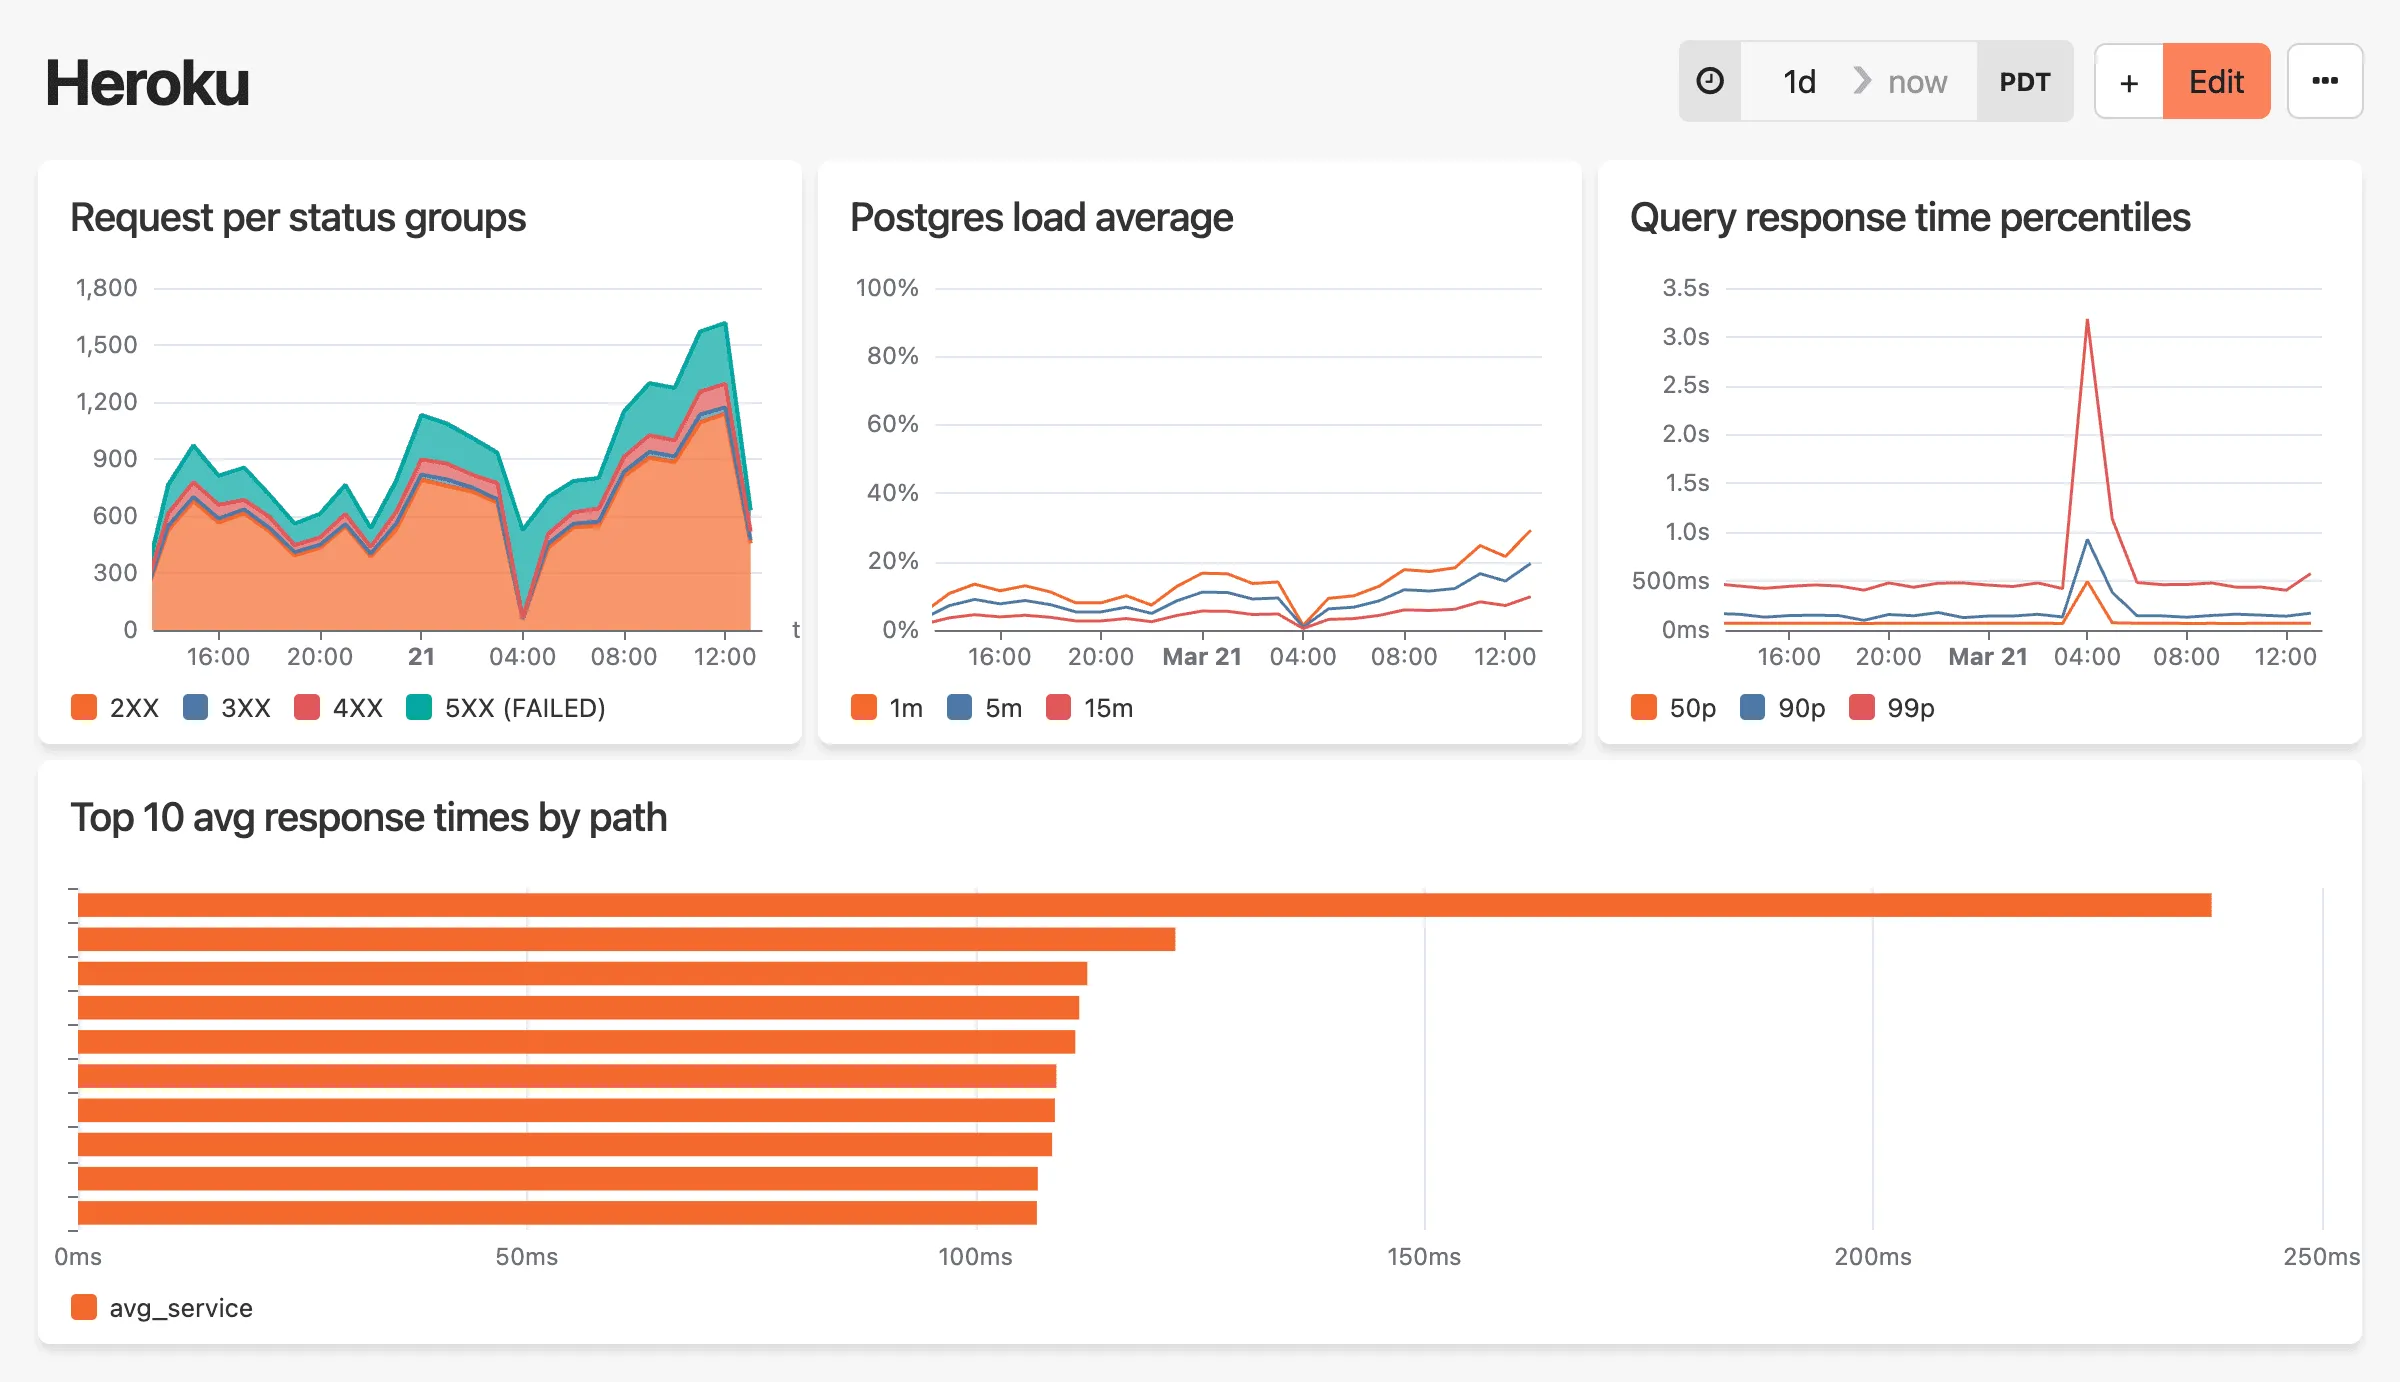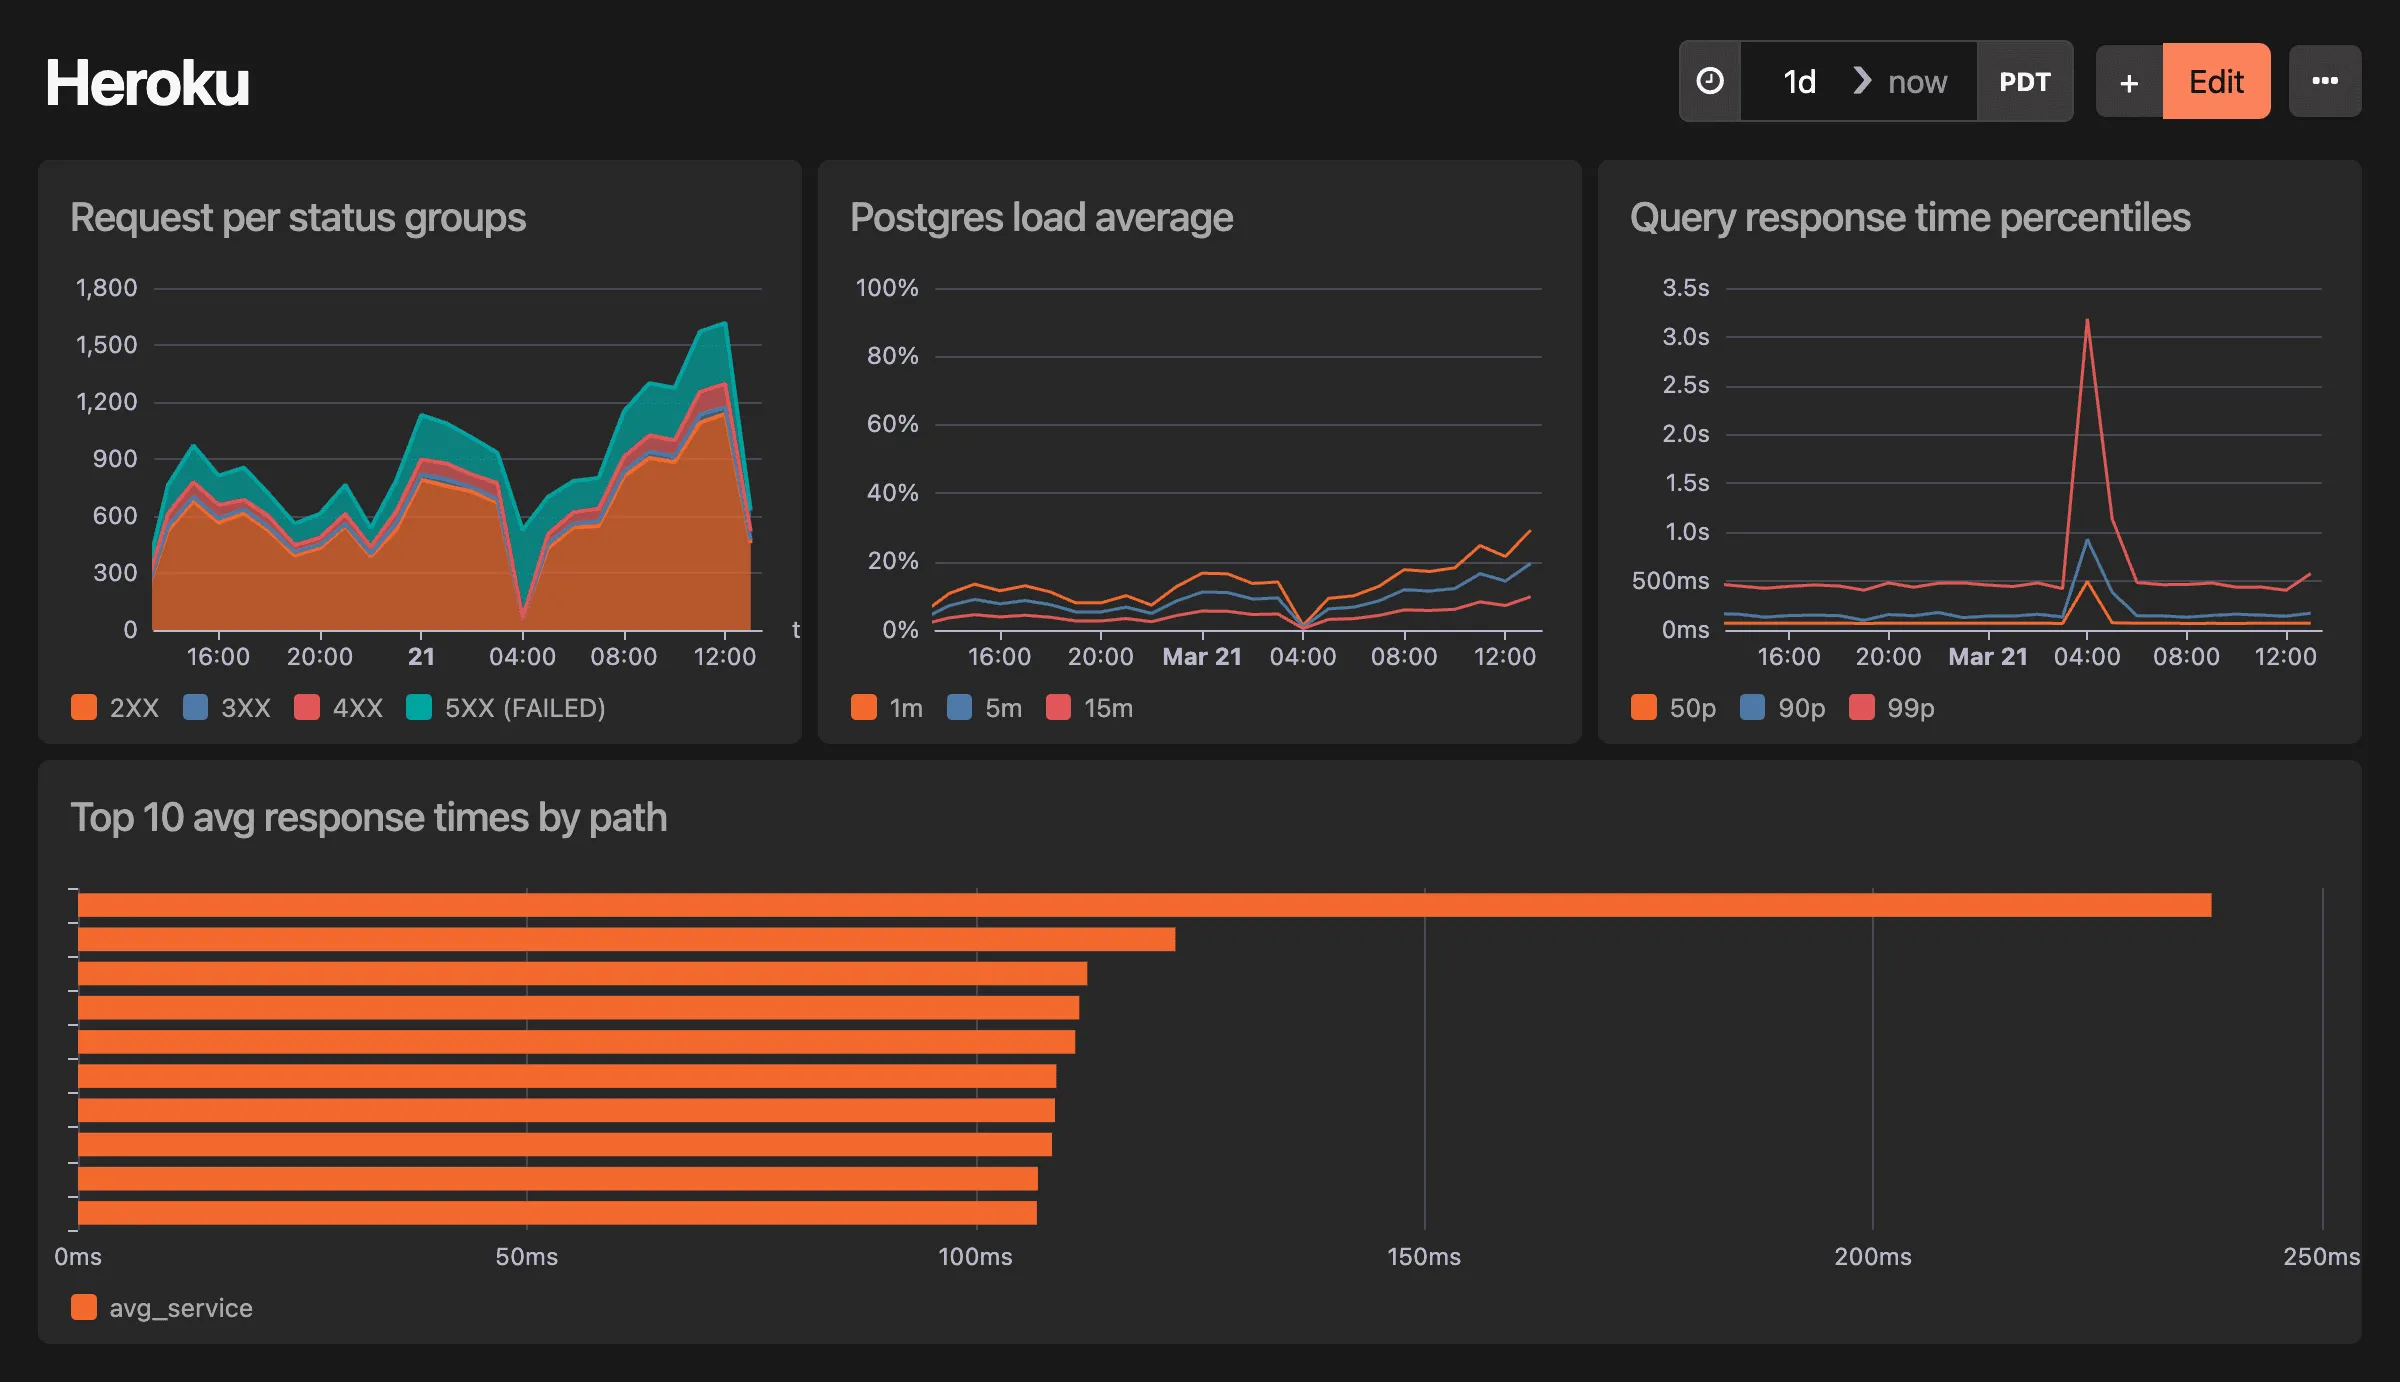
# Karafka dashboard
> Consumer lag, processing durations, and broker errors by topic
Drop in Dashboard for your Karafka instrumentation data **This dashboard includes:** * Average Consumer Duration * Average Consumer Lag * Number of Messages Processed by Topic * Average Consumer Consumption and Processing Duration * Broker Latency * Broker Errors To get started, make sure you have updated your Honeybadger gem to `>= 5.26`, then enable Insights instrumentation and Karafka metrics by including this in your `config/honeybadger.yml`:
```yaml
insights:
enabled: true
karafka:
insights:
metrics: true
```
Check out the [Honeybadger client documentation](https://docs.honeybadger.io/lib/ruby/getting-started/sending-events-to-insights/) for more information. 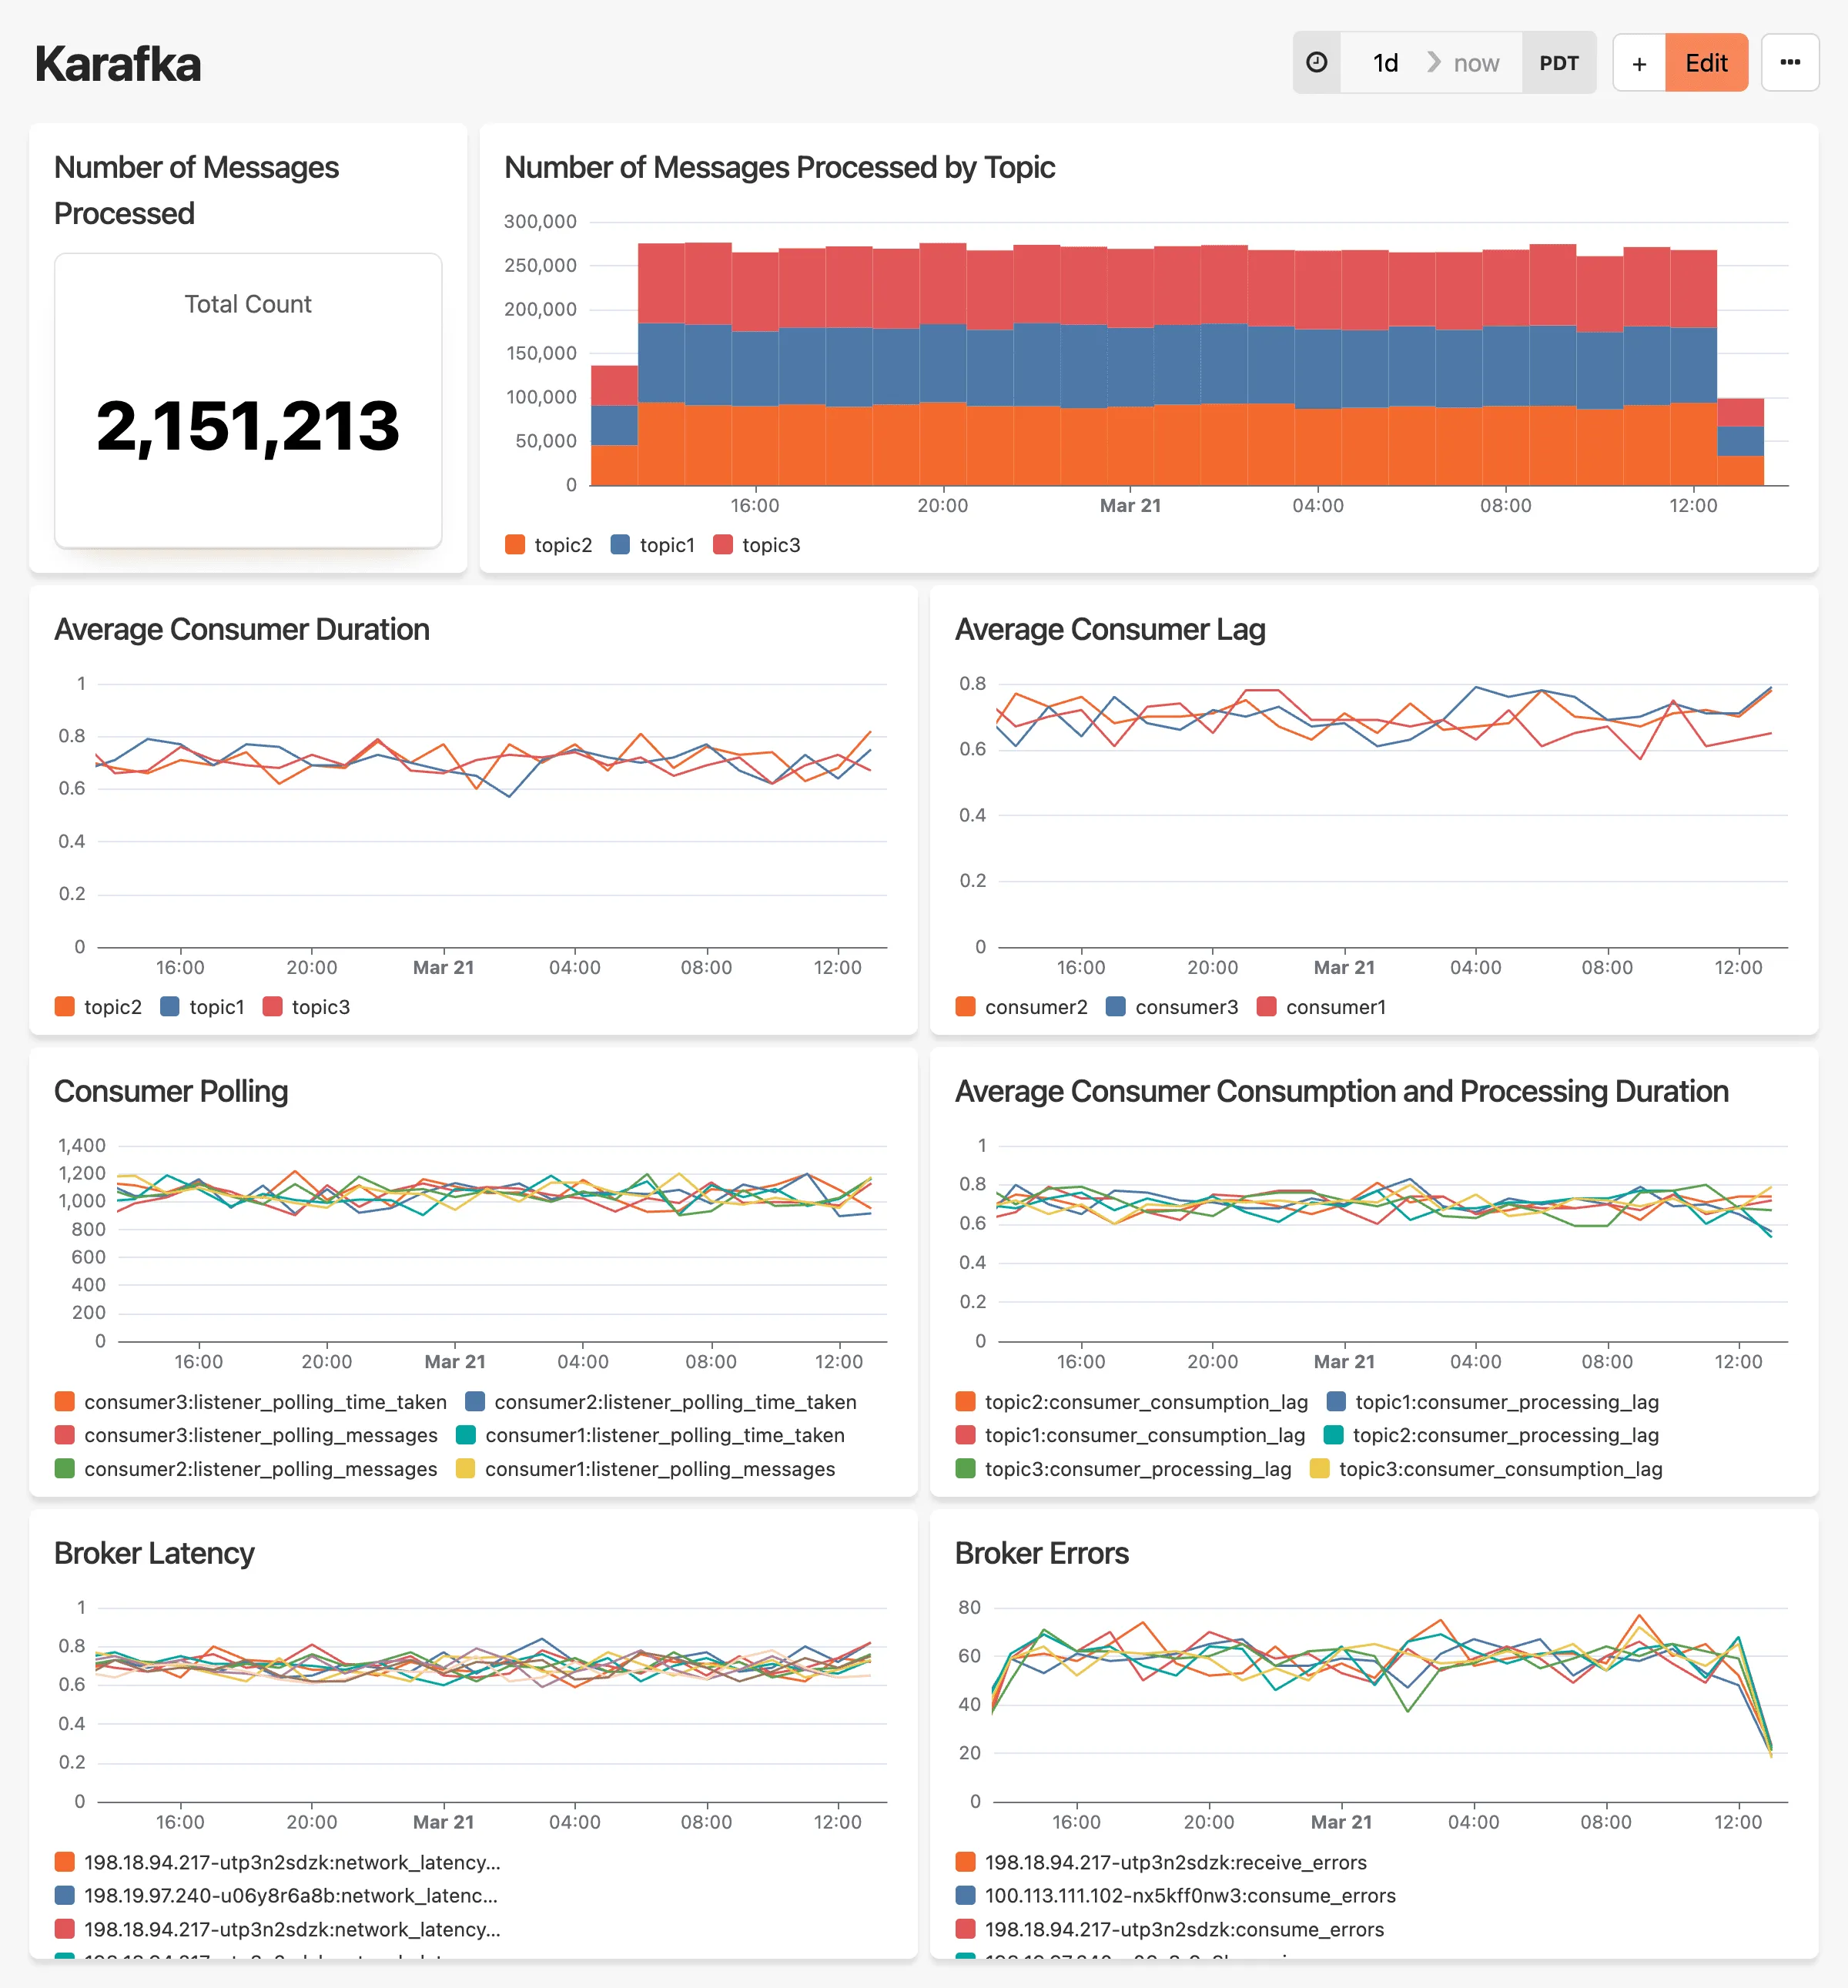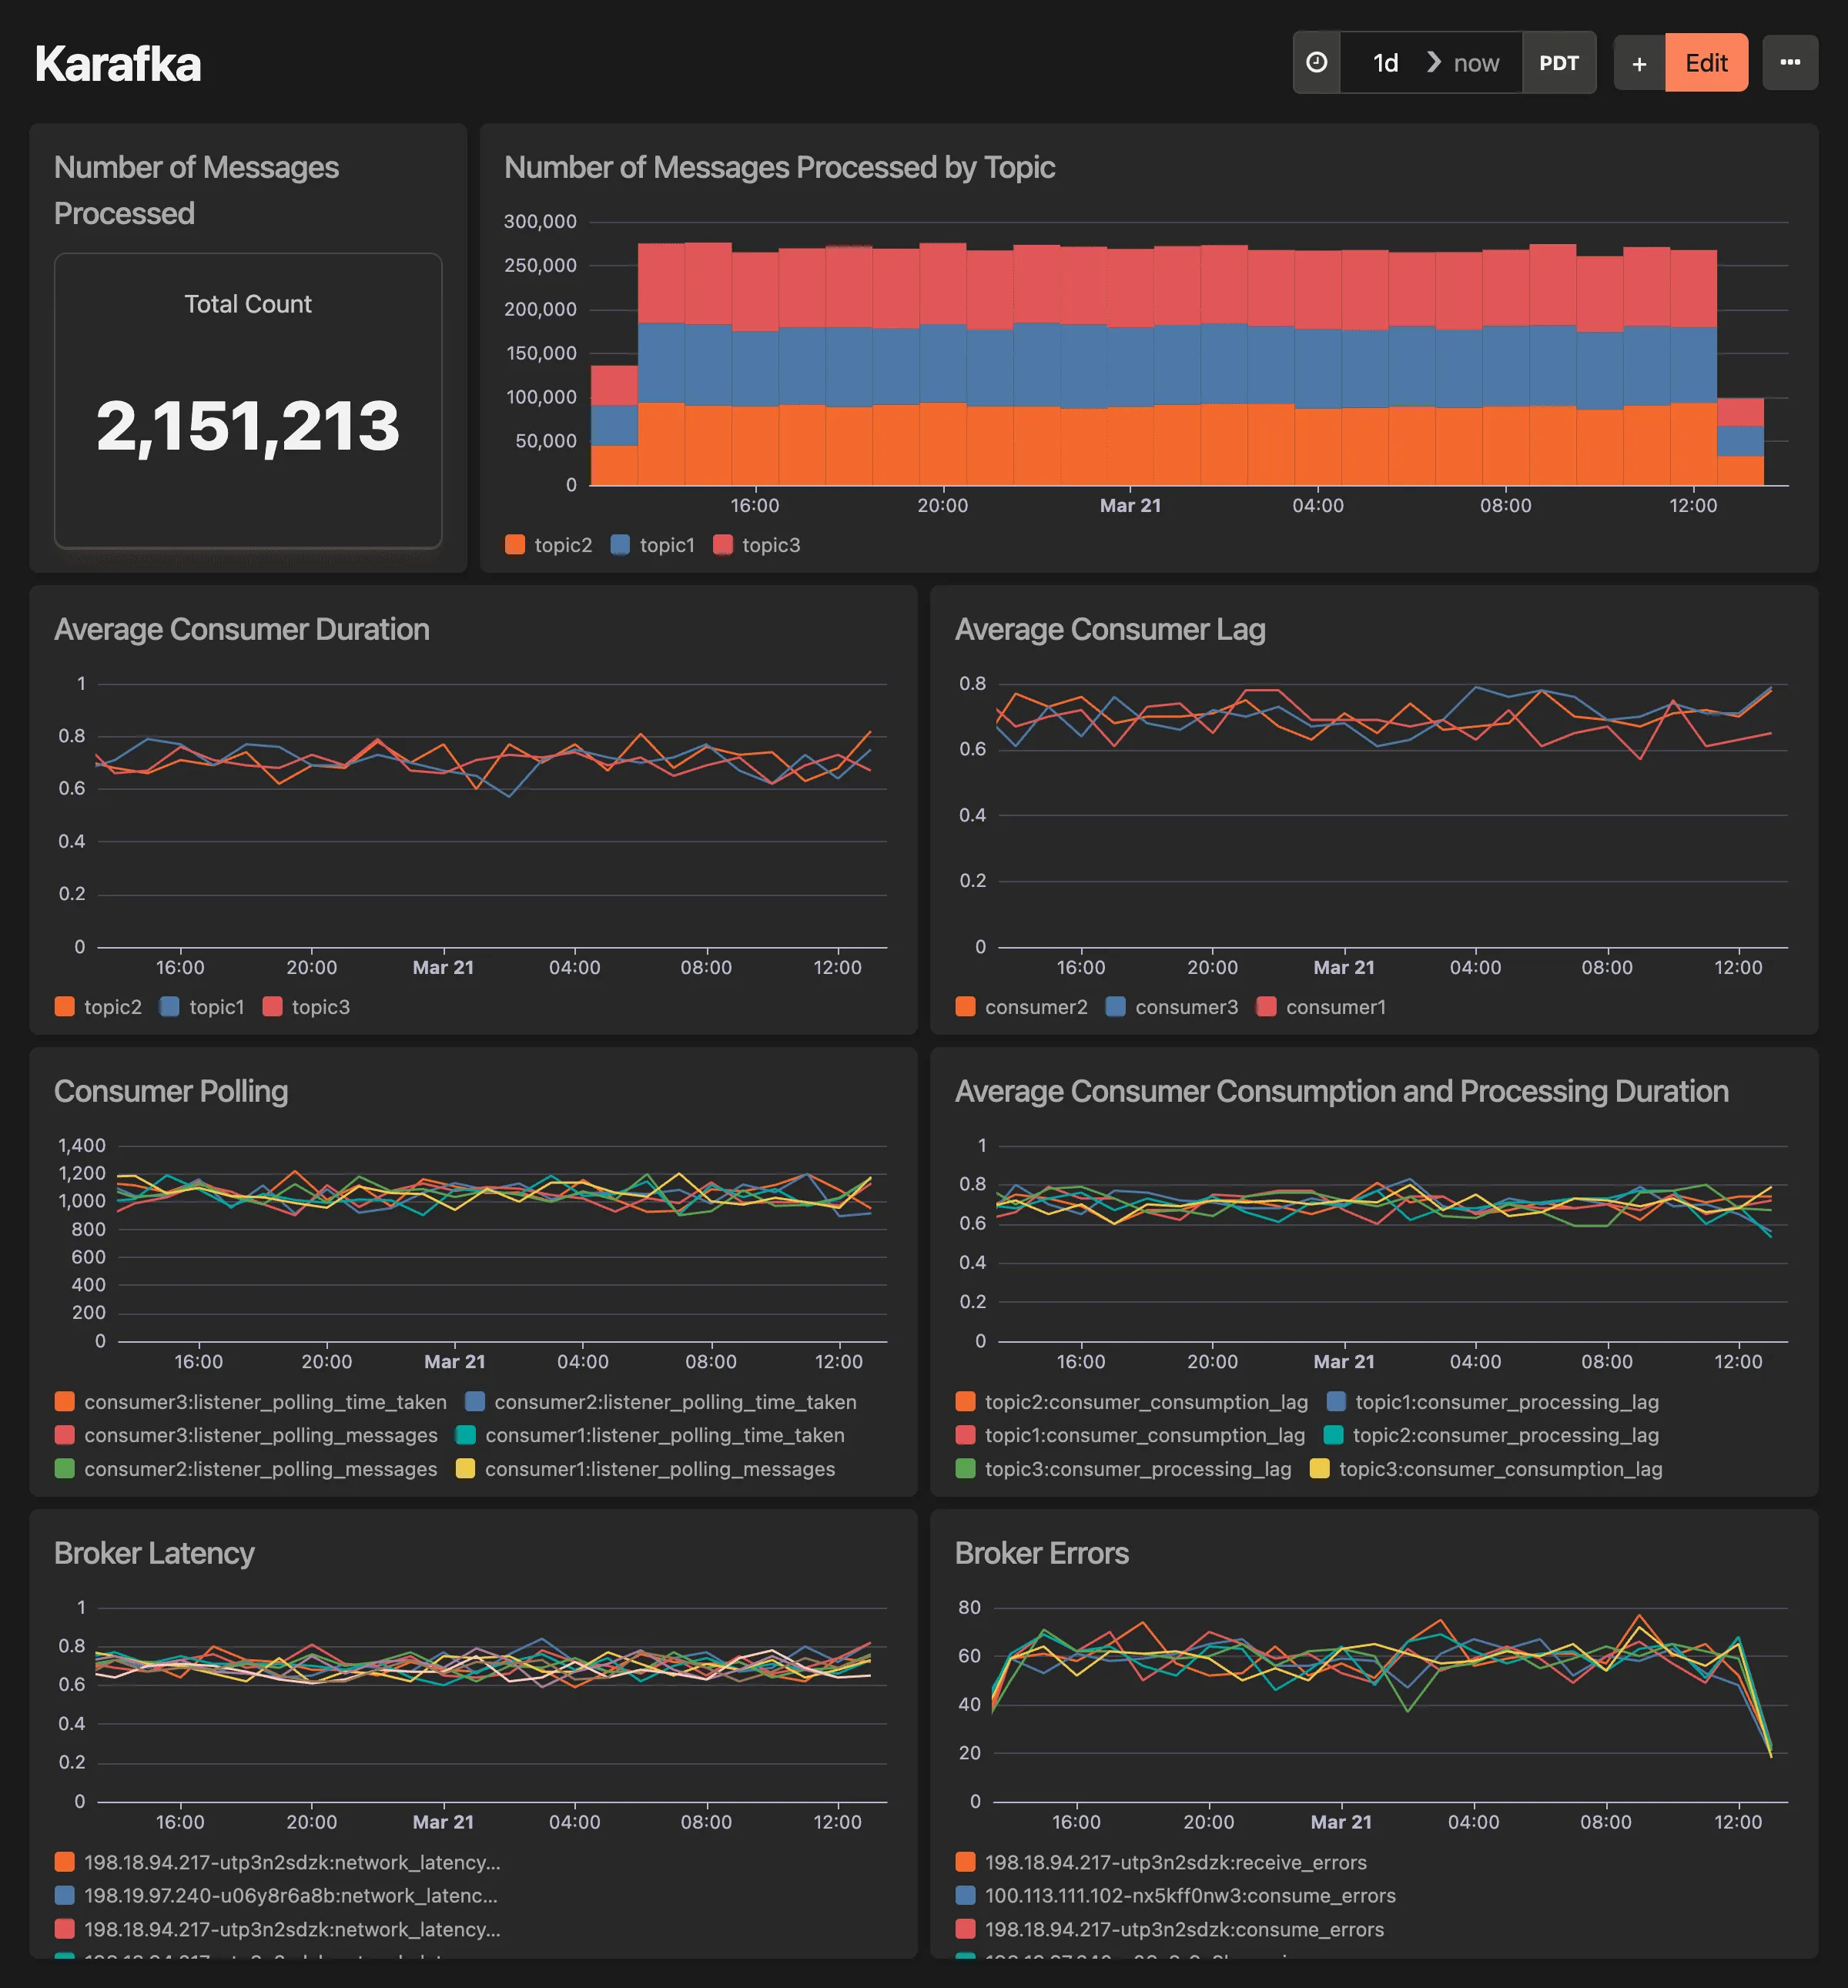
# Laravel dashboard
> Request and job durations, response distributions, slowest controllers and queries
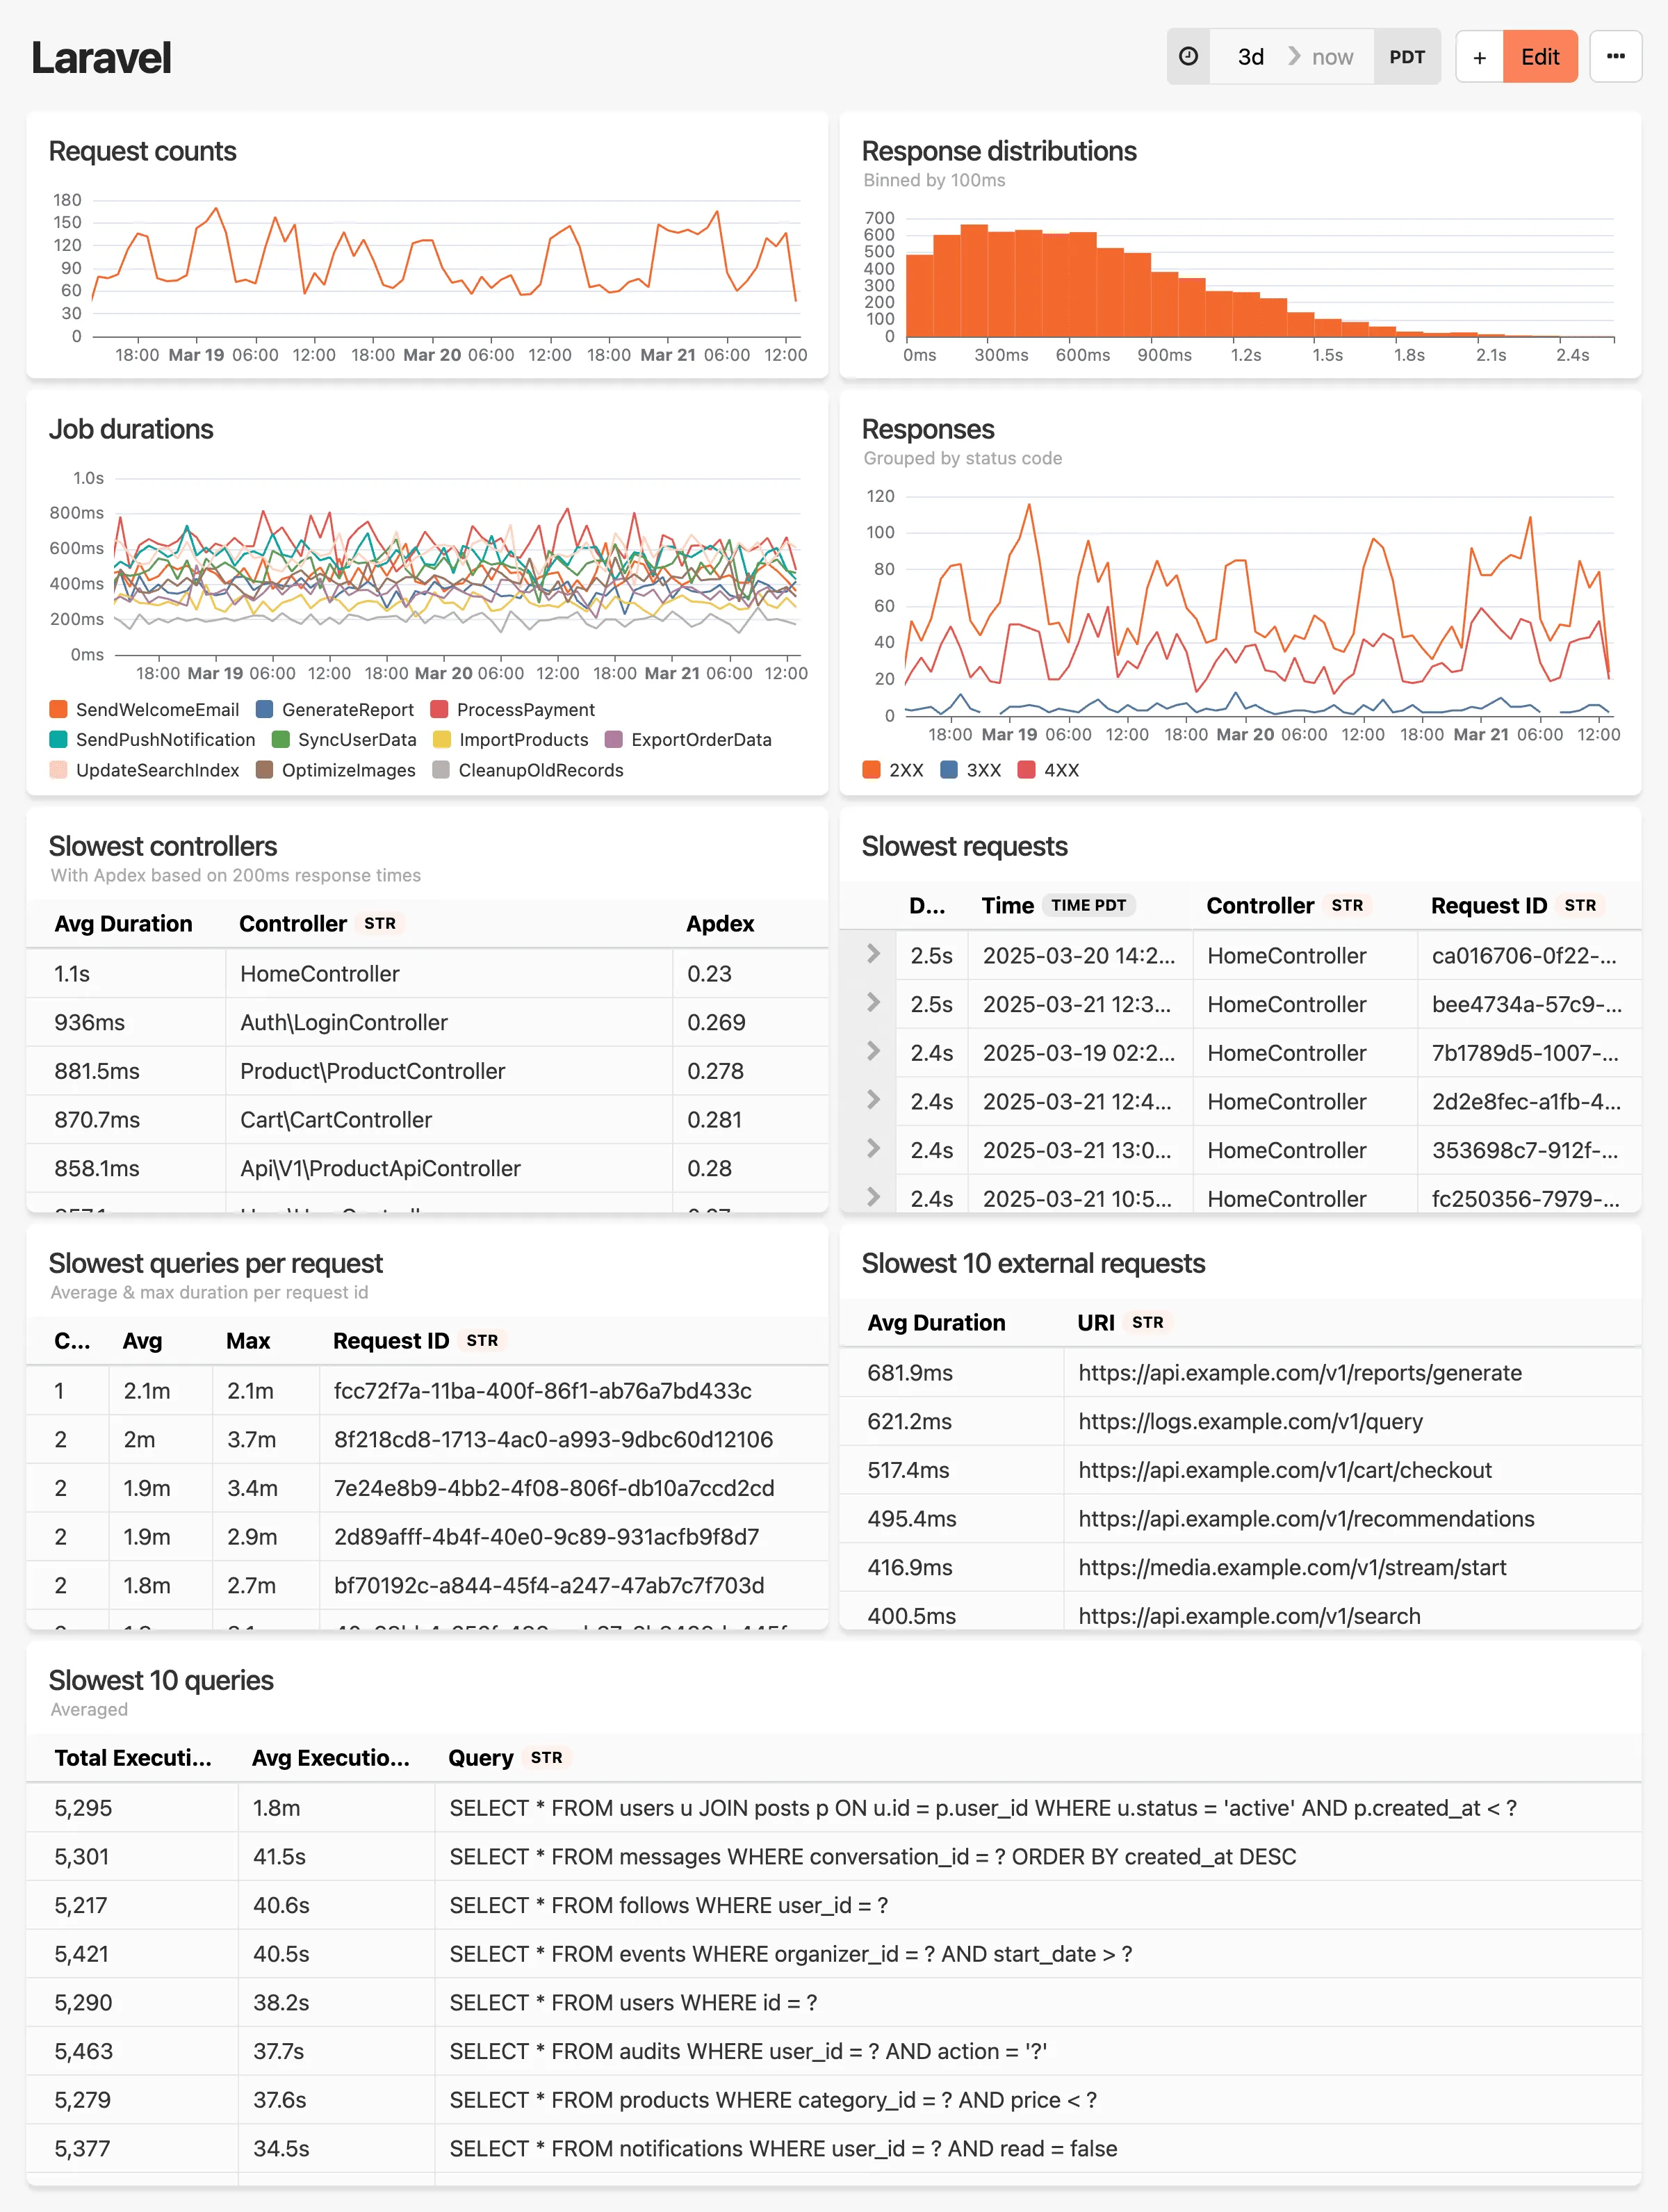
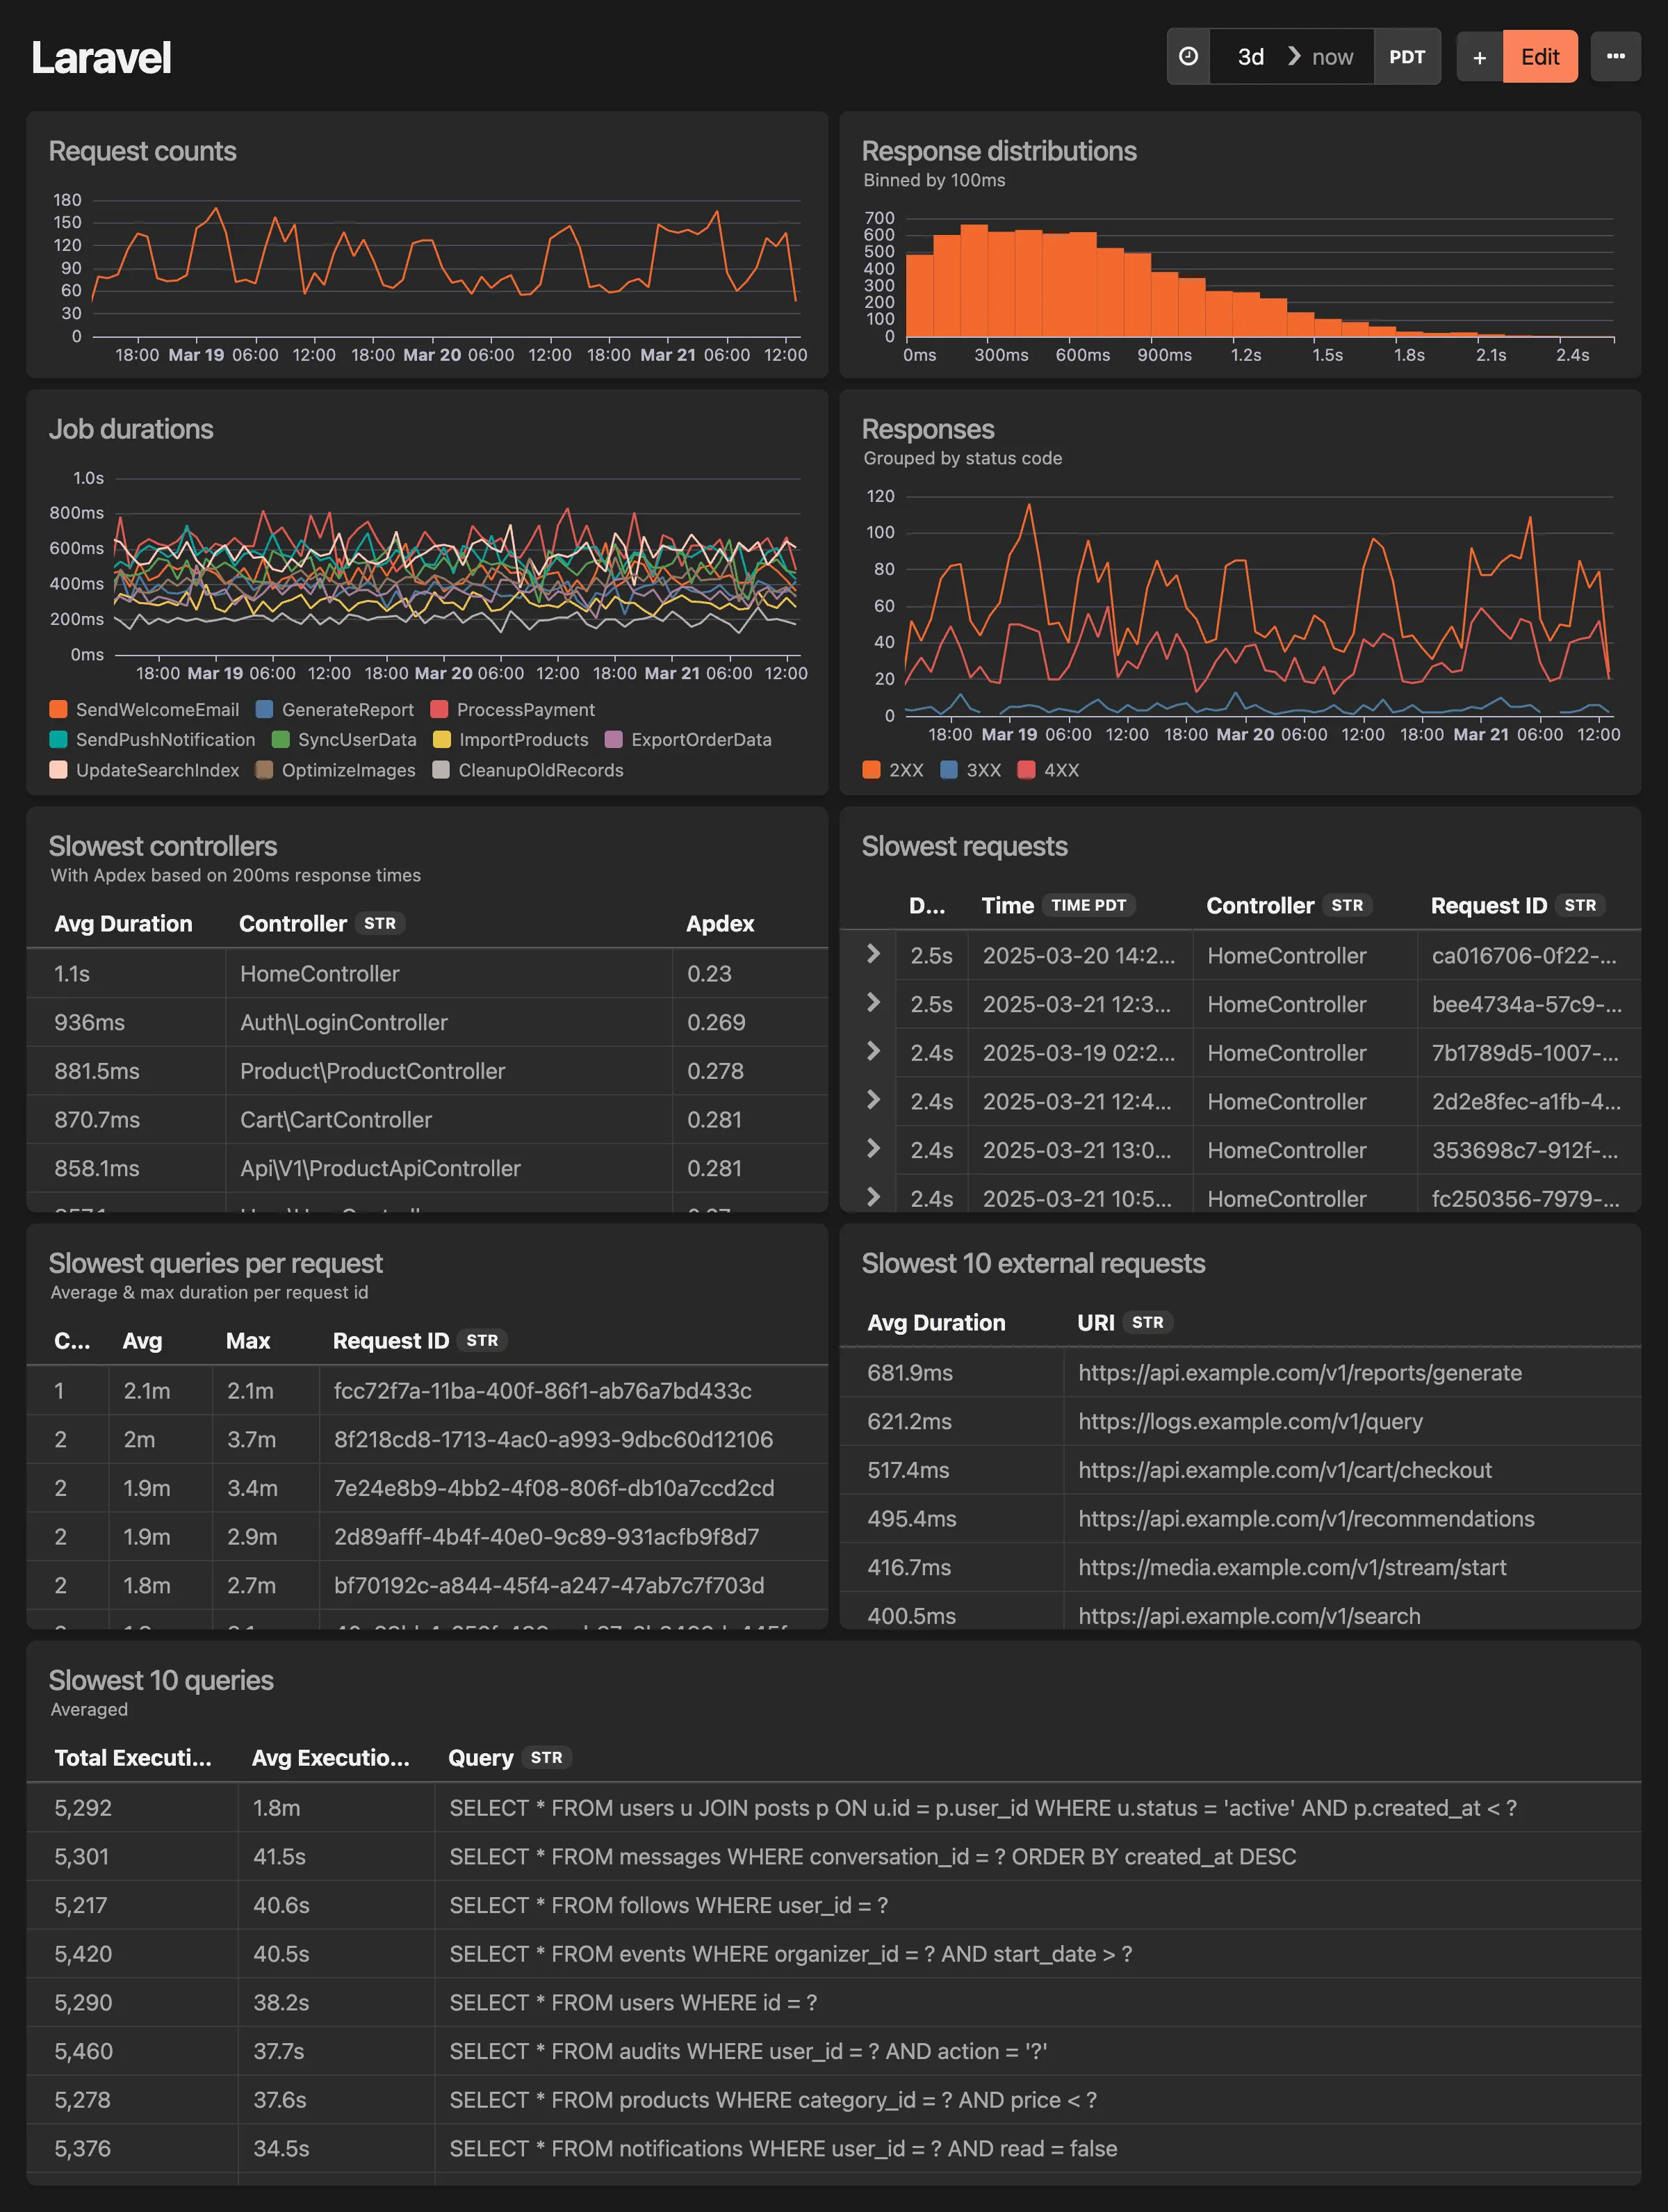
Drop in Dashboard for your Laravel instrumentation data **This dashboard includes:** * Total requests over time * Response distributions binned by 100ms * Job durations over time * Slowest controllers w/ Apdex score * Overall slowest requests * Slowest overall queries & slowest queries per request * Slowest external requests To get started, make sure you have updated your honeybadger-laravel package to `>= 4.2.0 `, then enable Insights instrumentation by including this in your `config/honeybadger.php`:
```php
'events' => [
'enabled' => true
]
```
# Net::HTTP Metrics dashboard
> Outbound HTTP throughput, durations, and status codes by host
Drop in Dashboard for your Net::HTTP metrics data Monitor outbound HTTP requests made via Ruby’s Net::HTTP library, including request durations, throughput, and response status breakdowns by host. **This dashboard includes:** * Request throughput by host * Avg request duration by host * Responses grouped by status code * Request duration by HTTP method * Slowest hosts To get started, make sure you have updated your Honeybadger gem to `>= 5.11`, then enable Insights metrics by including this in your `config/honeybadger.yml`:
```yaml
insights:
enabled: true
net_http:
insights:
metrics: true
```
Check out the [Honeybadger client documentation](https://docs.honeybadger.io/lib/ruby/getting-started/sending-events-to-insights/) for more information. 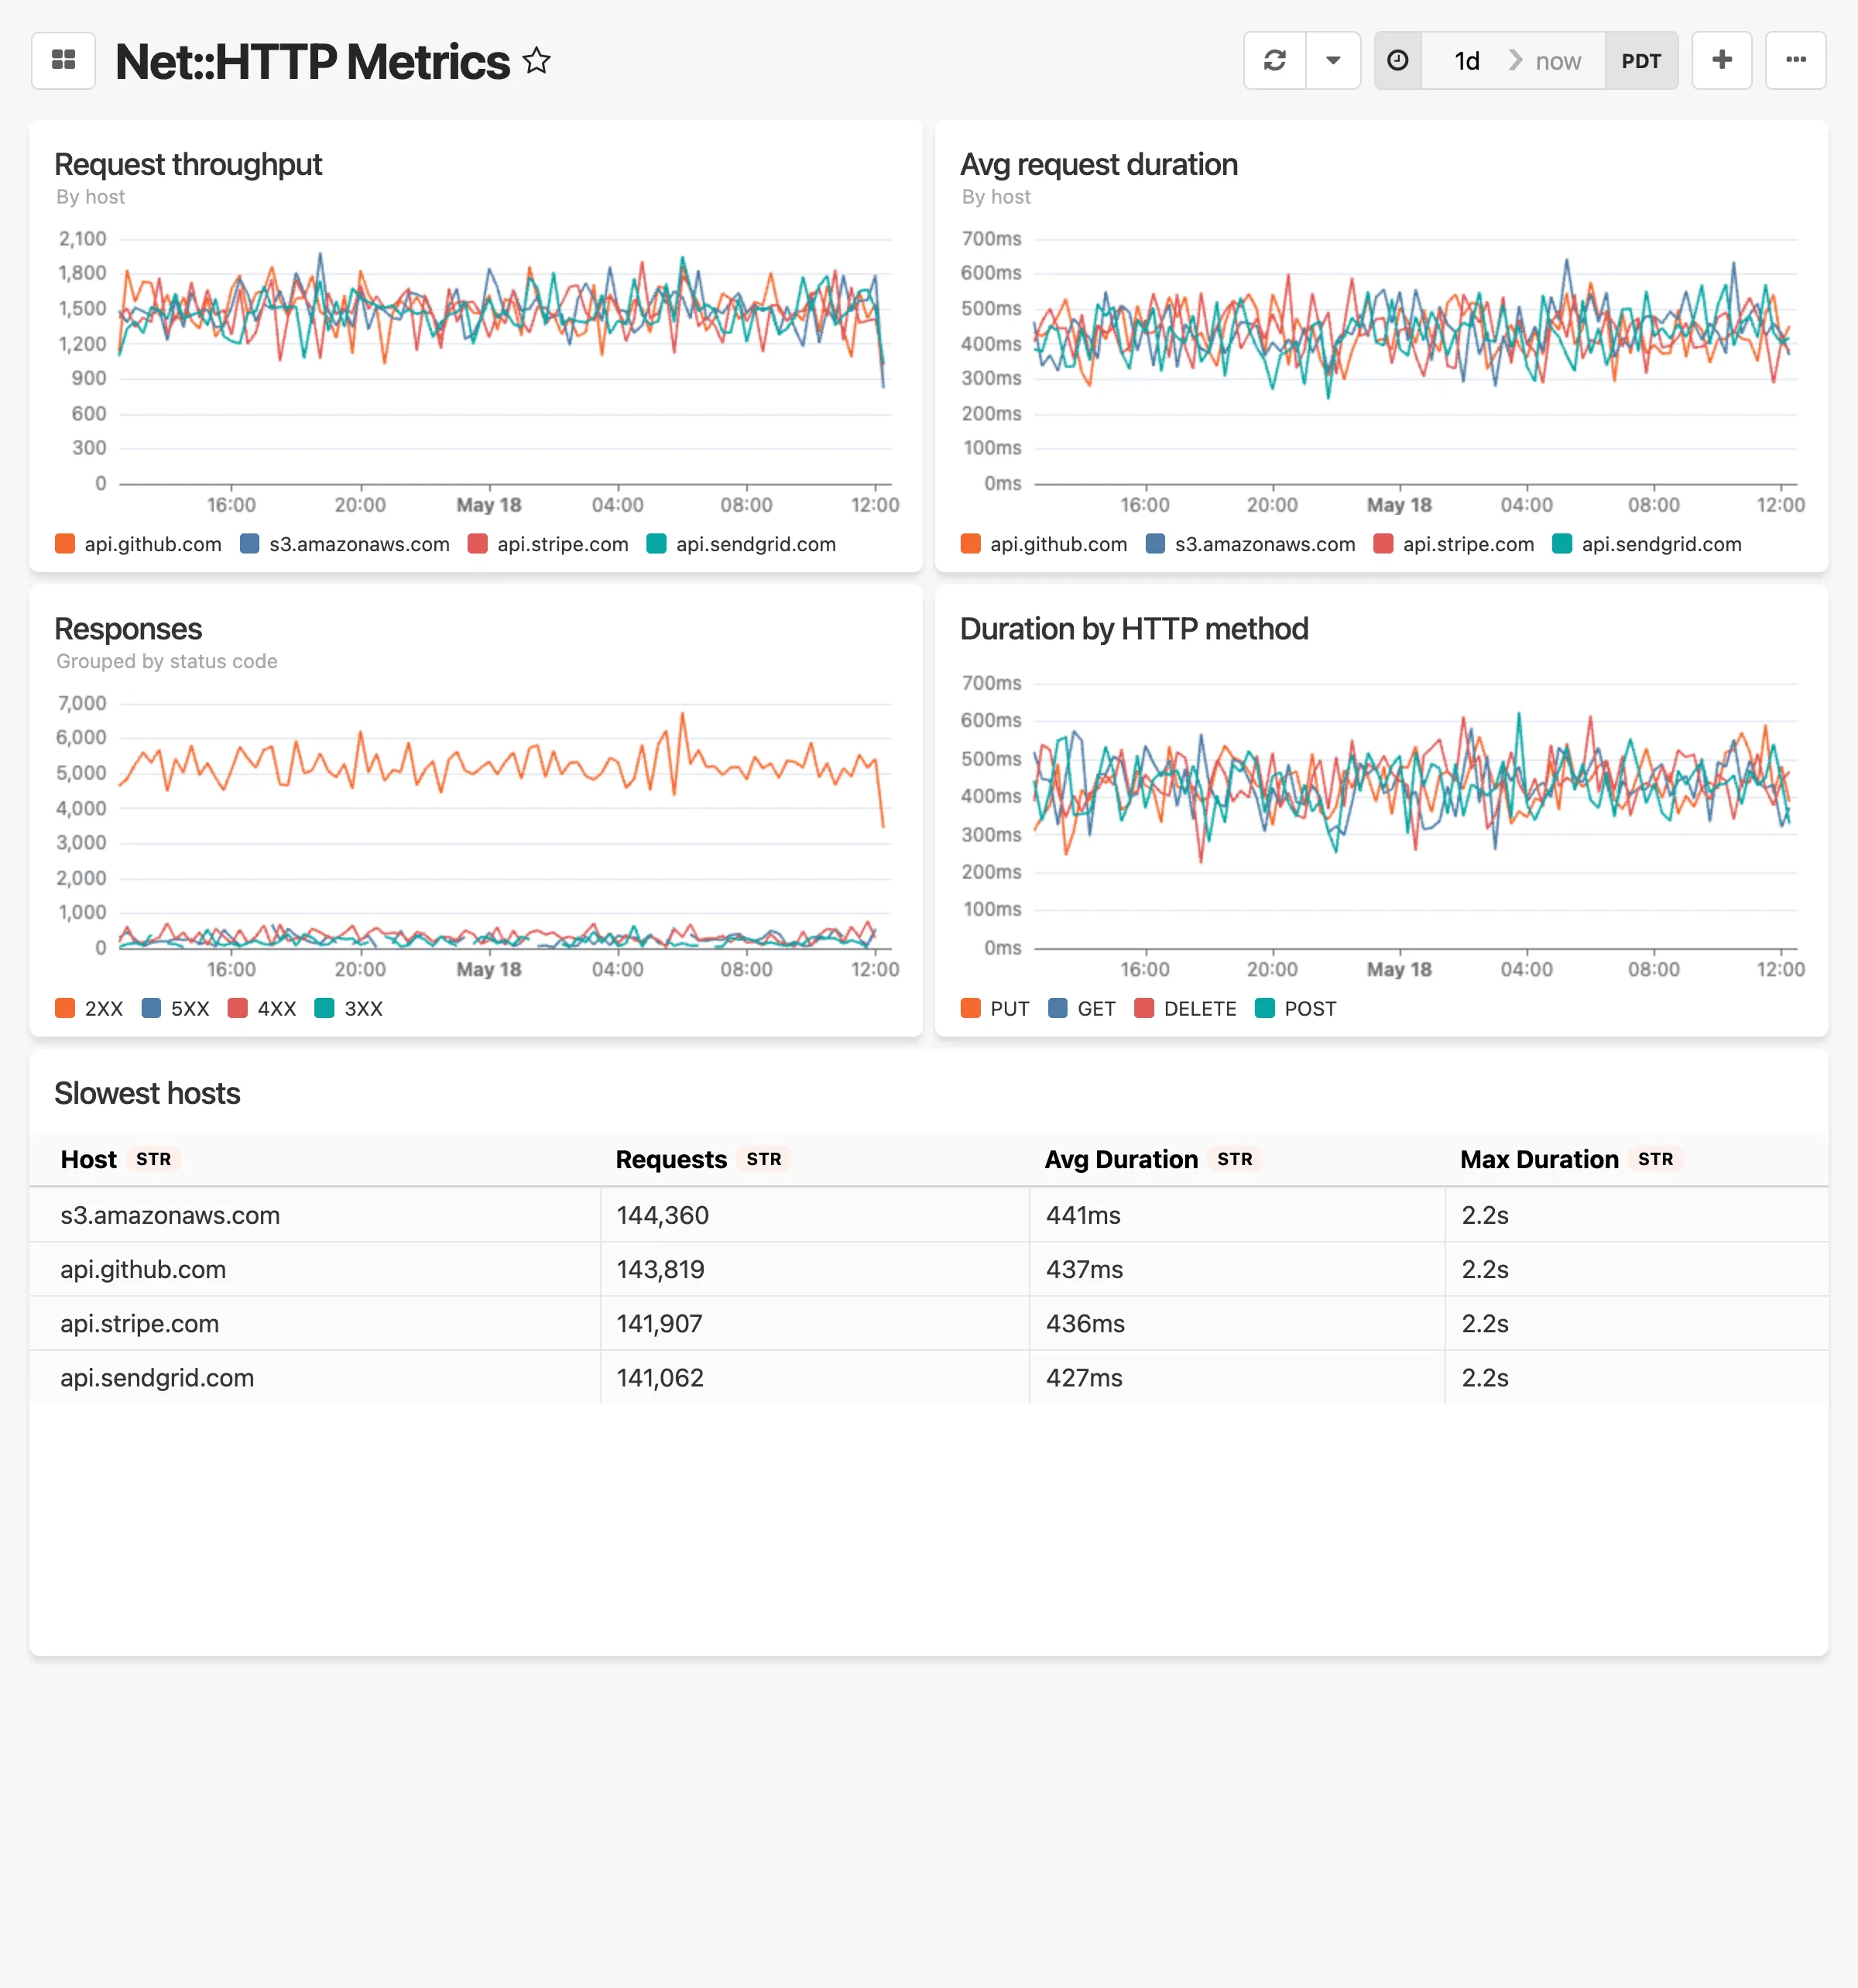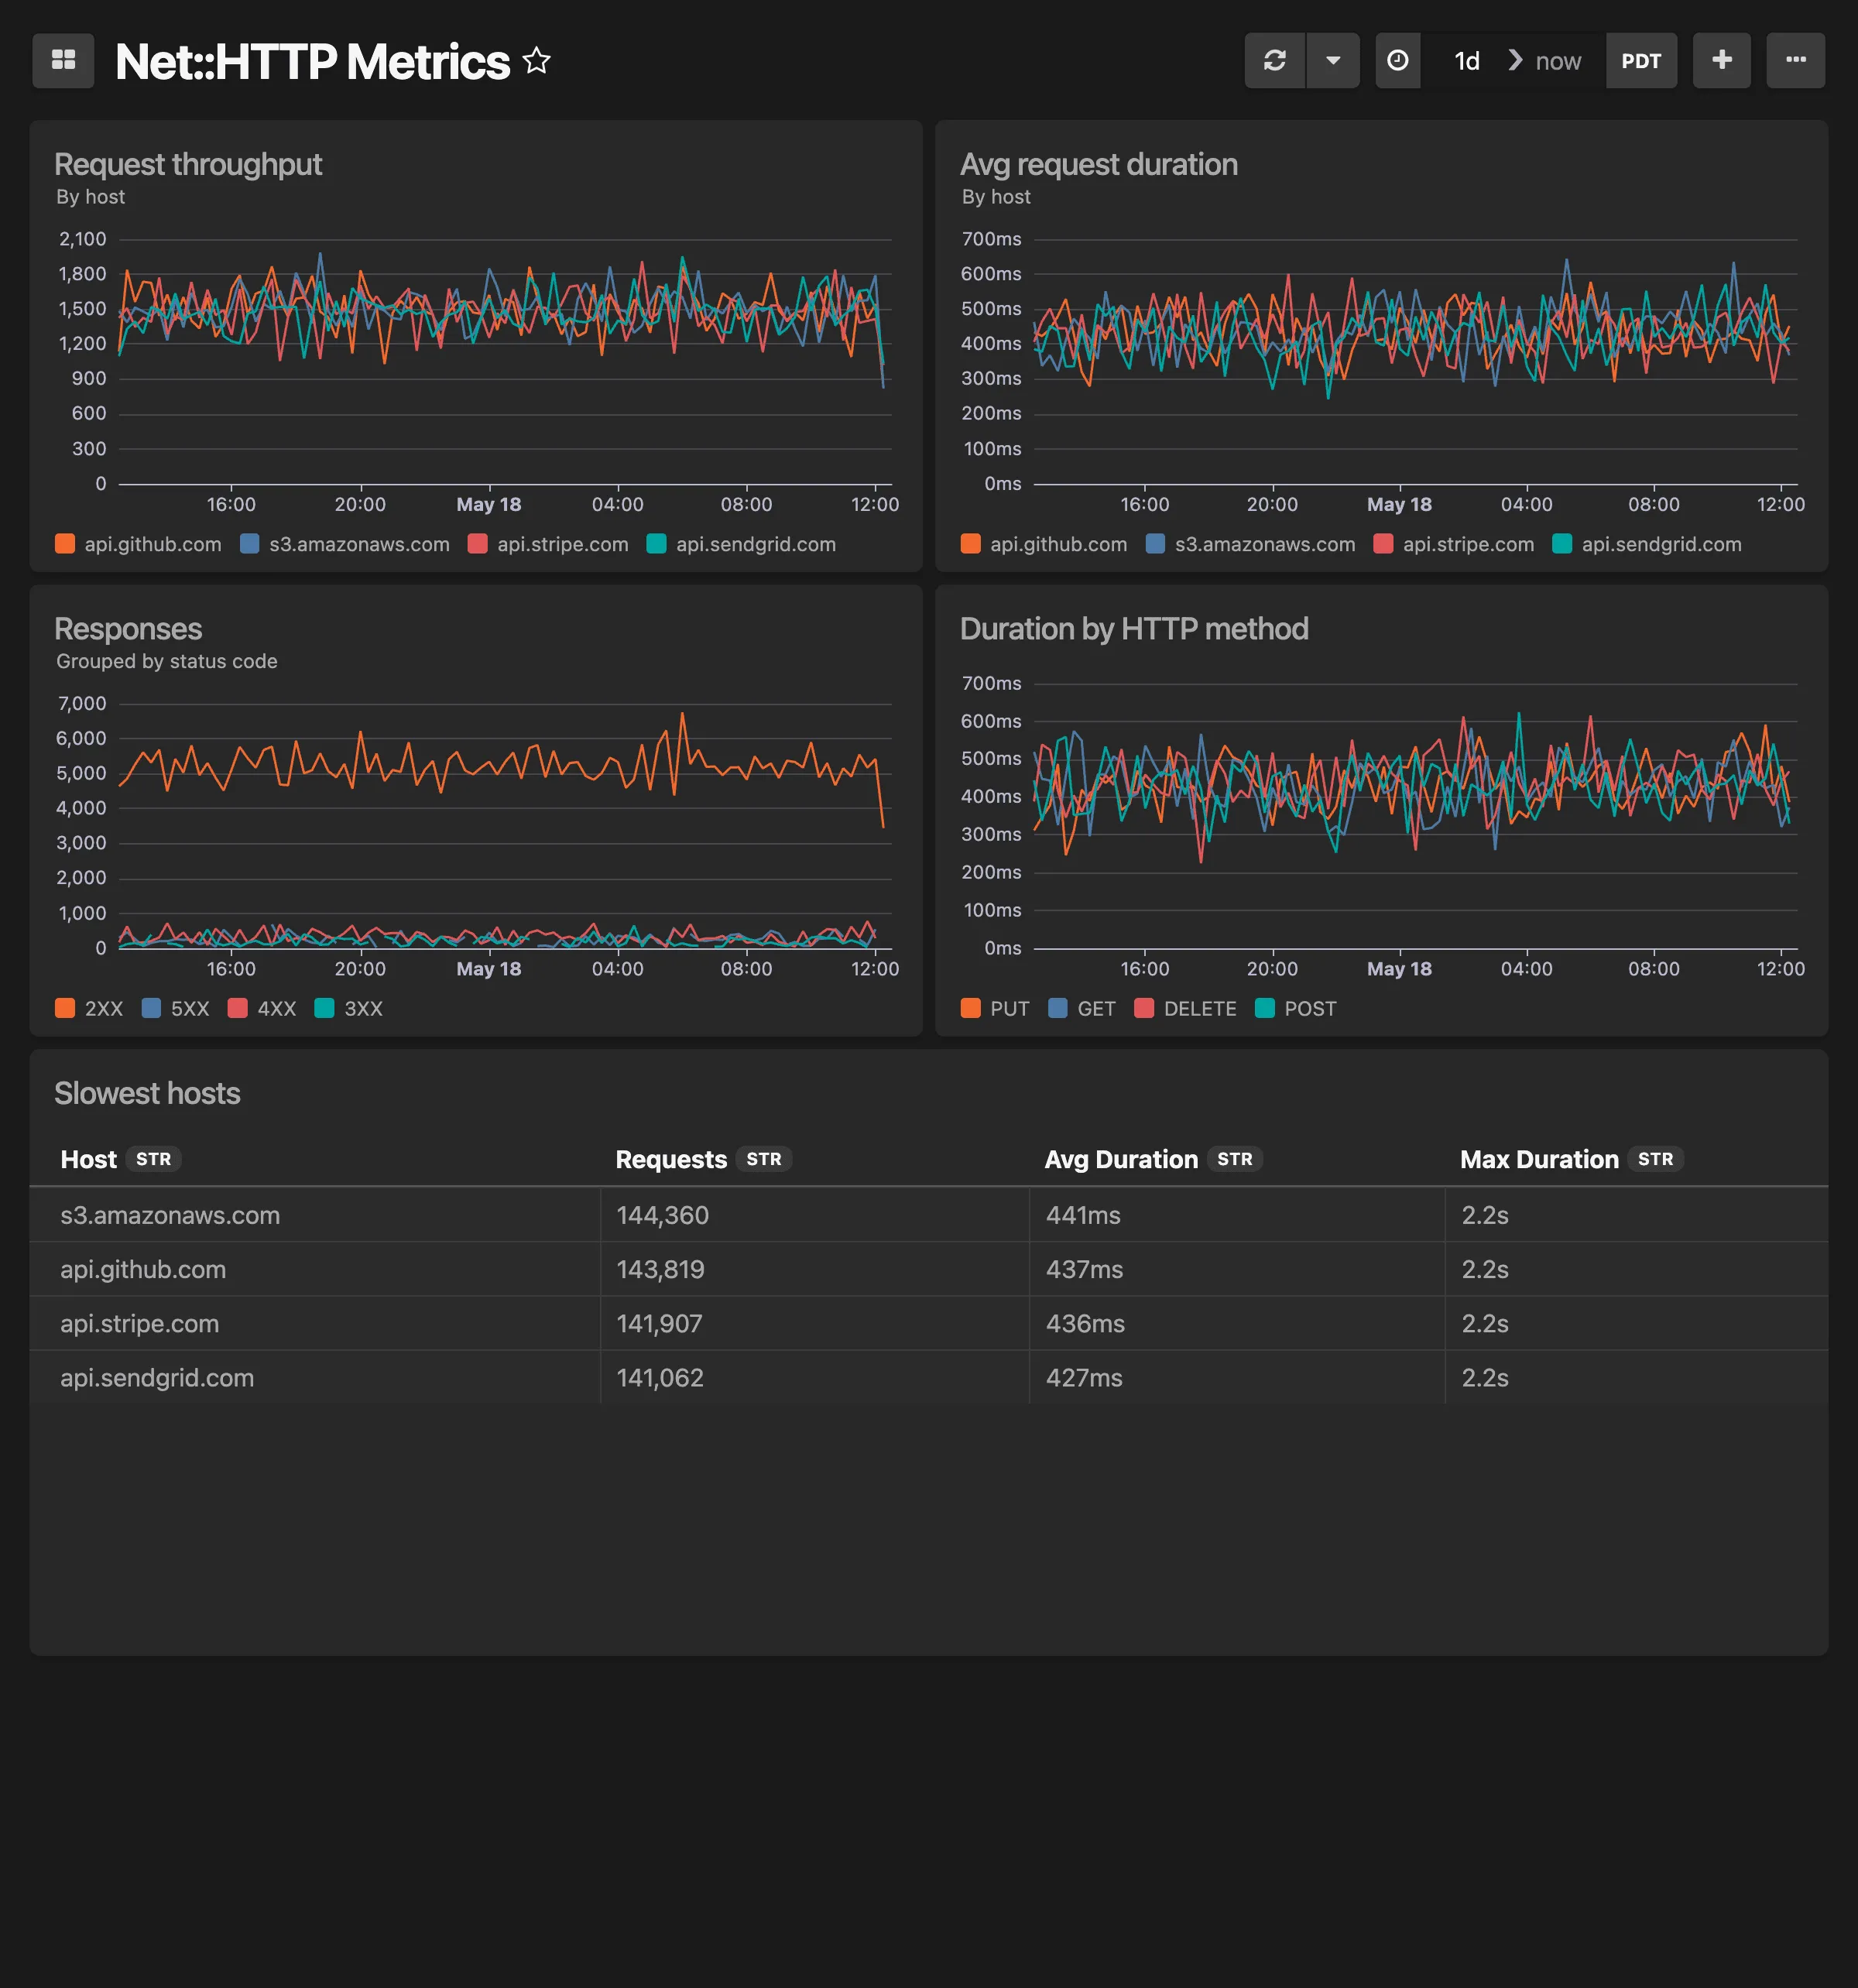
# Oban dashboard
> Job counts by status, durations by worker, and slowest job runs
Ready made dashboard for your Oban data. This dashboard includes: * Overall Job counts by status * Histogram of job counts by status * Job durations by Worker module * Overall Worker stats * Slowest 10 job runs To get started, make sure you have updated Honeybadger Elixir Client to `>= 0.24`, then enable Insights instrumentation by including this in your config:
```elixir
config :honeybadger,
insights_enabled: true
```
Check out the Honeybadger client documentation for more information. 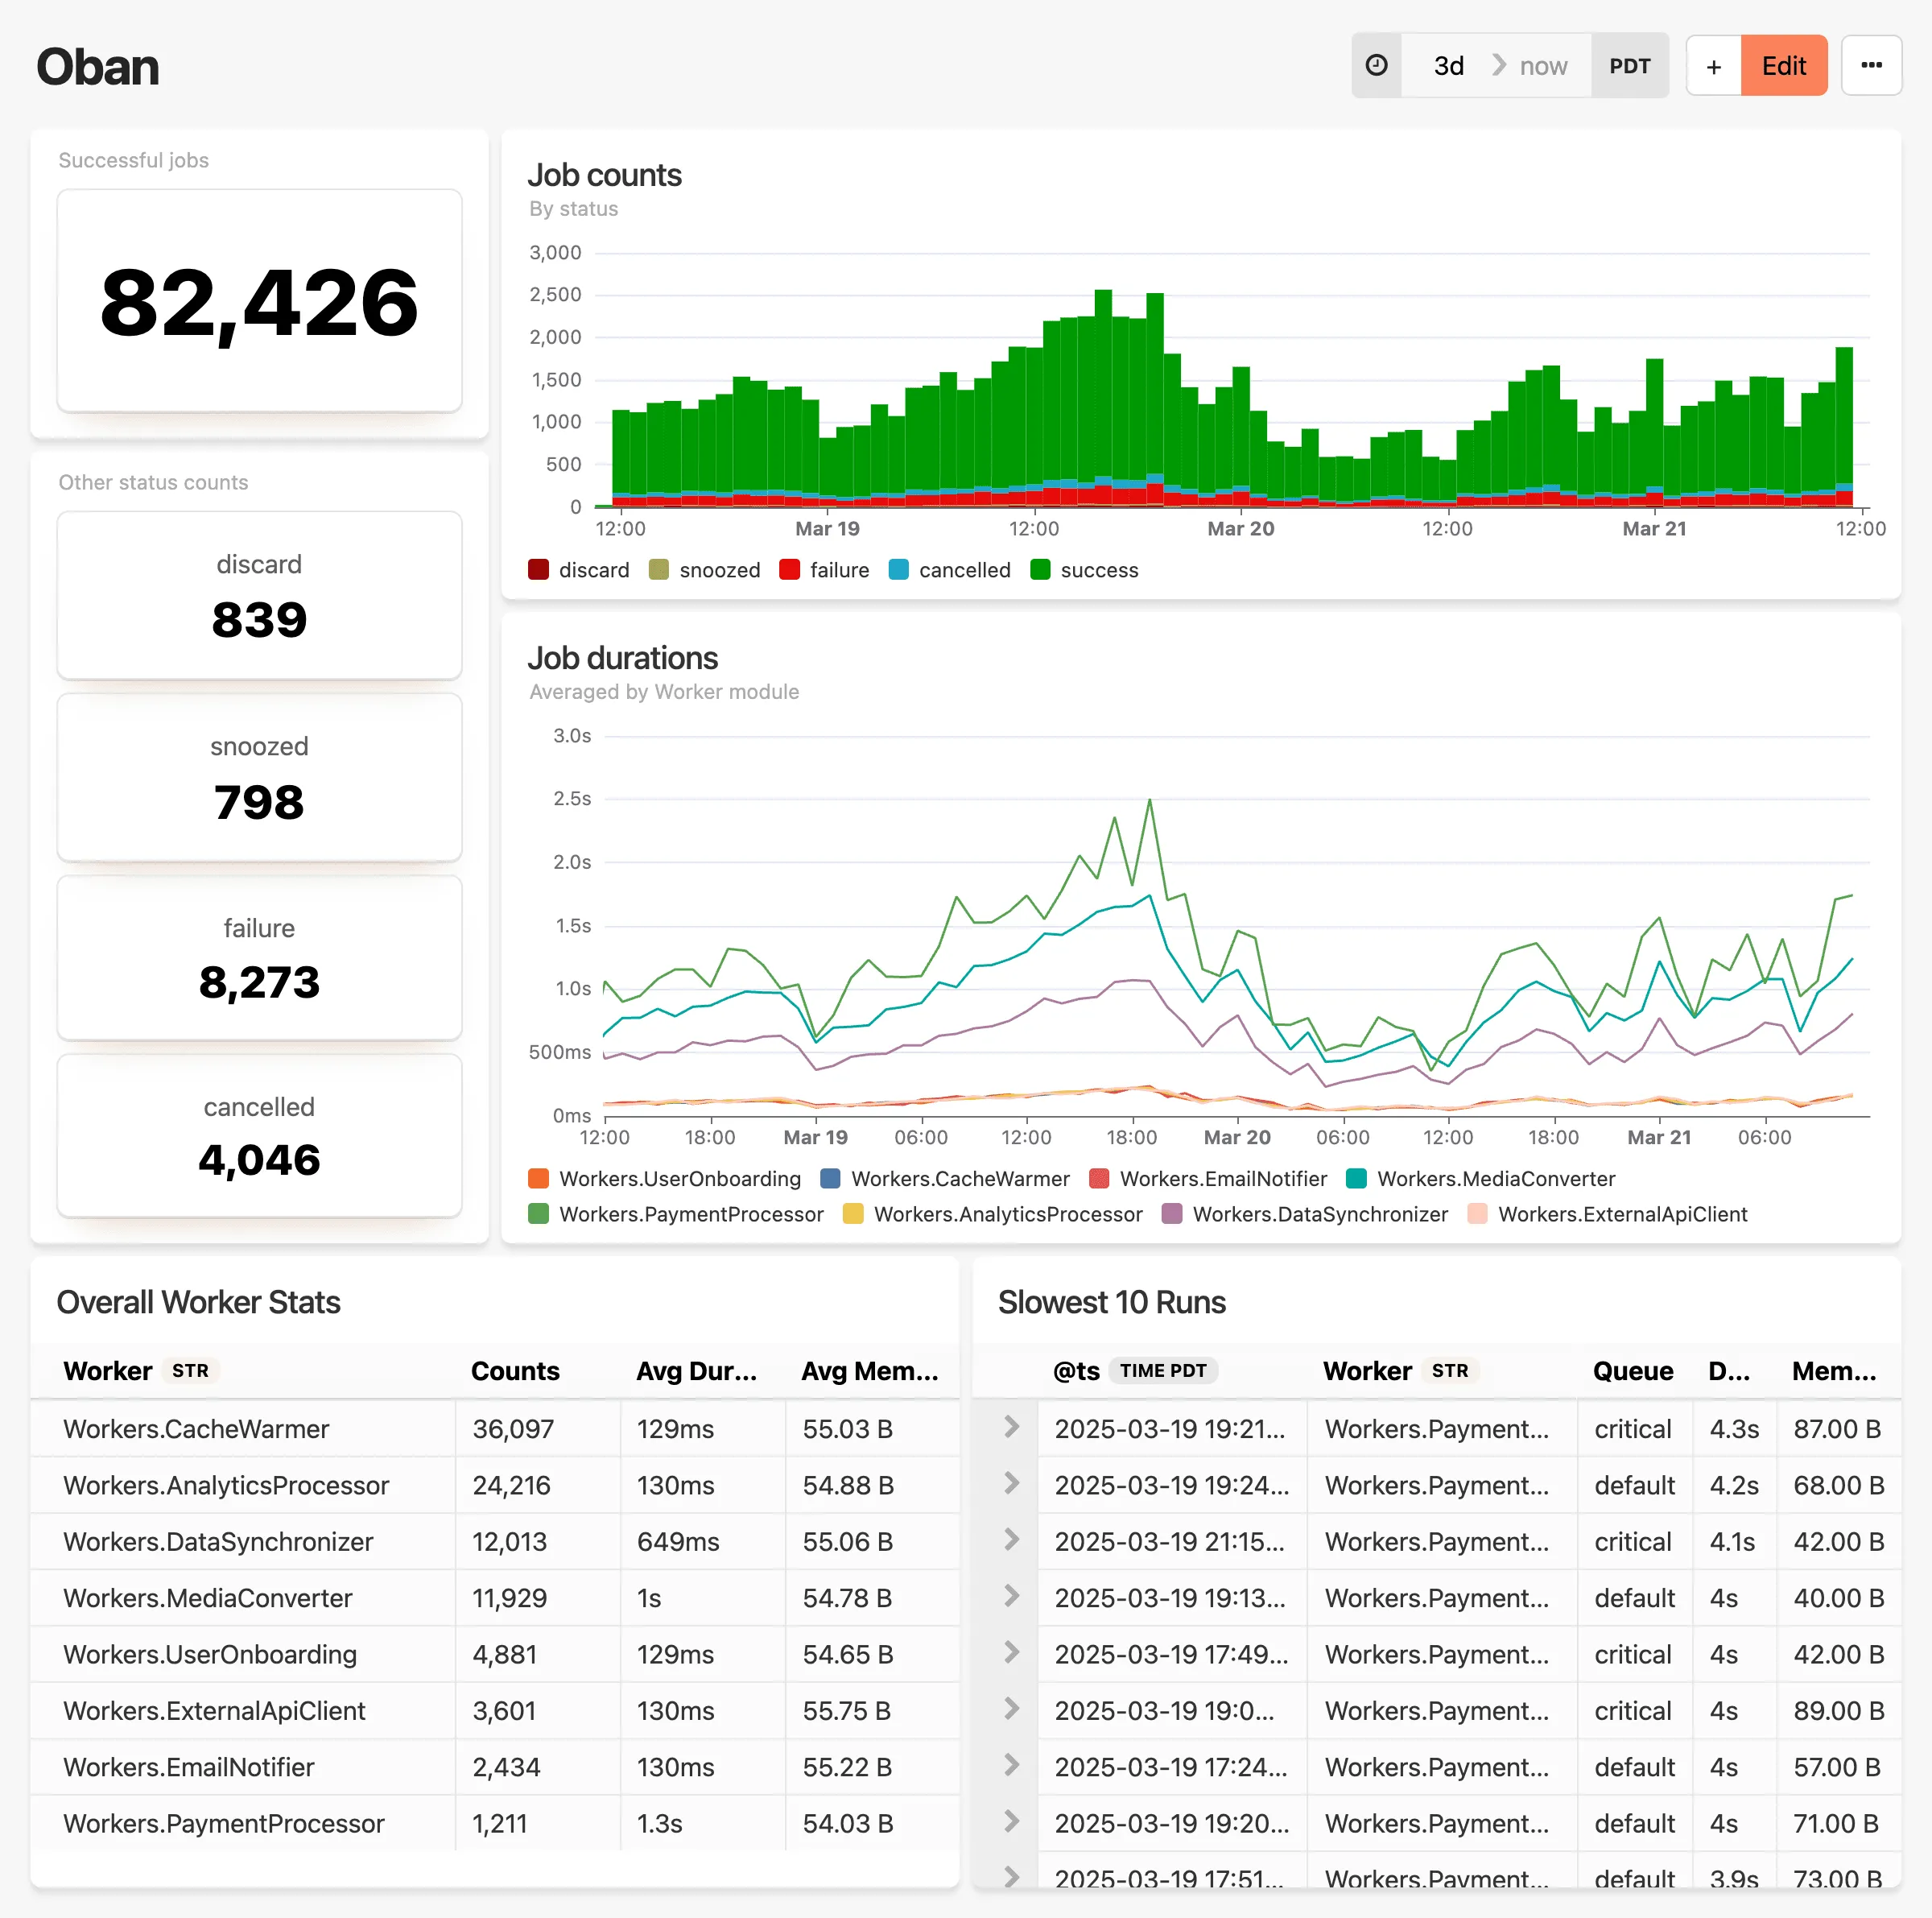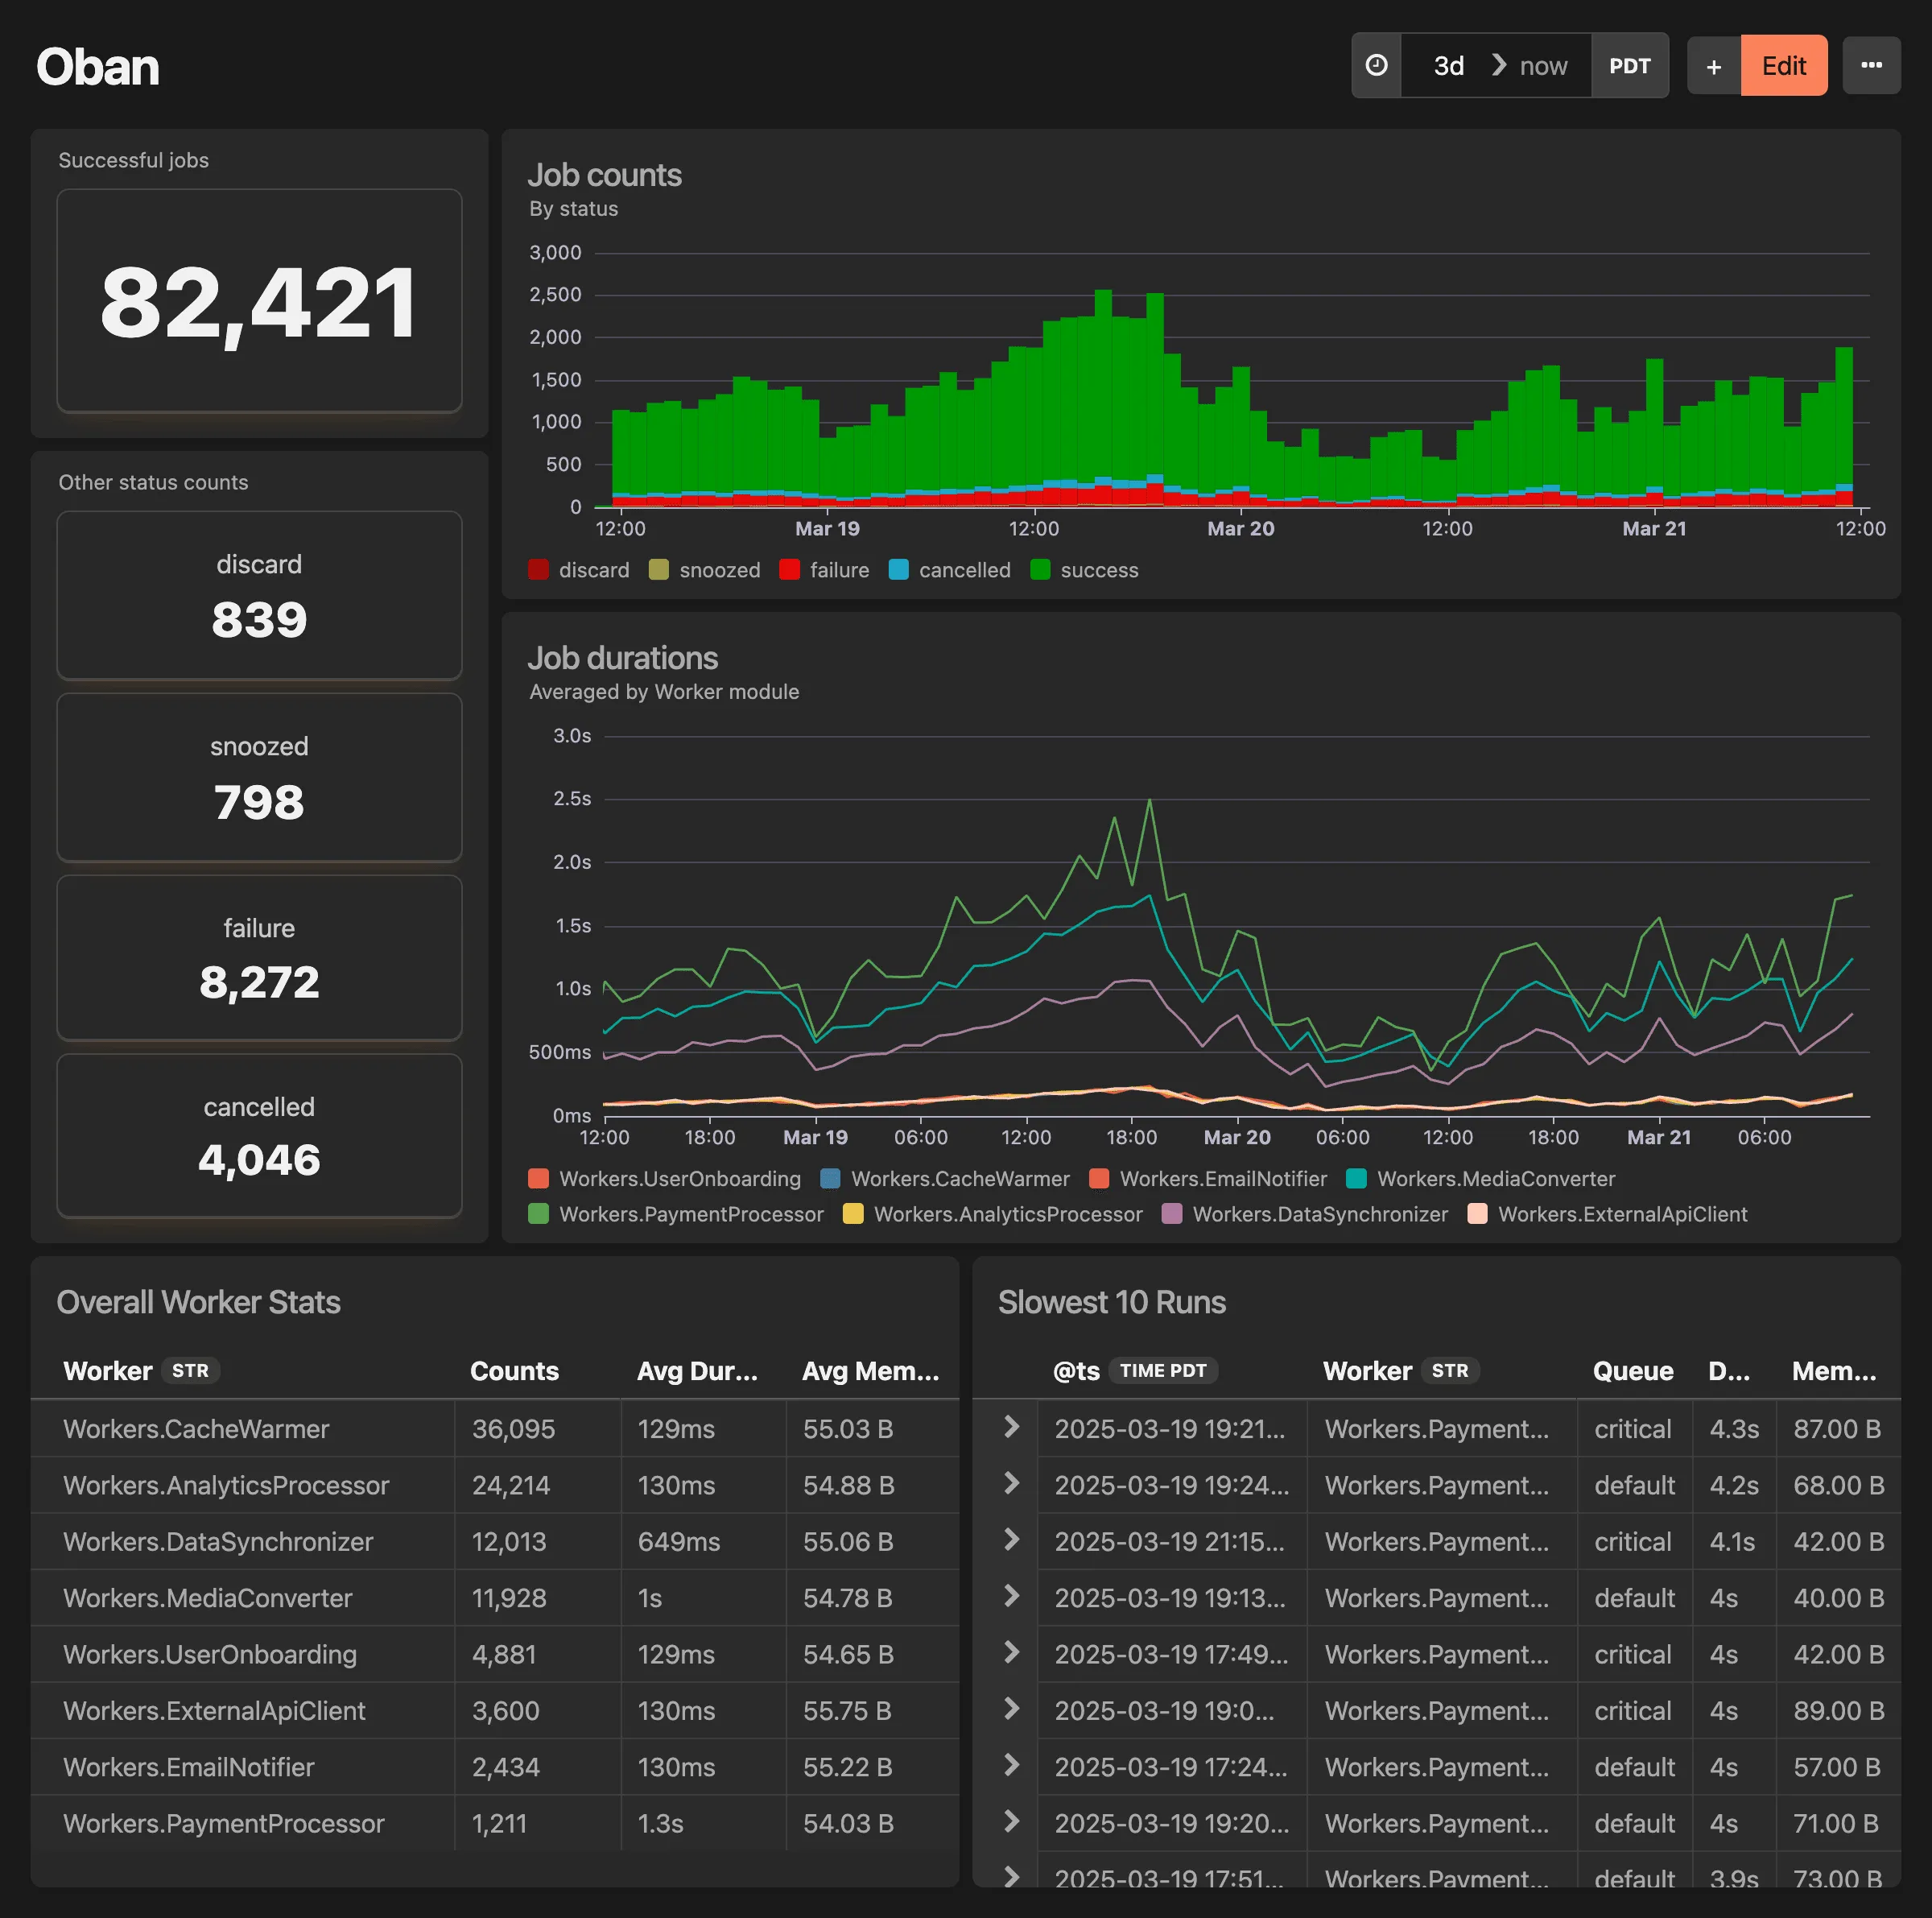
# Phoenix dashboard
> Request stats, slowest controllers and Ecto queries, LiveView event performance
Ready made dashboard for your Phoenix data. This dashboard includes: * Request Stats * Response Counts by status code * 10 Slowest Controller Actions * 10 Slowest Ecto Queries * LiveView Event Performance * LiveView Mount Performance * LiveView Event Counts To get started, make sure you have updated Honeybadger Elixir Client to `>= 0.24`, then enable Insights instrumentation by including this in your config:
```elixir
config :honeybadger,
insights_enabled: true
```
Check out the Honeybadger client documentation for more information. 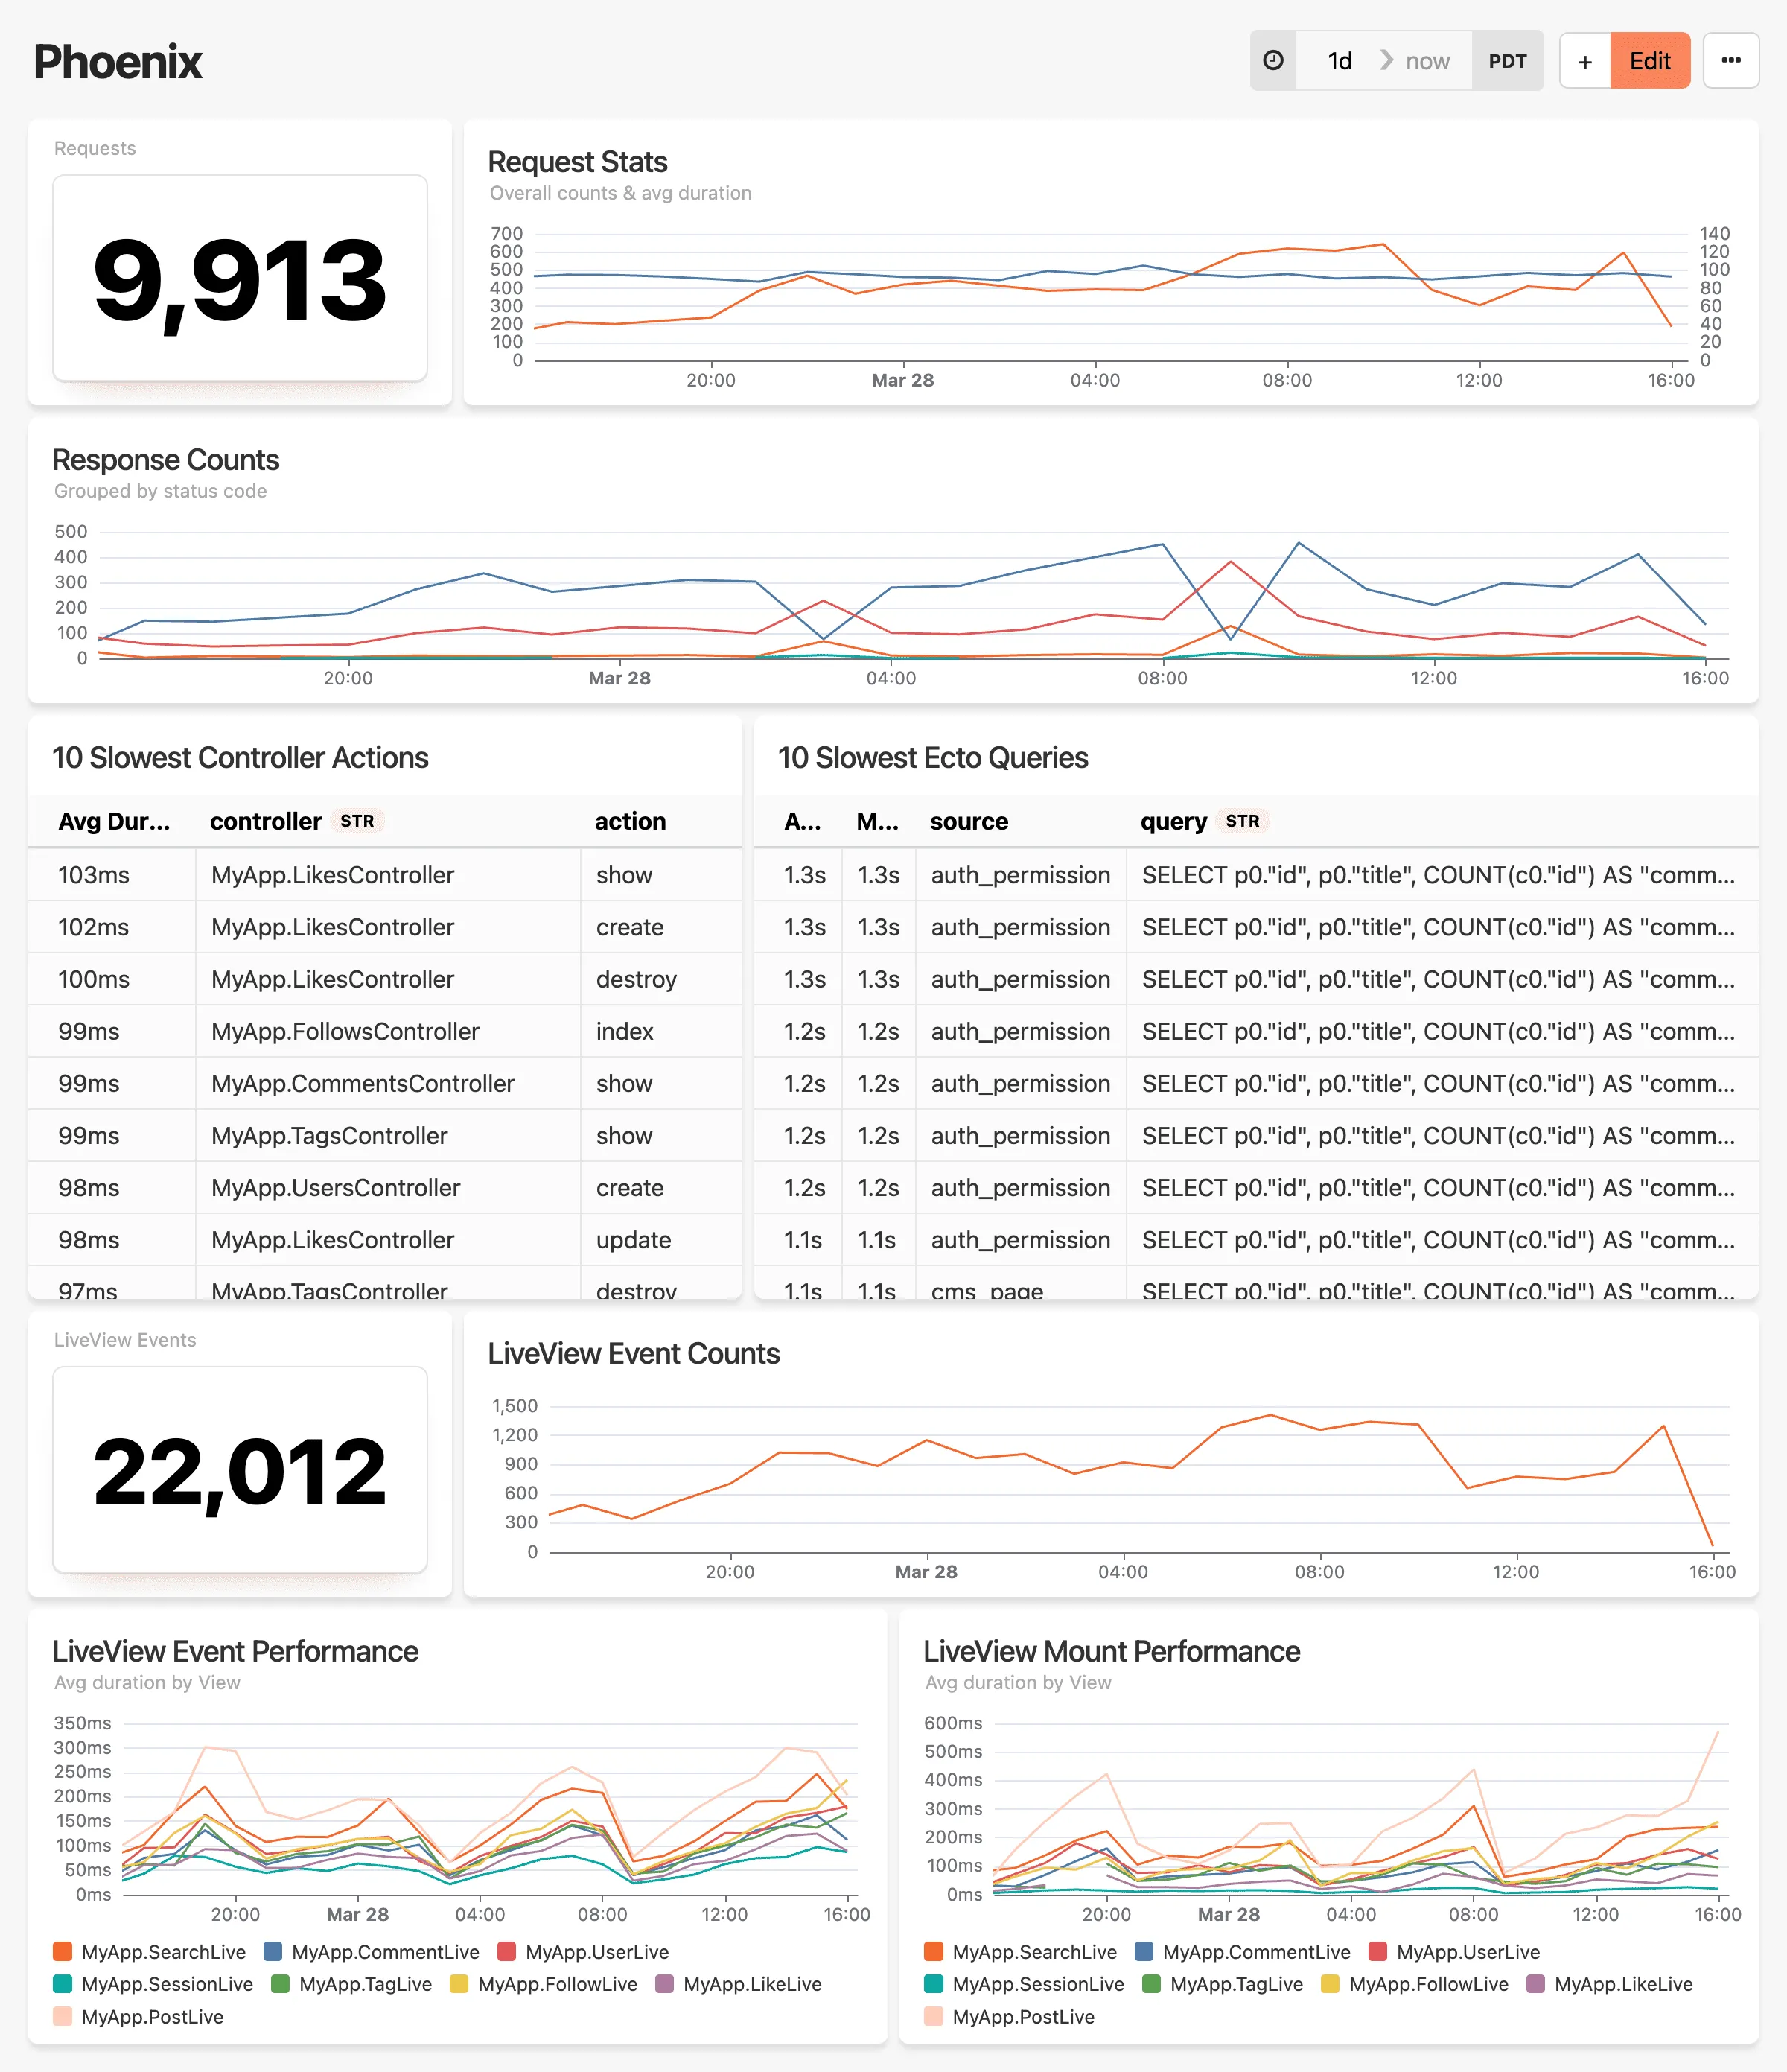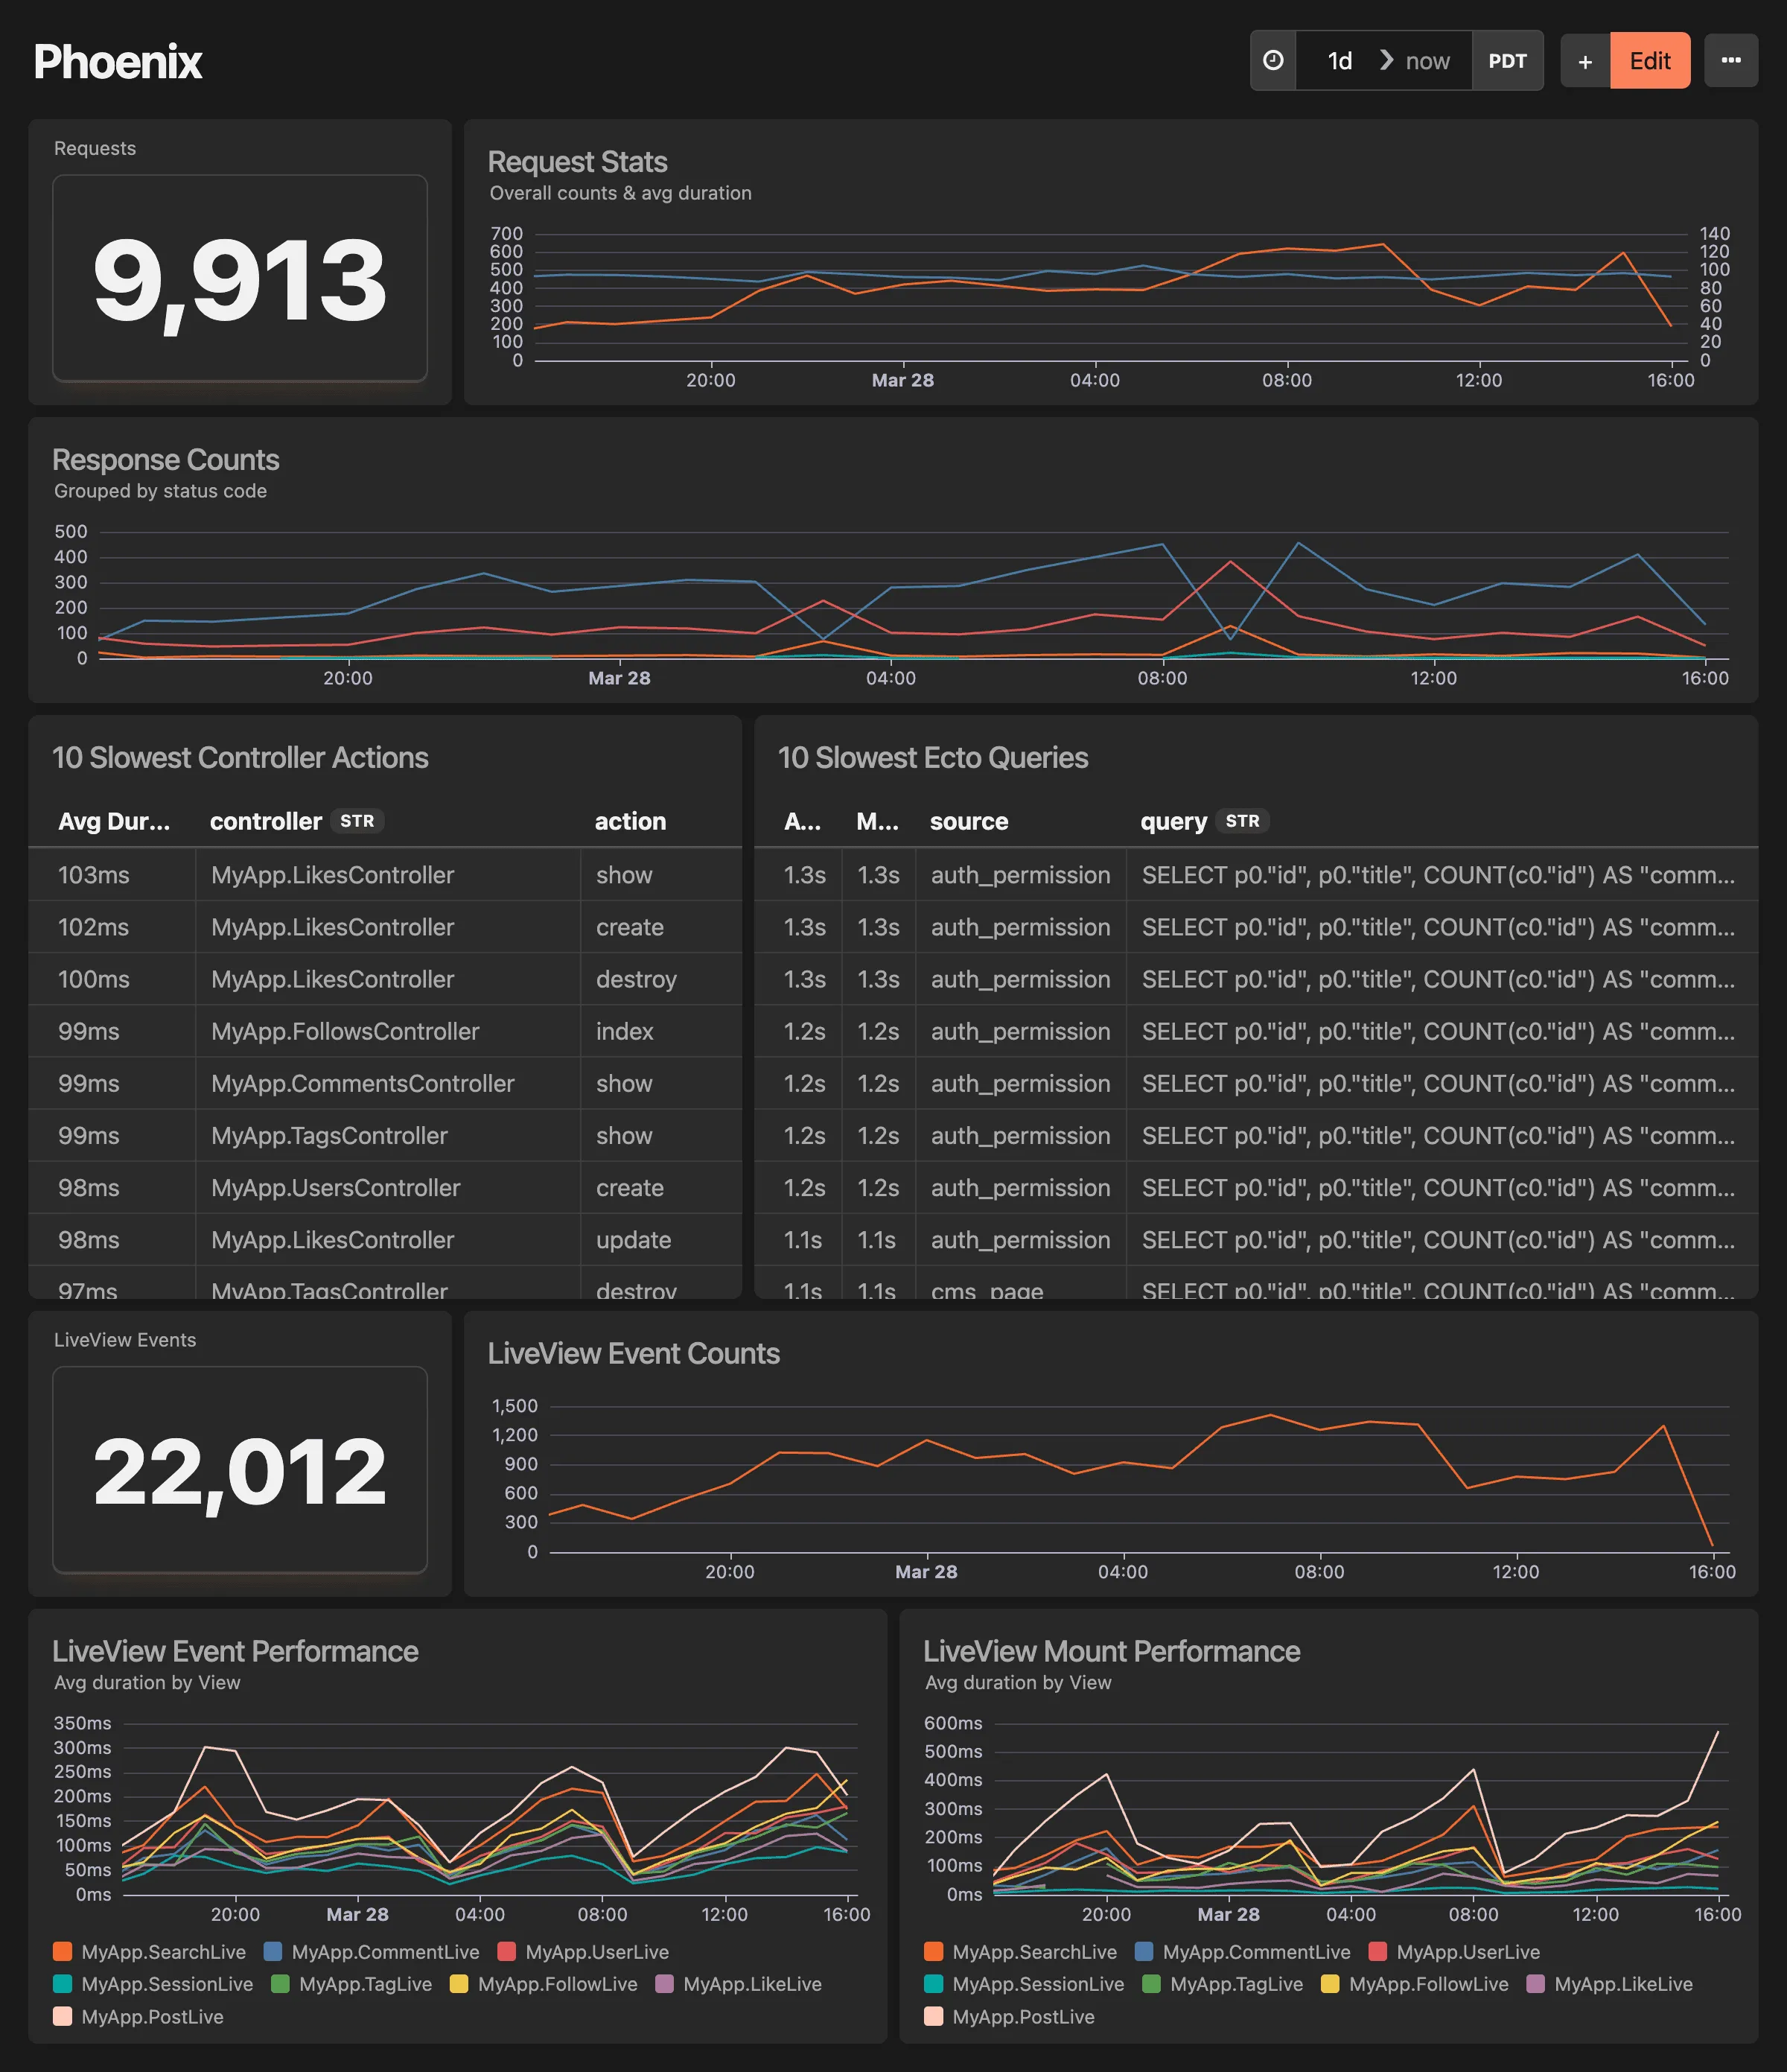
# Project Overview dashboard
> Monitor application health with the Project Overview dashboard, featuring alarms, deployments, errors, uptime checks, check-ins, and performance metrics.
The Project Overview dashboard provides a comprehensive view of your application’s health and is automatically added to every new Honeybadger project. **This dashboard includes:** * Alarms: Triggered and active alarms with recent check status * Deployments: Recent deployment activity * Errors: Top errors affecting your application * Uptime: Monitor status and response times * Check-ins: Health check status for critical services * Dynamic widgets (these may vary for your application): * Slowest Controller Actions: Performance bottlenecks * Response Status Codes: HTTP response trends * Database Query Performance: Query execution metrics 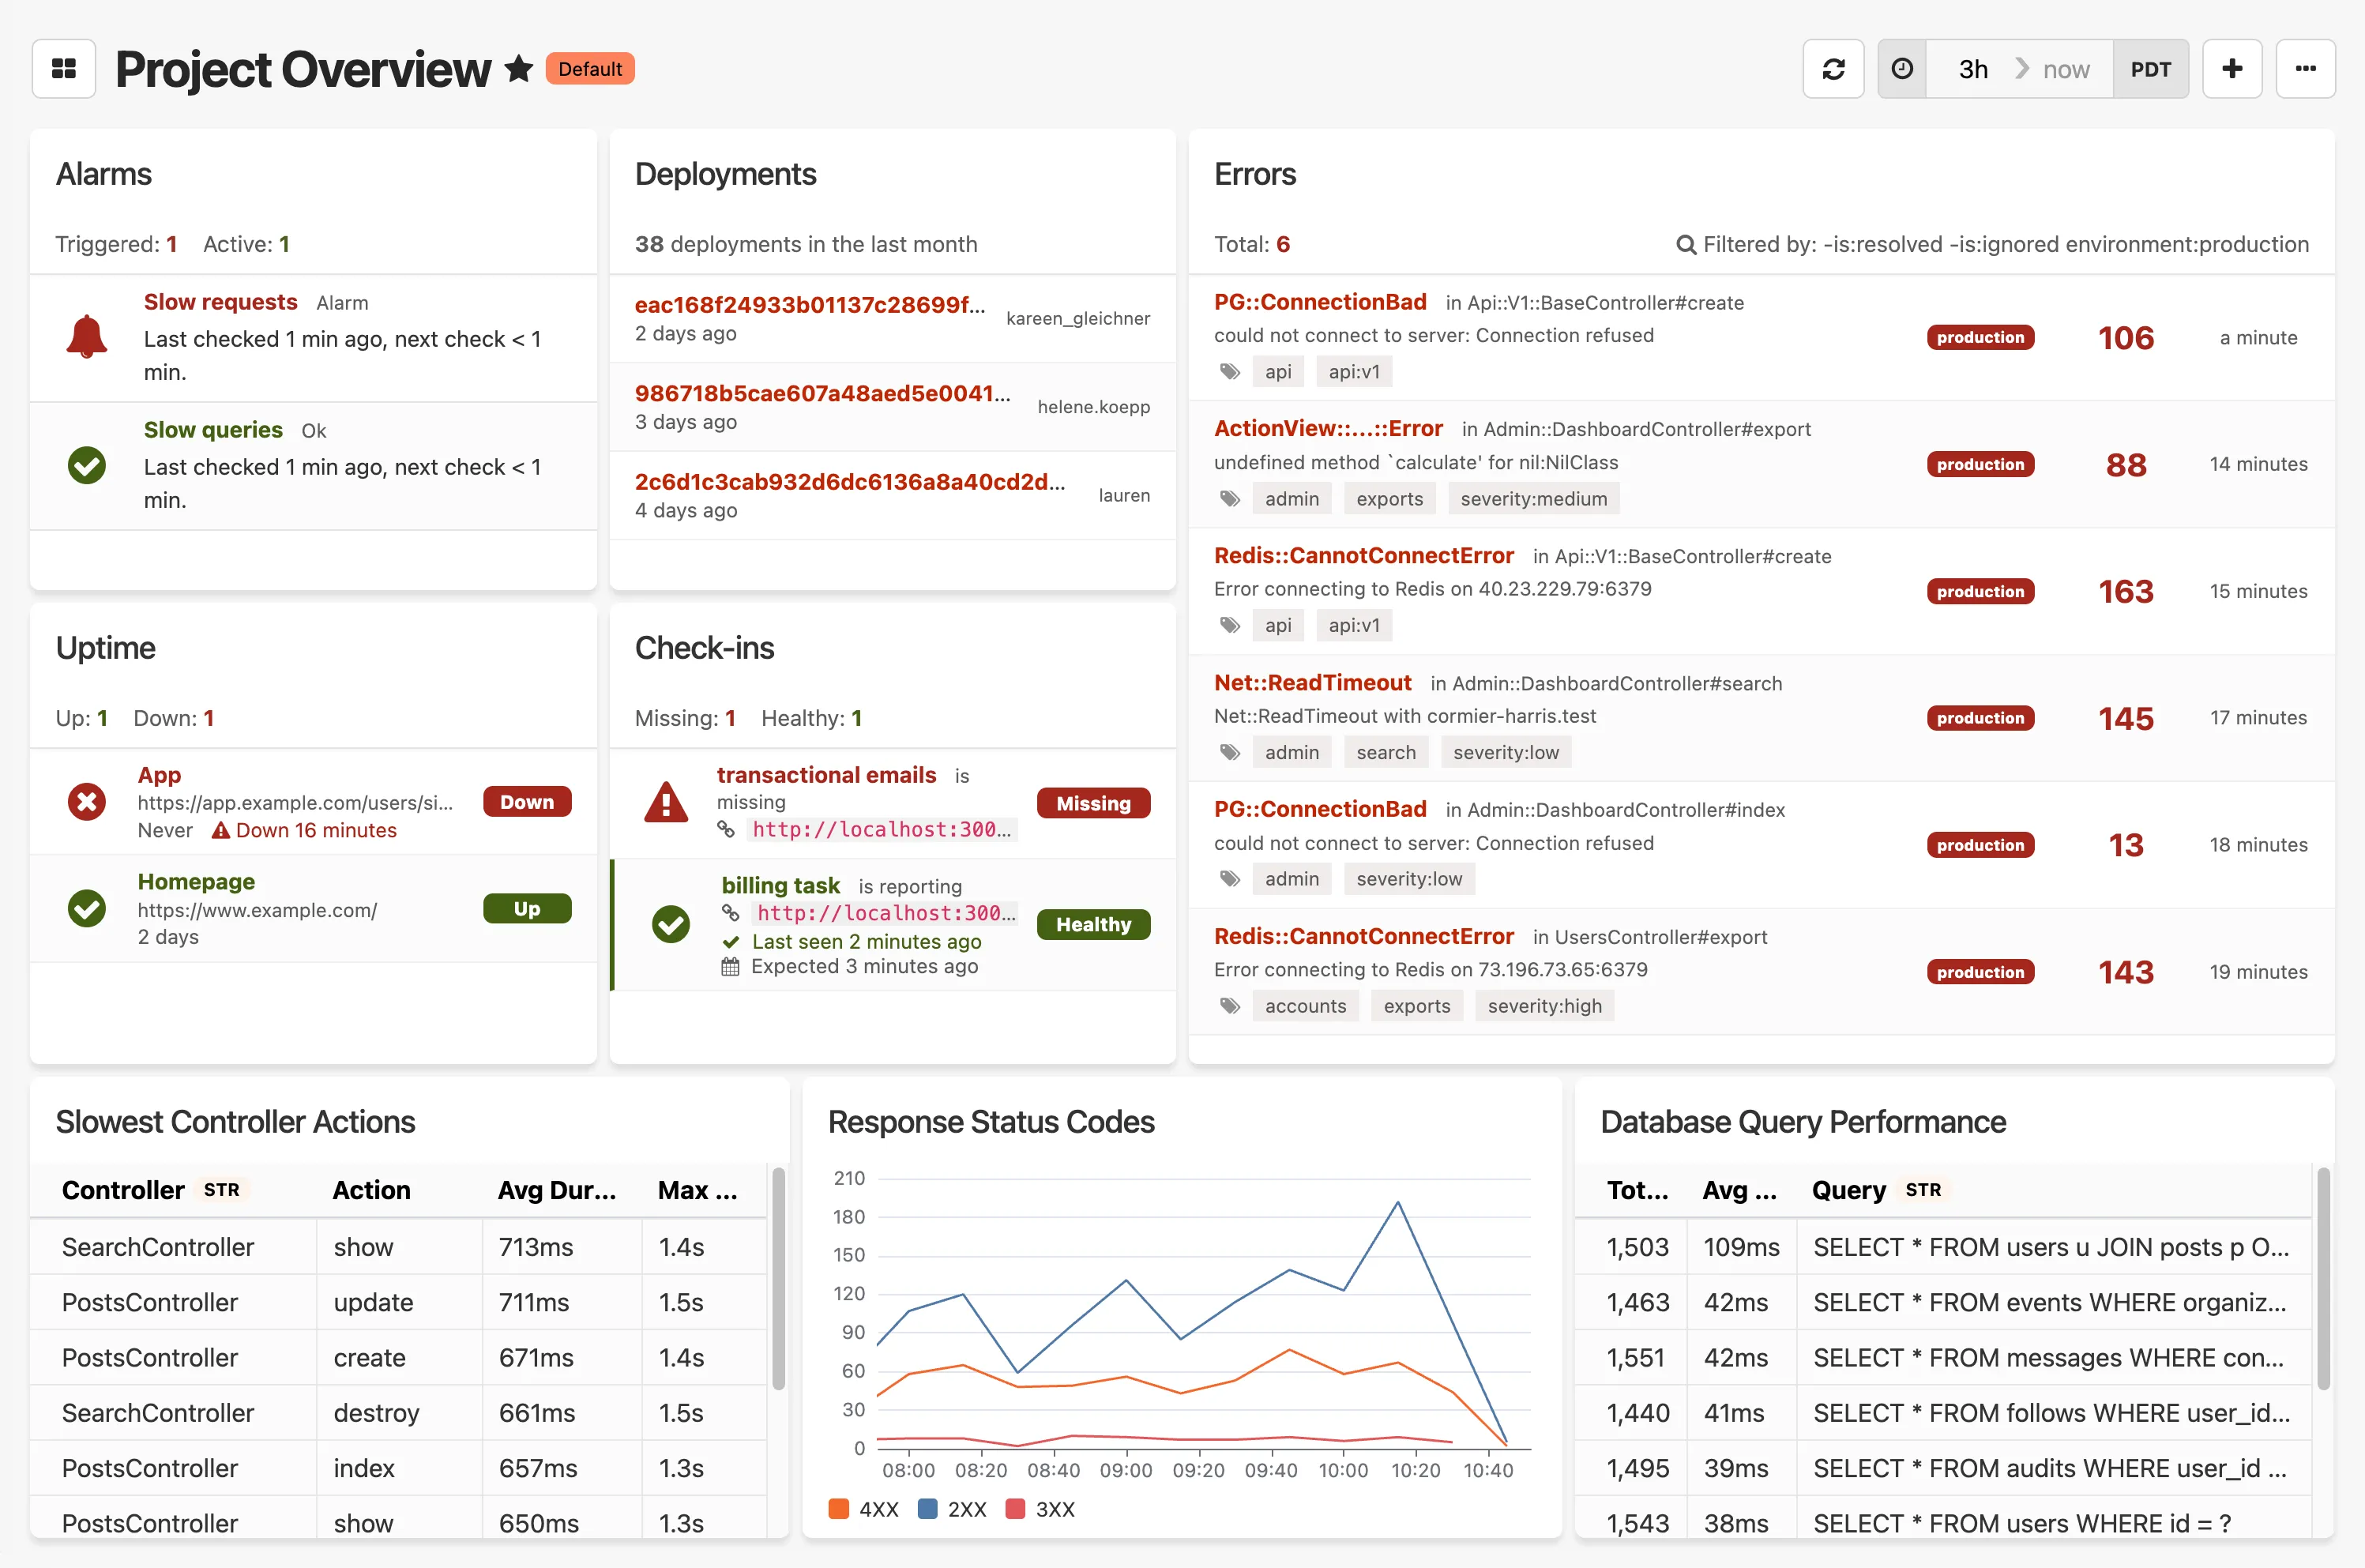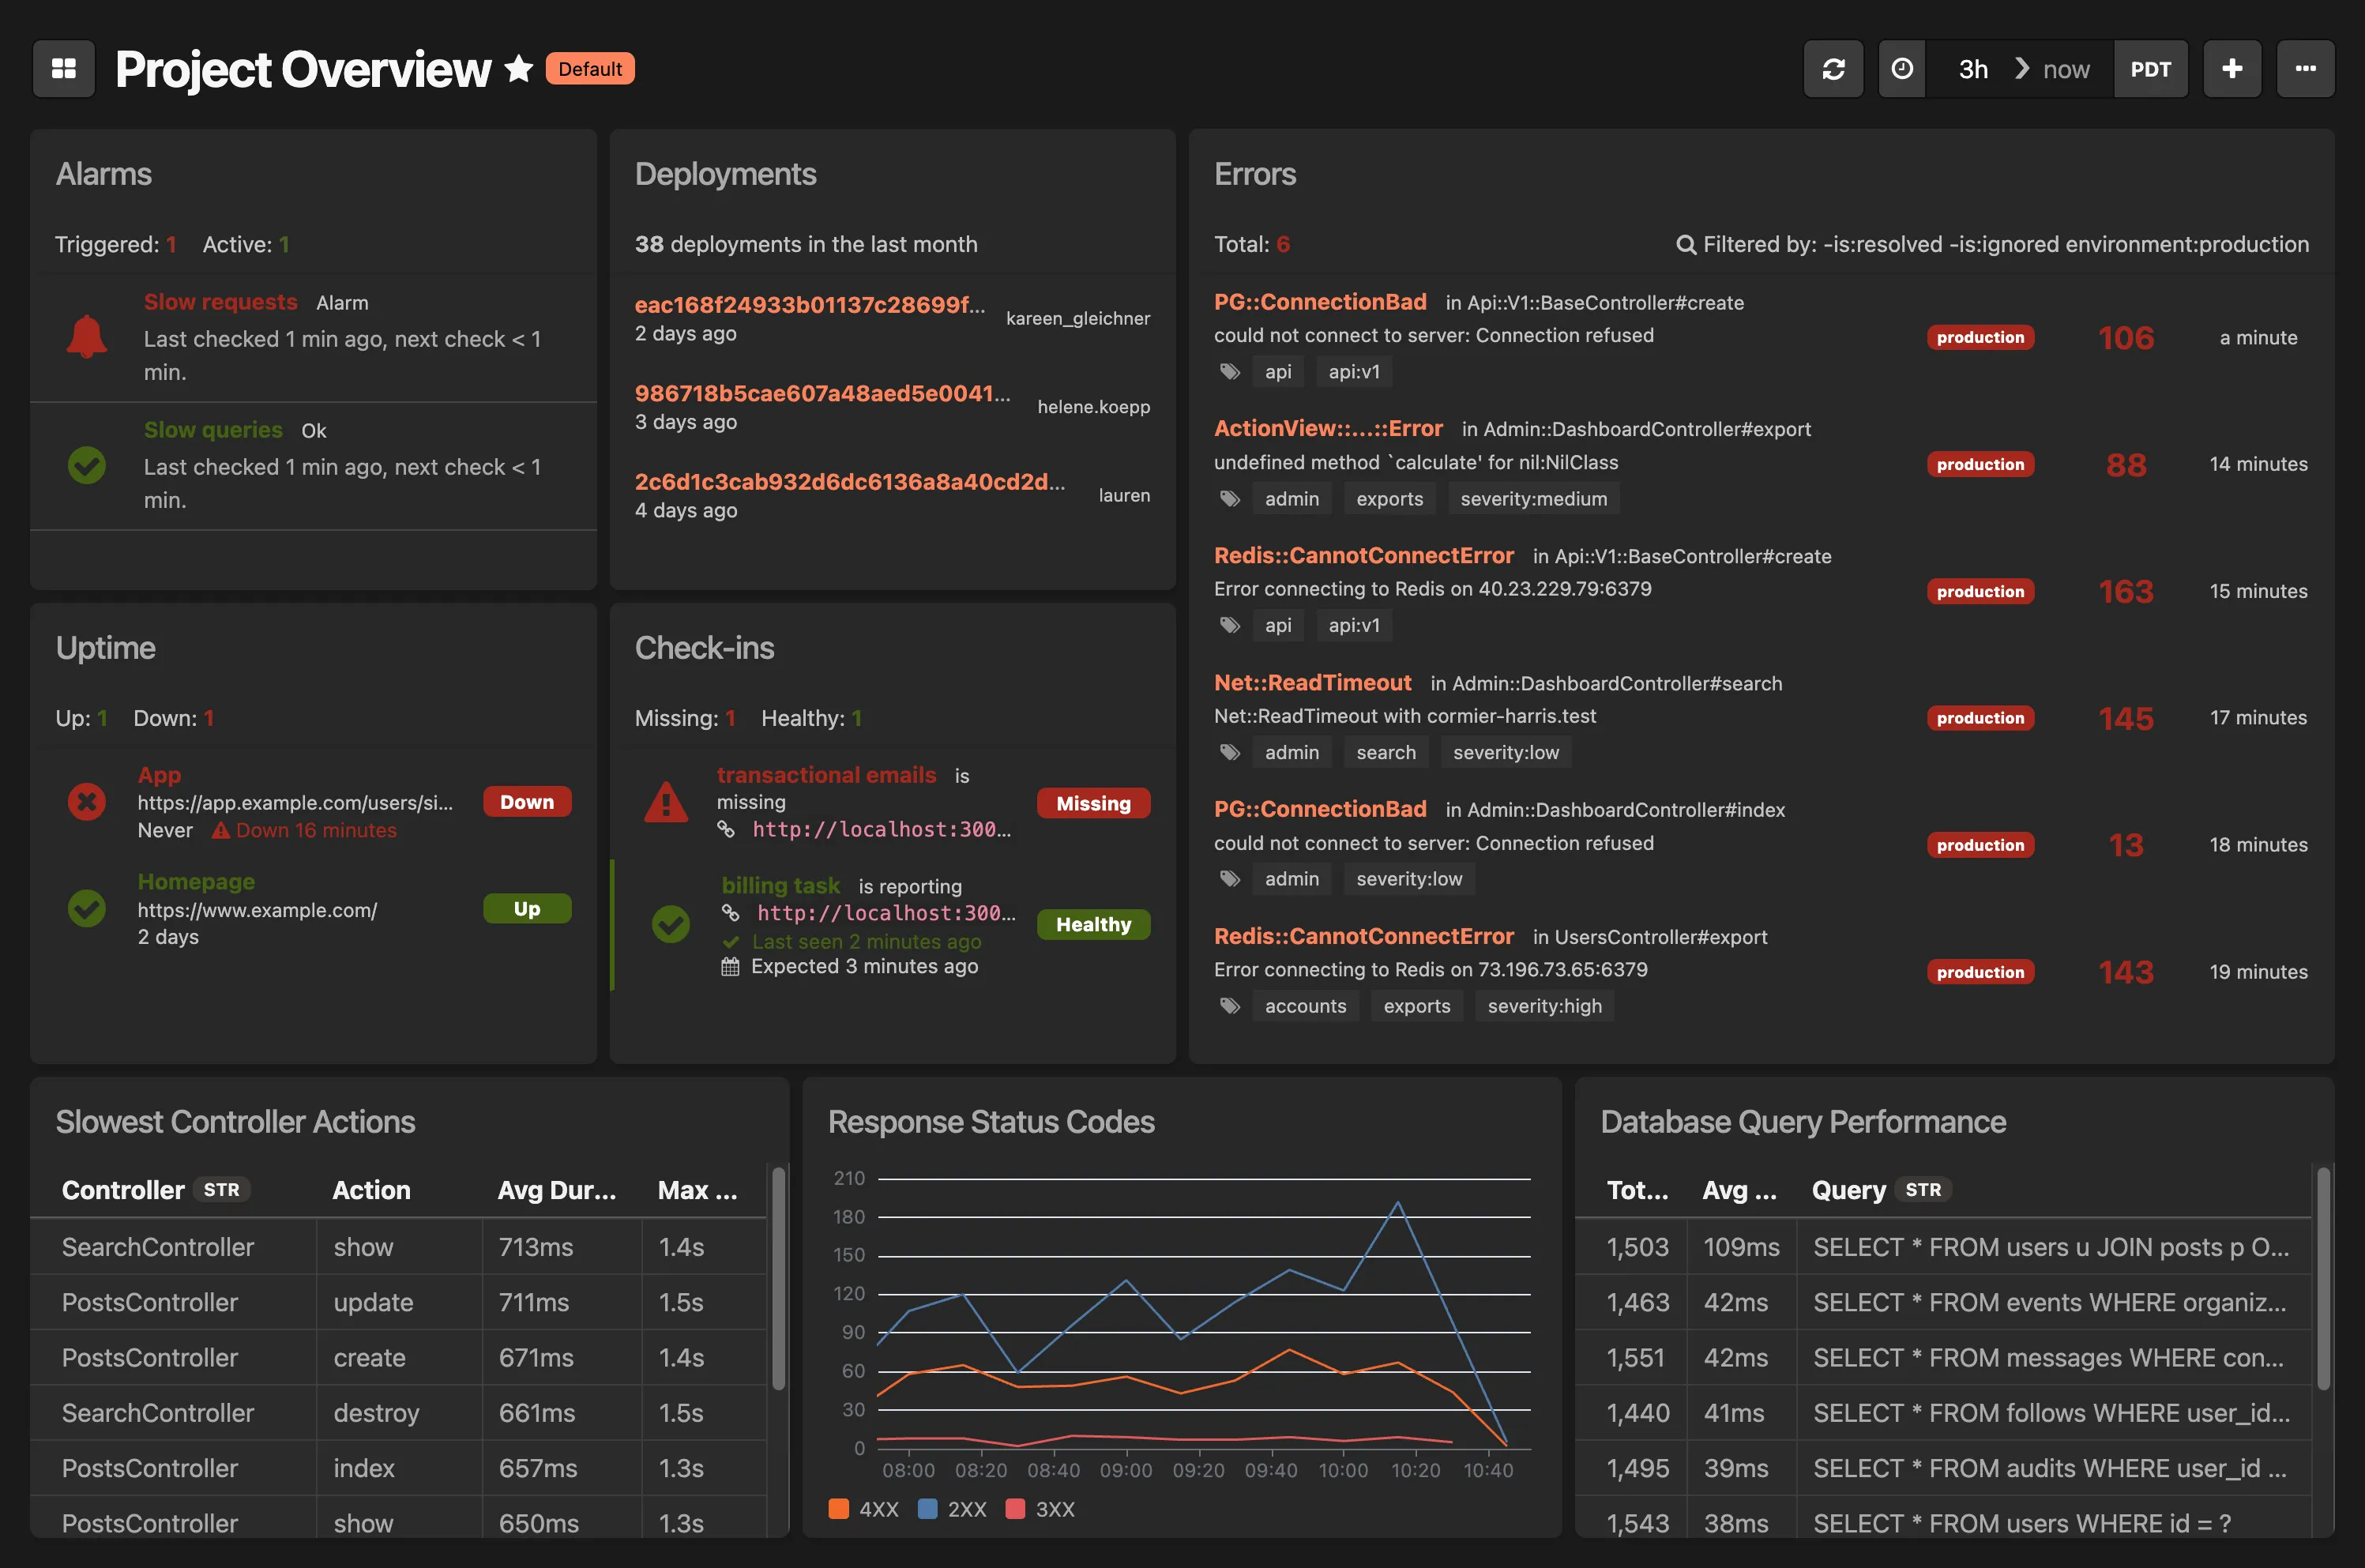
# Puma dashboard
> Request backlog, running threads, and pool capacity over time
Drop in Dashboard for your Puma instrumentation data **This dashboard includes:** * Total requests over time * Backlog over time * Running threads over time * Pool capacity over time To get started, make sure you have updated your Honeybadger gem to `>= 5.26`, then enable Insights instrumentation by including this in your `config/honeybadger.yml`:
```yaml
insights:
enabled: true
```
Check out the [Honeybadger client documentation](https://docs.honeybadger.io/lib/ruby/getting-started/sending-events-to-insights/) for more information. 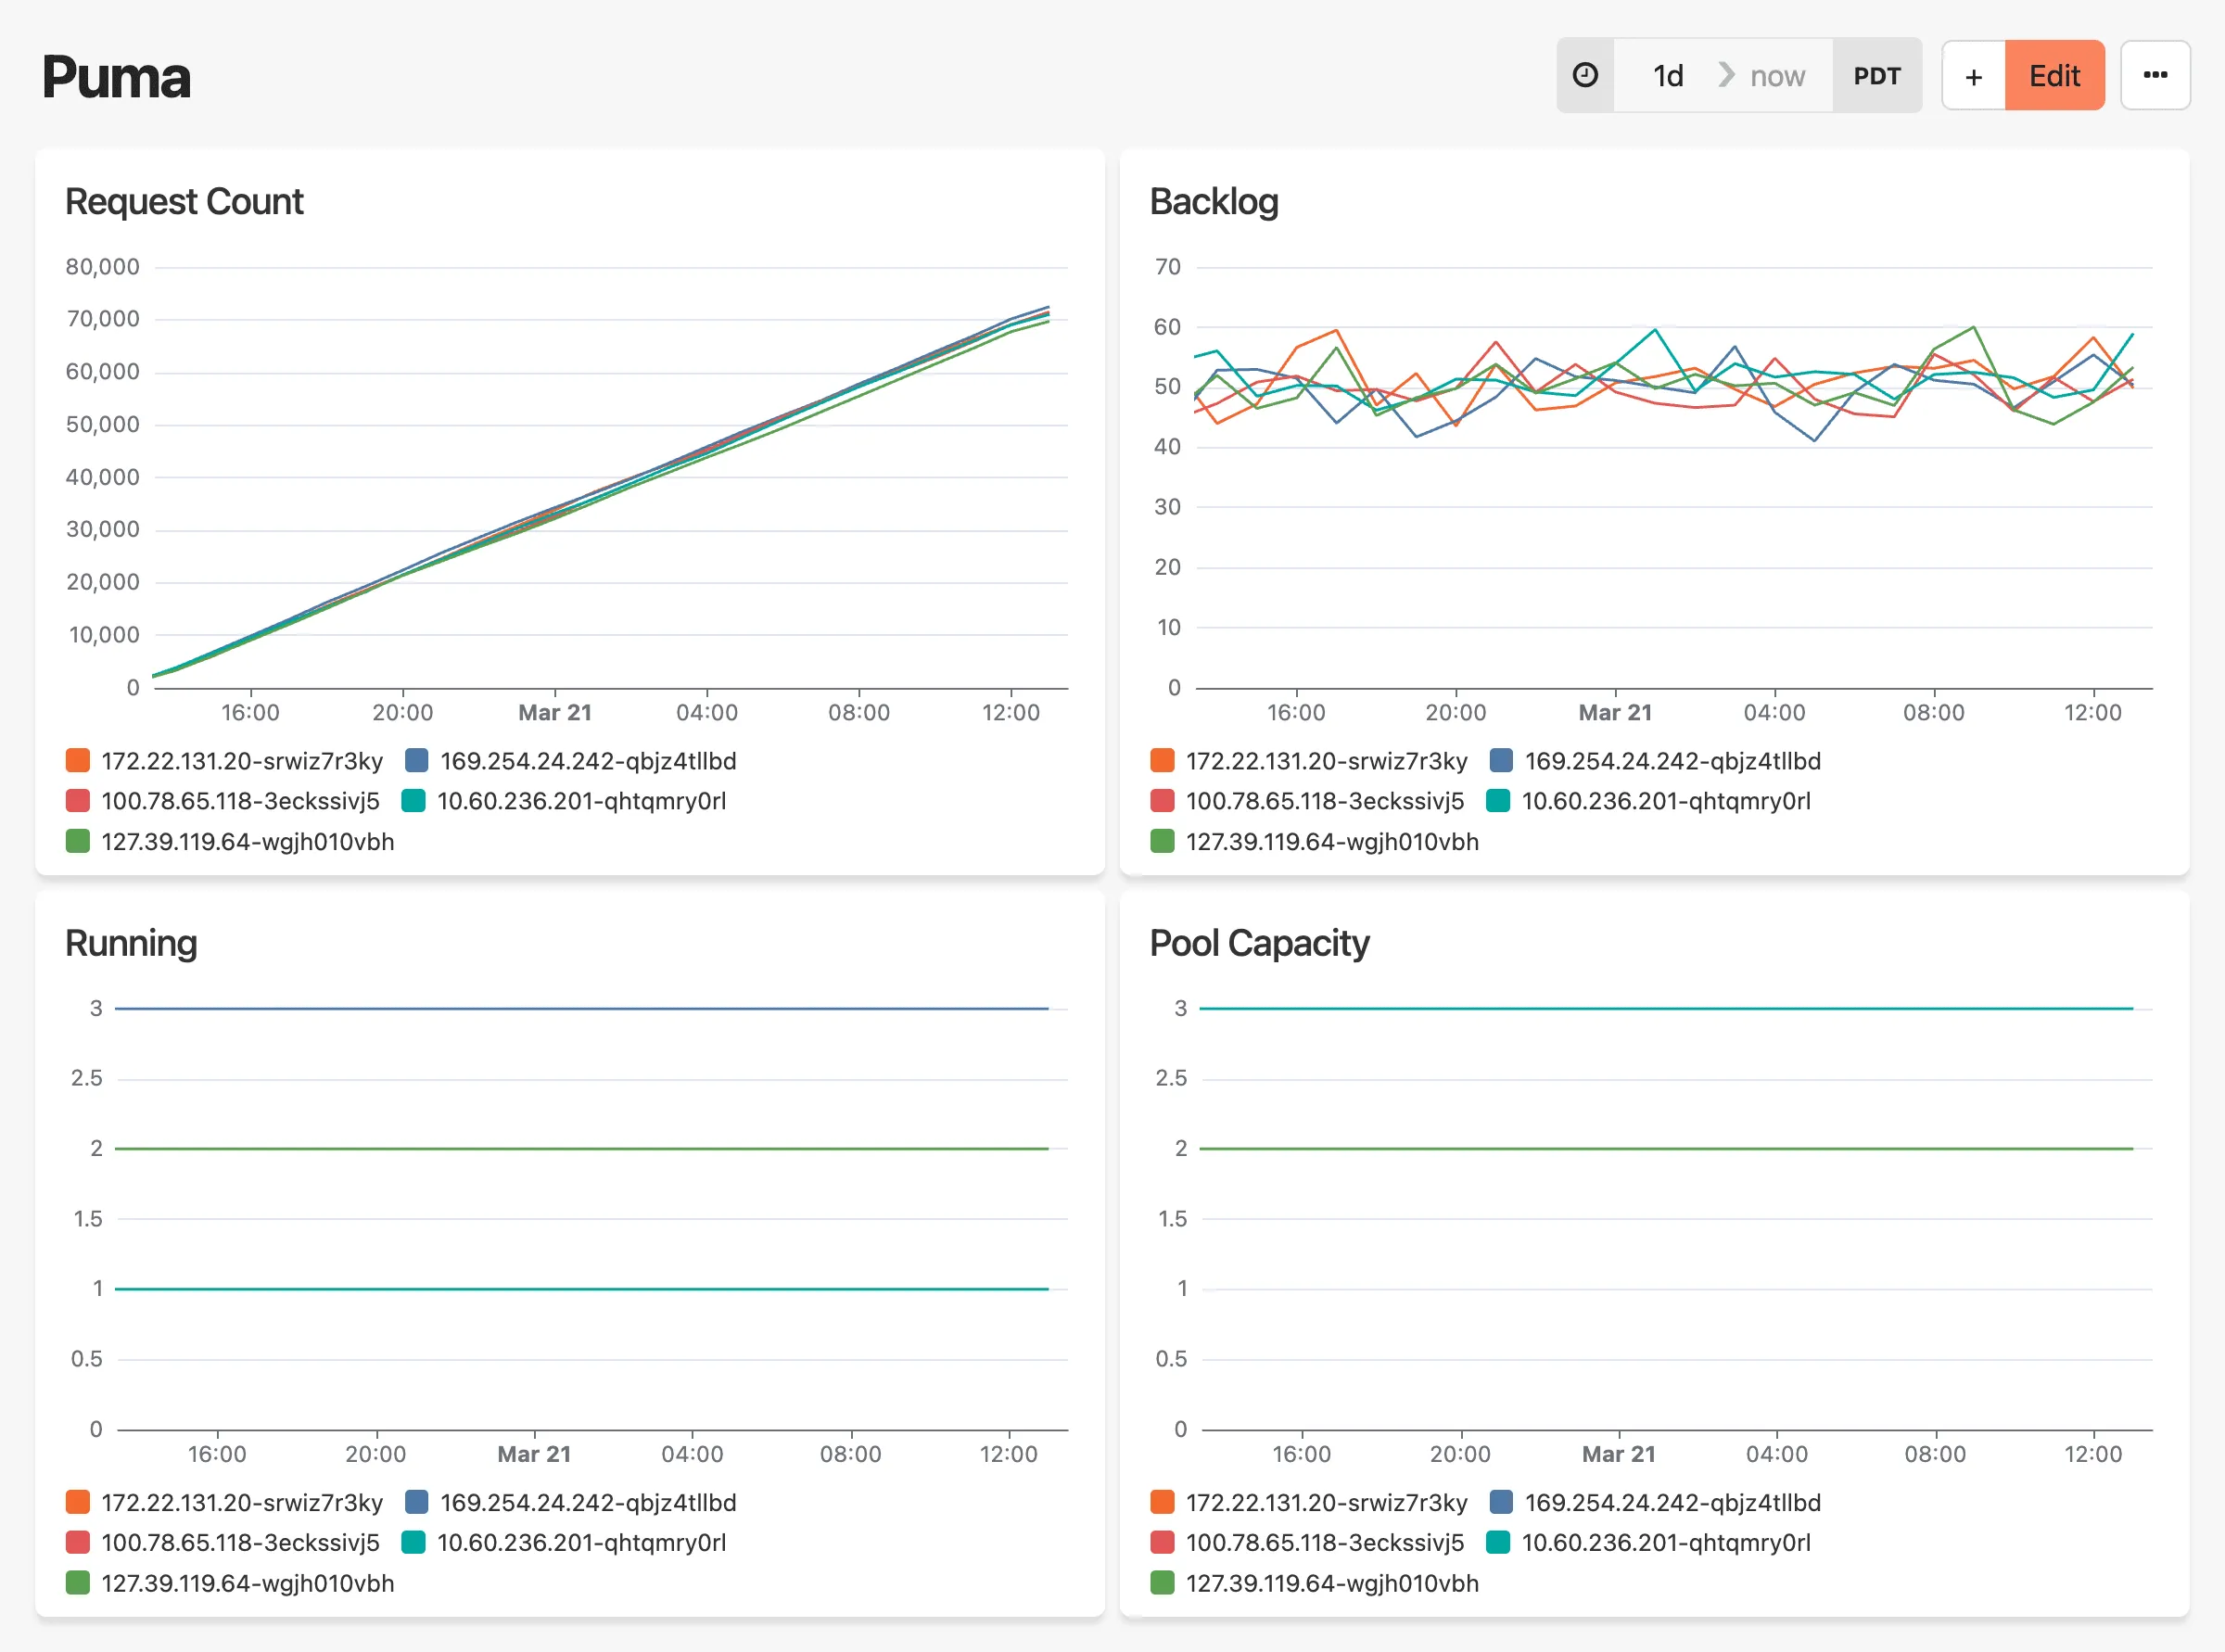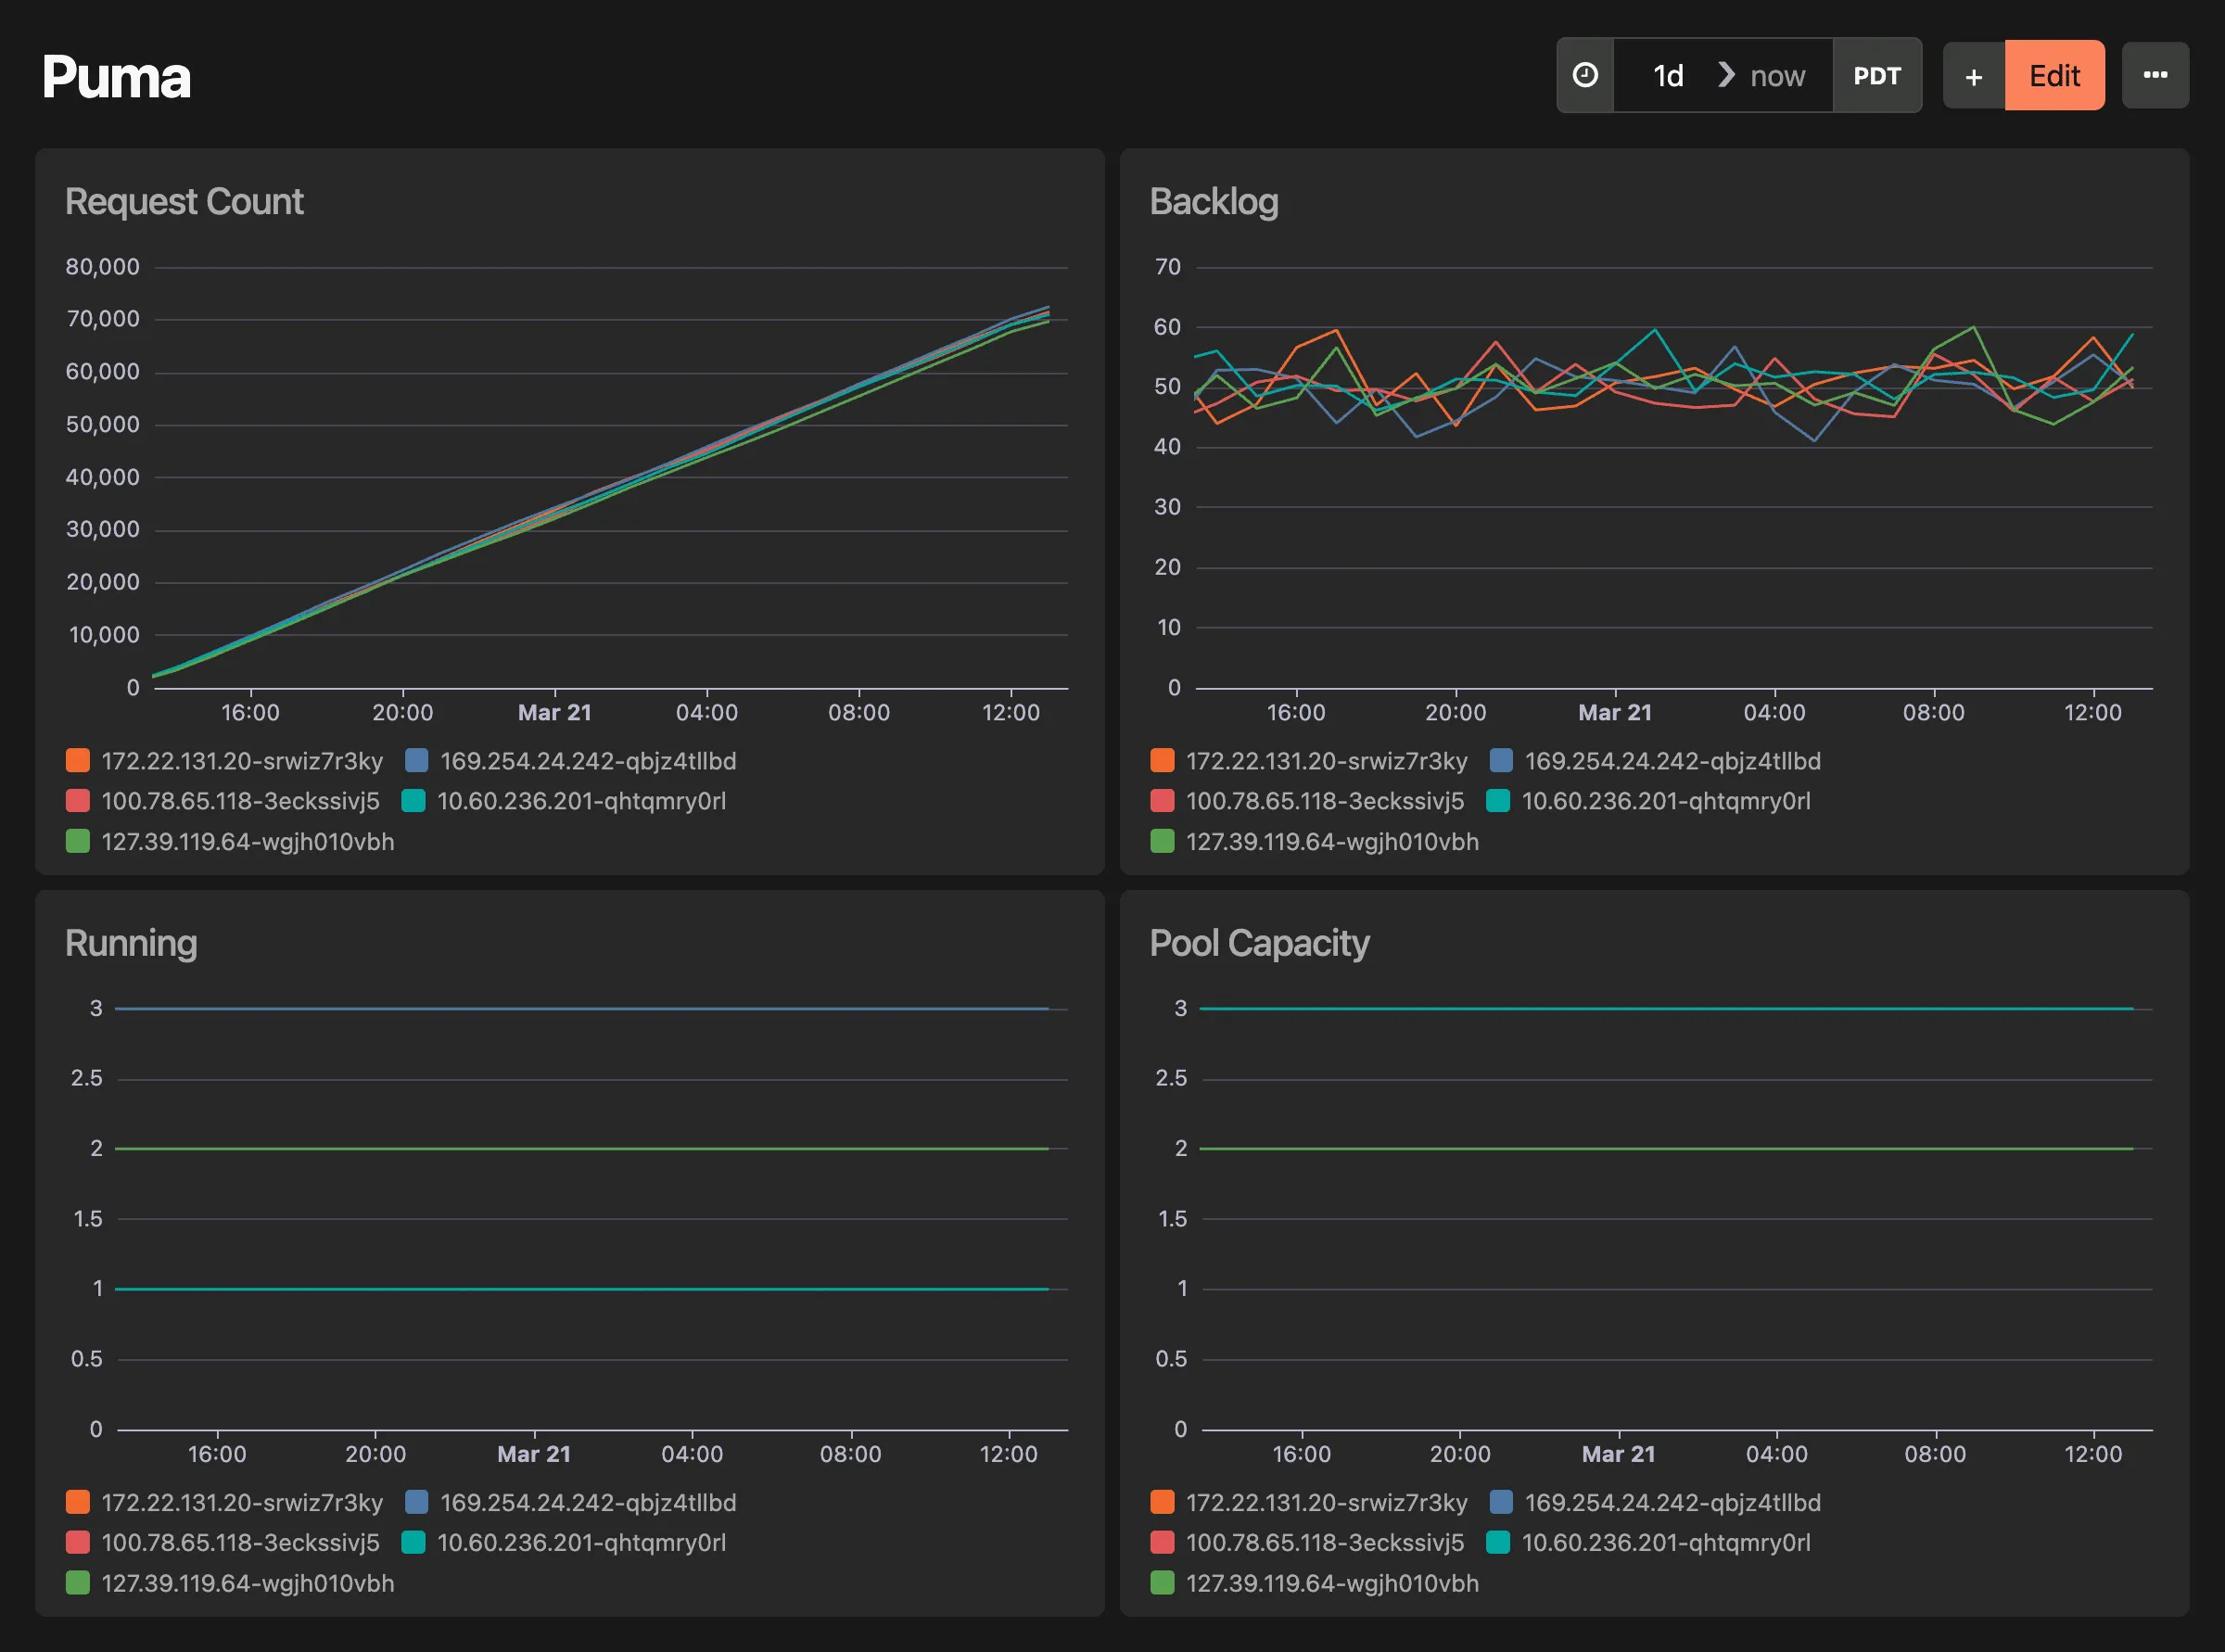
# Rails dashboard
> Slow requests, queries, and partials; cache hit rates by controller
Drop in Dashboard for your Rails instrumentation data **This dashboard includes:** * Total requests over time * Response distributions binned by 100ms * Controller durations & slowest controller actions * Slowest queries & slowest queries per request * Slowest partials * Cache hit rates To get started, make sure you have updated your Honeybadger gem to `>= 5.11`, then enable Insights instrumentation by including this in your `config/honeybadger.yml`:
```yaml
insights:
enabled: true
```
Check out the [Honeybadger client documentation](https://docs.honeybadger.io/lib/ruby/getting-started/sending-events-to-insights/) for more information. 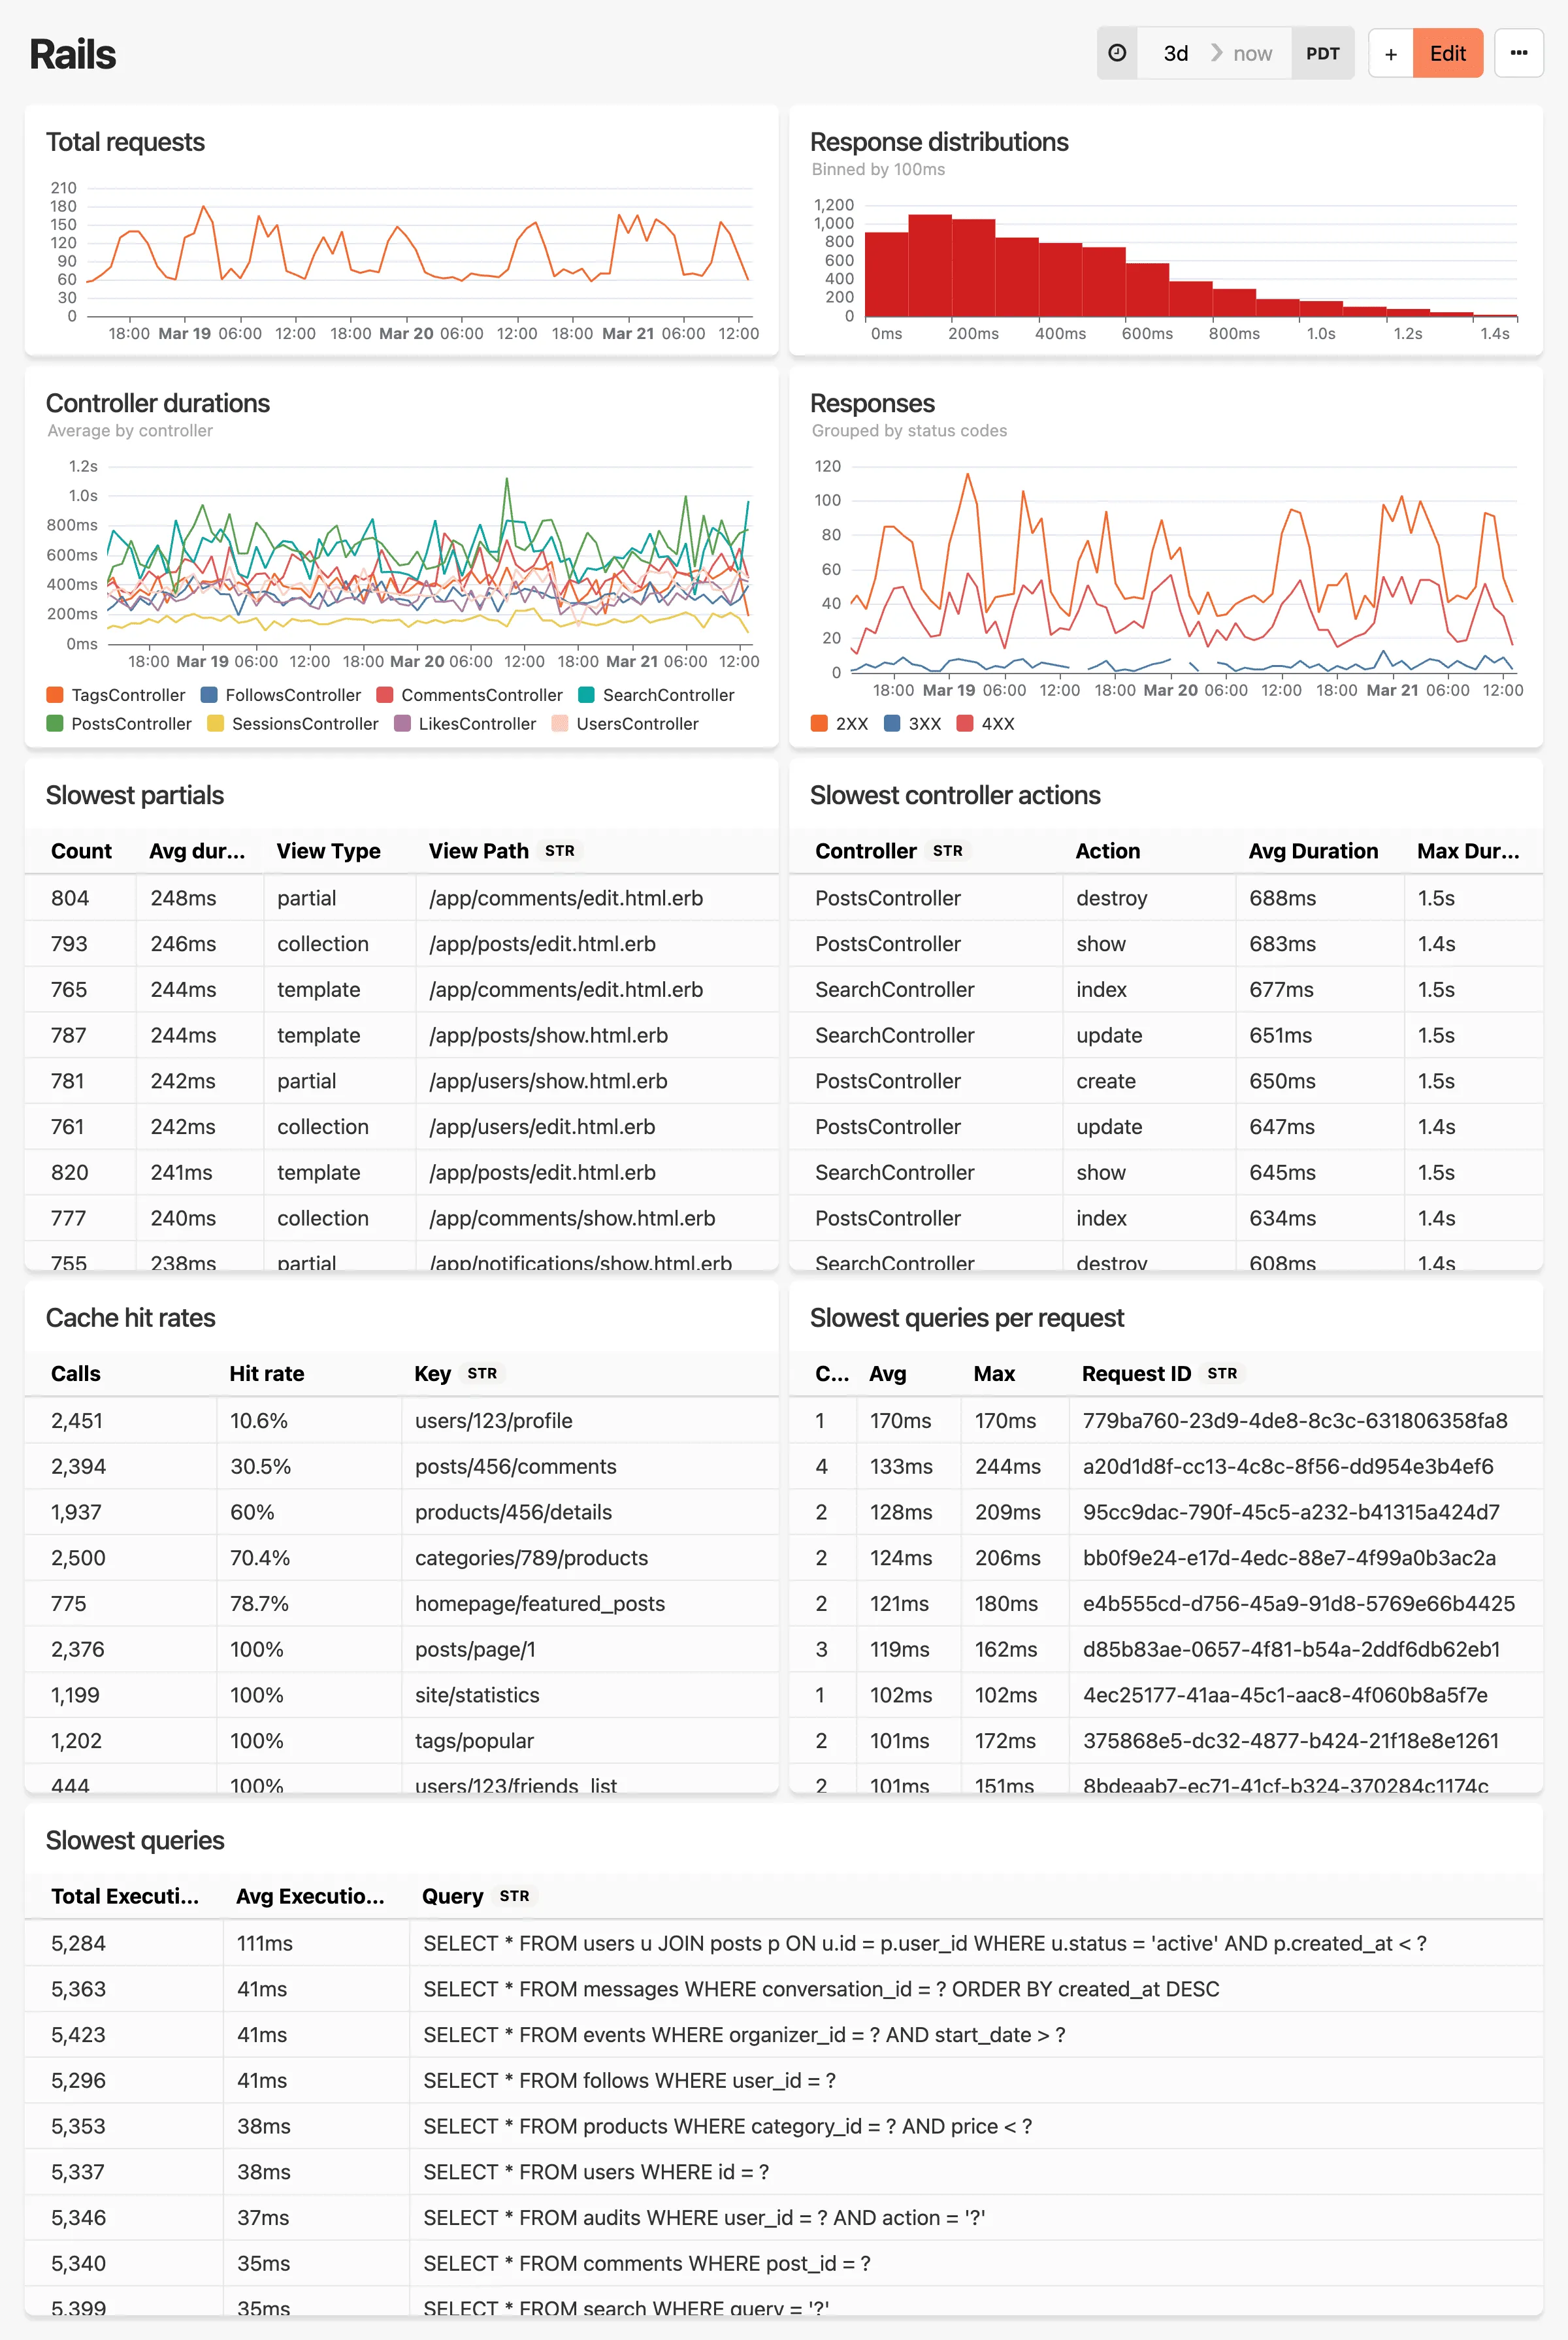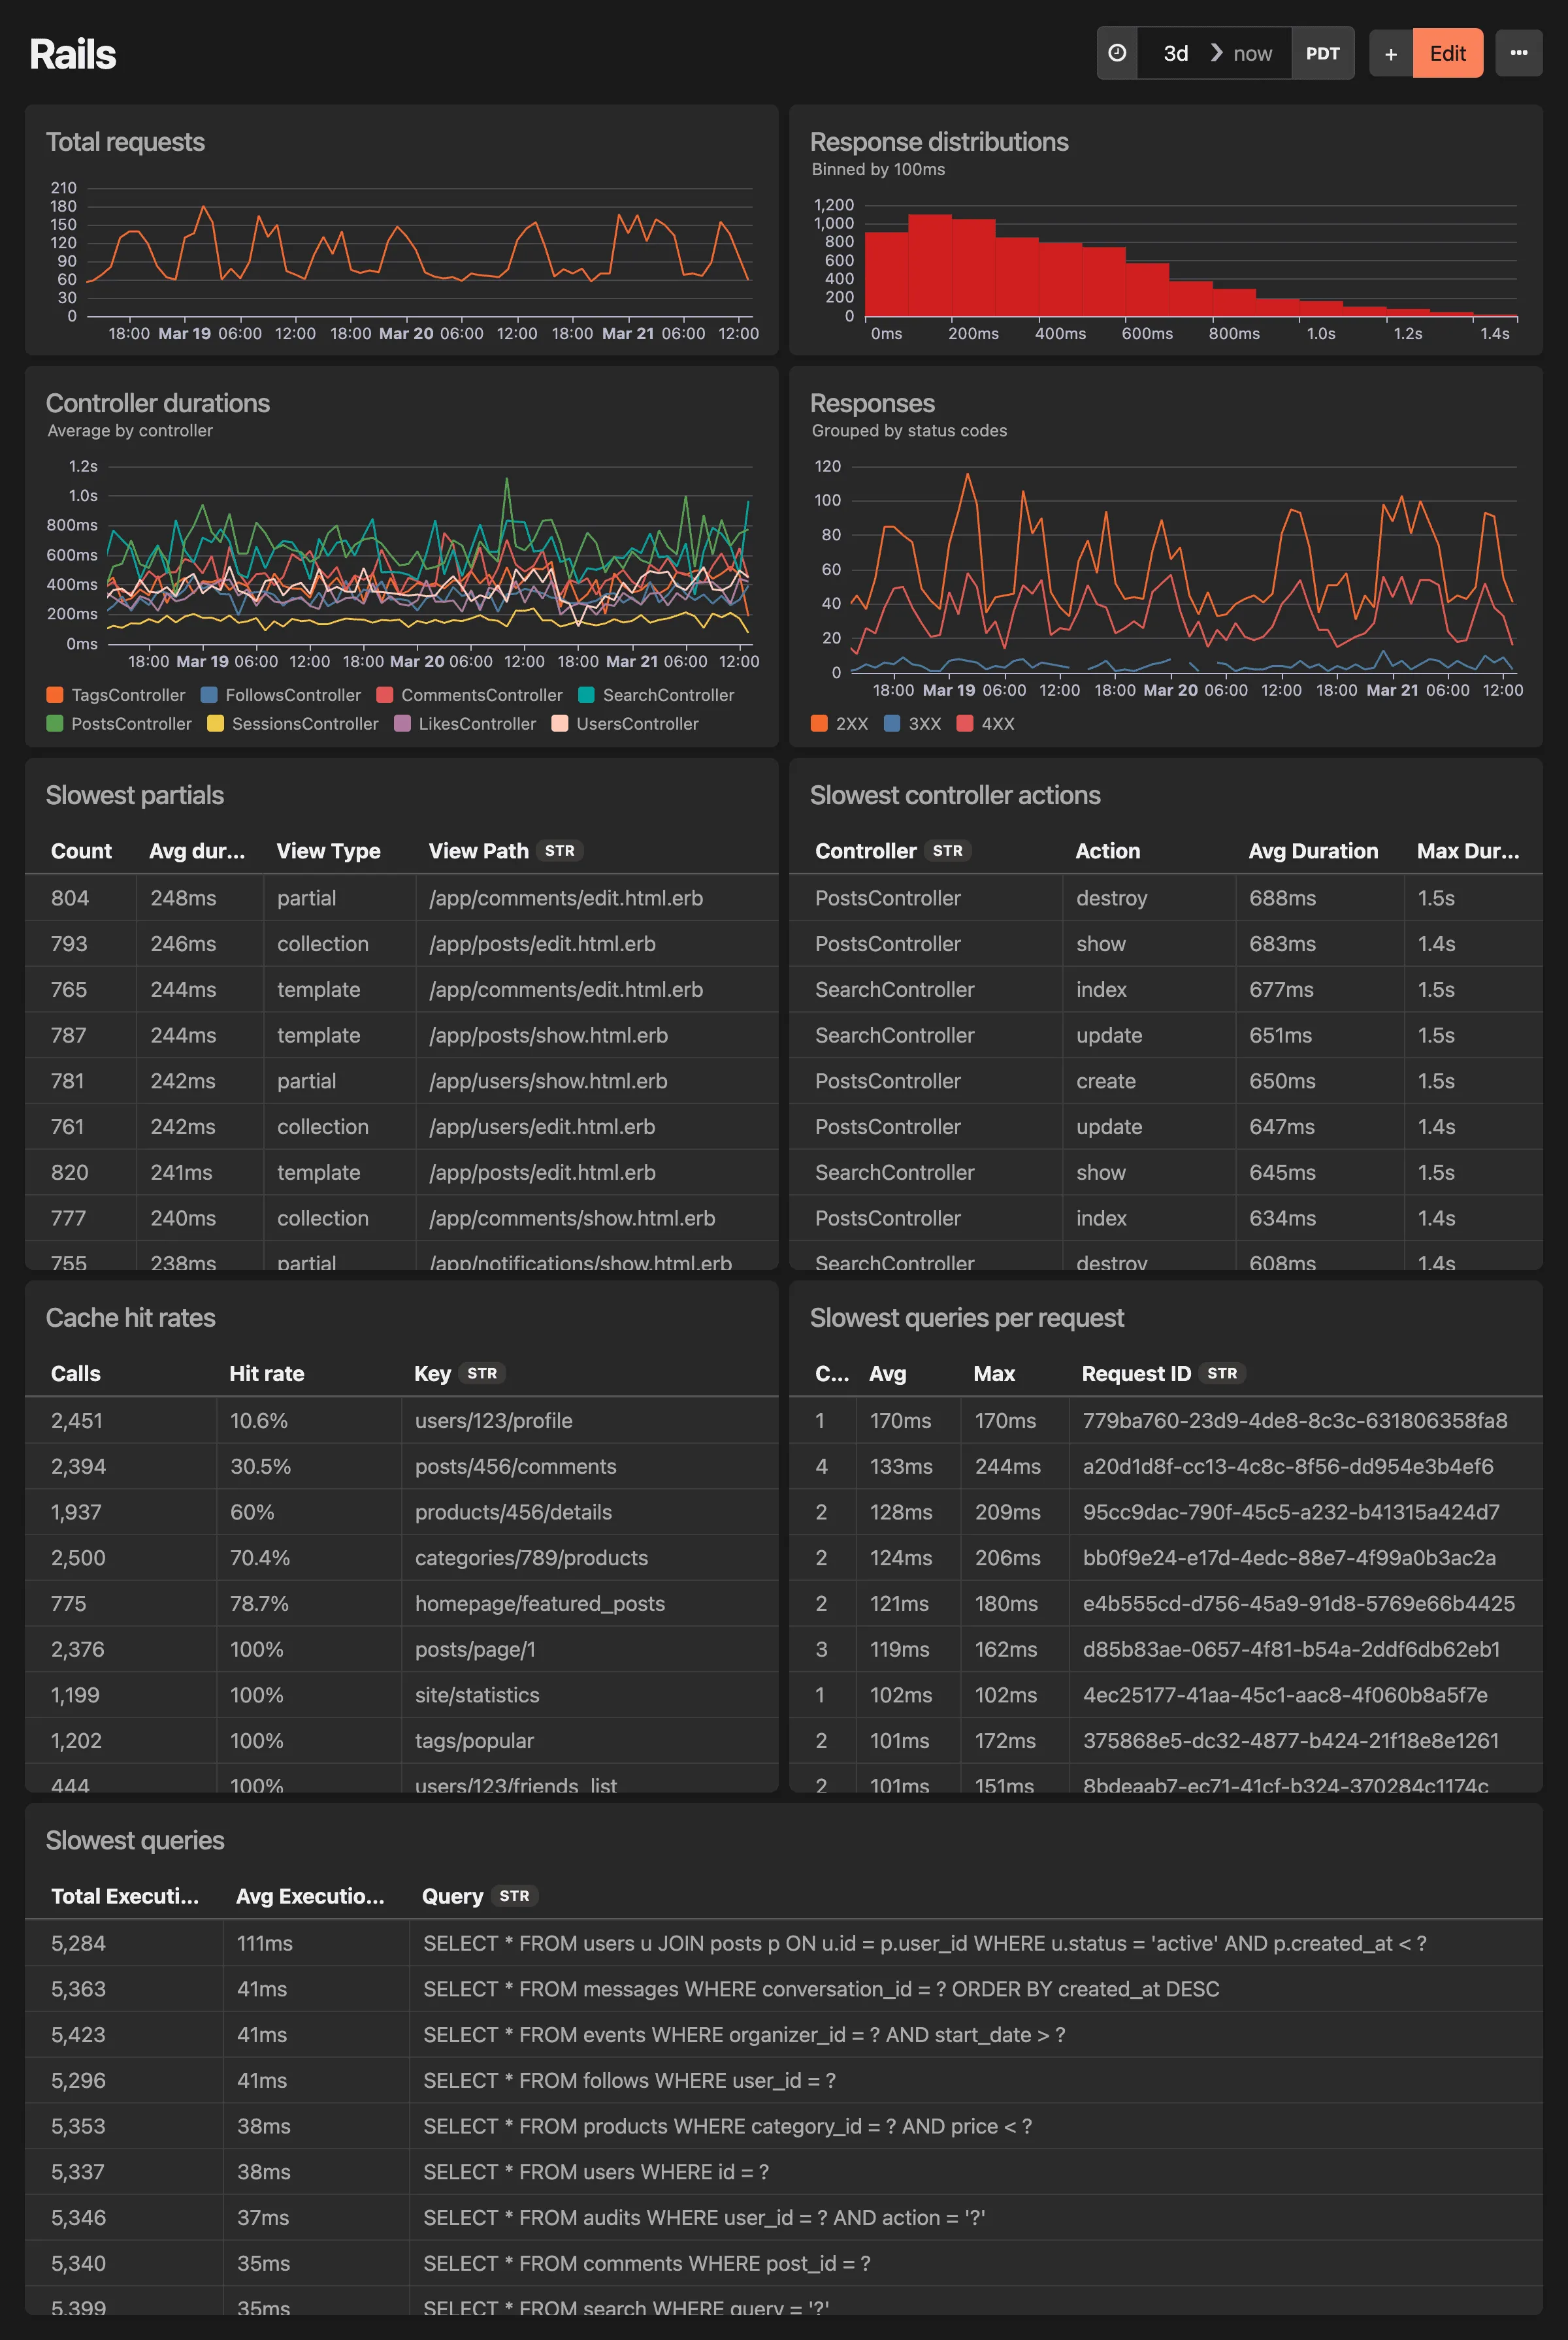
# Rails Metrics dashboard
> Pre-aggregated throughput, controller durations, and DB/view timings
Drop in Dashboard for your Rails metrics data This is the metrics-based counterpart to the Rails (events) dashboard. Use this if you’ve enabled metrics without events, or if you prefer pre-aggregated metric data. **This dashboard includes:** * Request throughput over time * Controller durations (weighted average) * Responses grouped by status code * Slowest controller actions * DB & View runtime breakdown * SQL query durations * Cache operation durations To get started, make sure you have updated your Honeybadger gem to `>= 5.11`, then enable Insights metrics by including this in your `config/honeybadger.yml`:
```yaml
insights:
enabled: true
rails:
insights:
metrics: true
```
Check out the [Honeybadger client documentation](https://docs.honeybadger.io/lib/ruby/getting-started/sending-events-to-insights/) for more information. 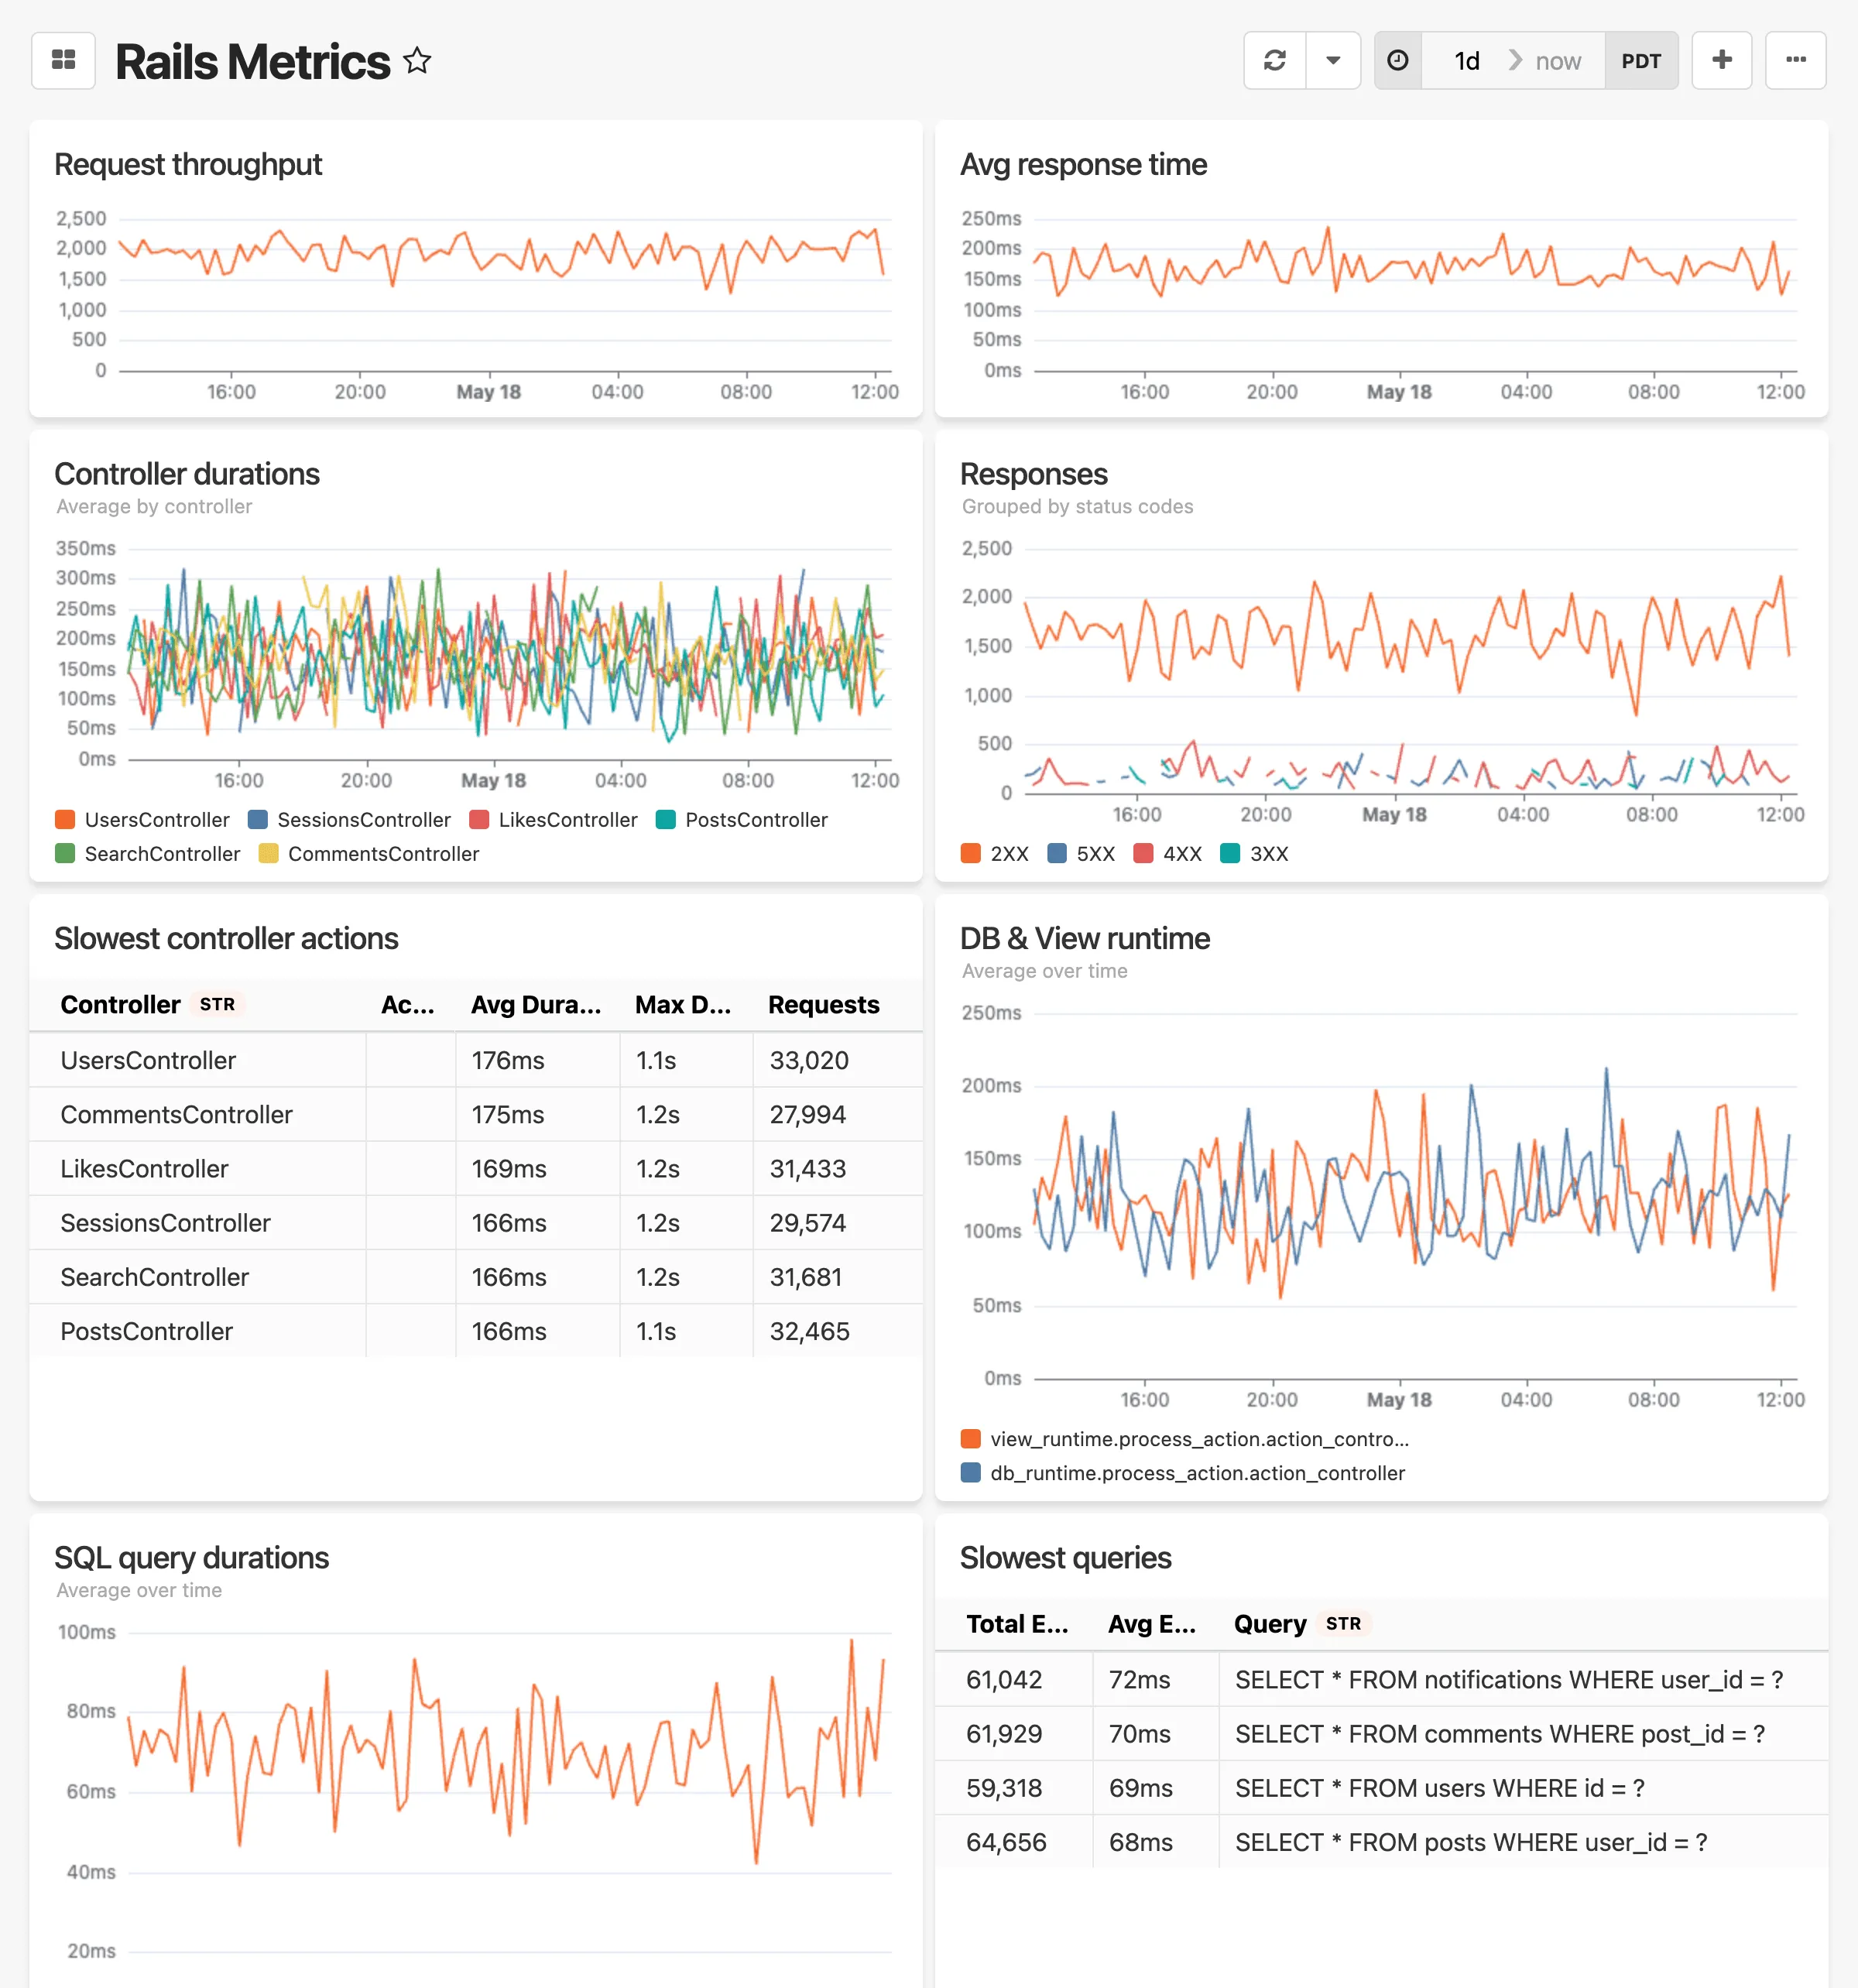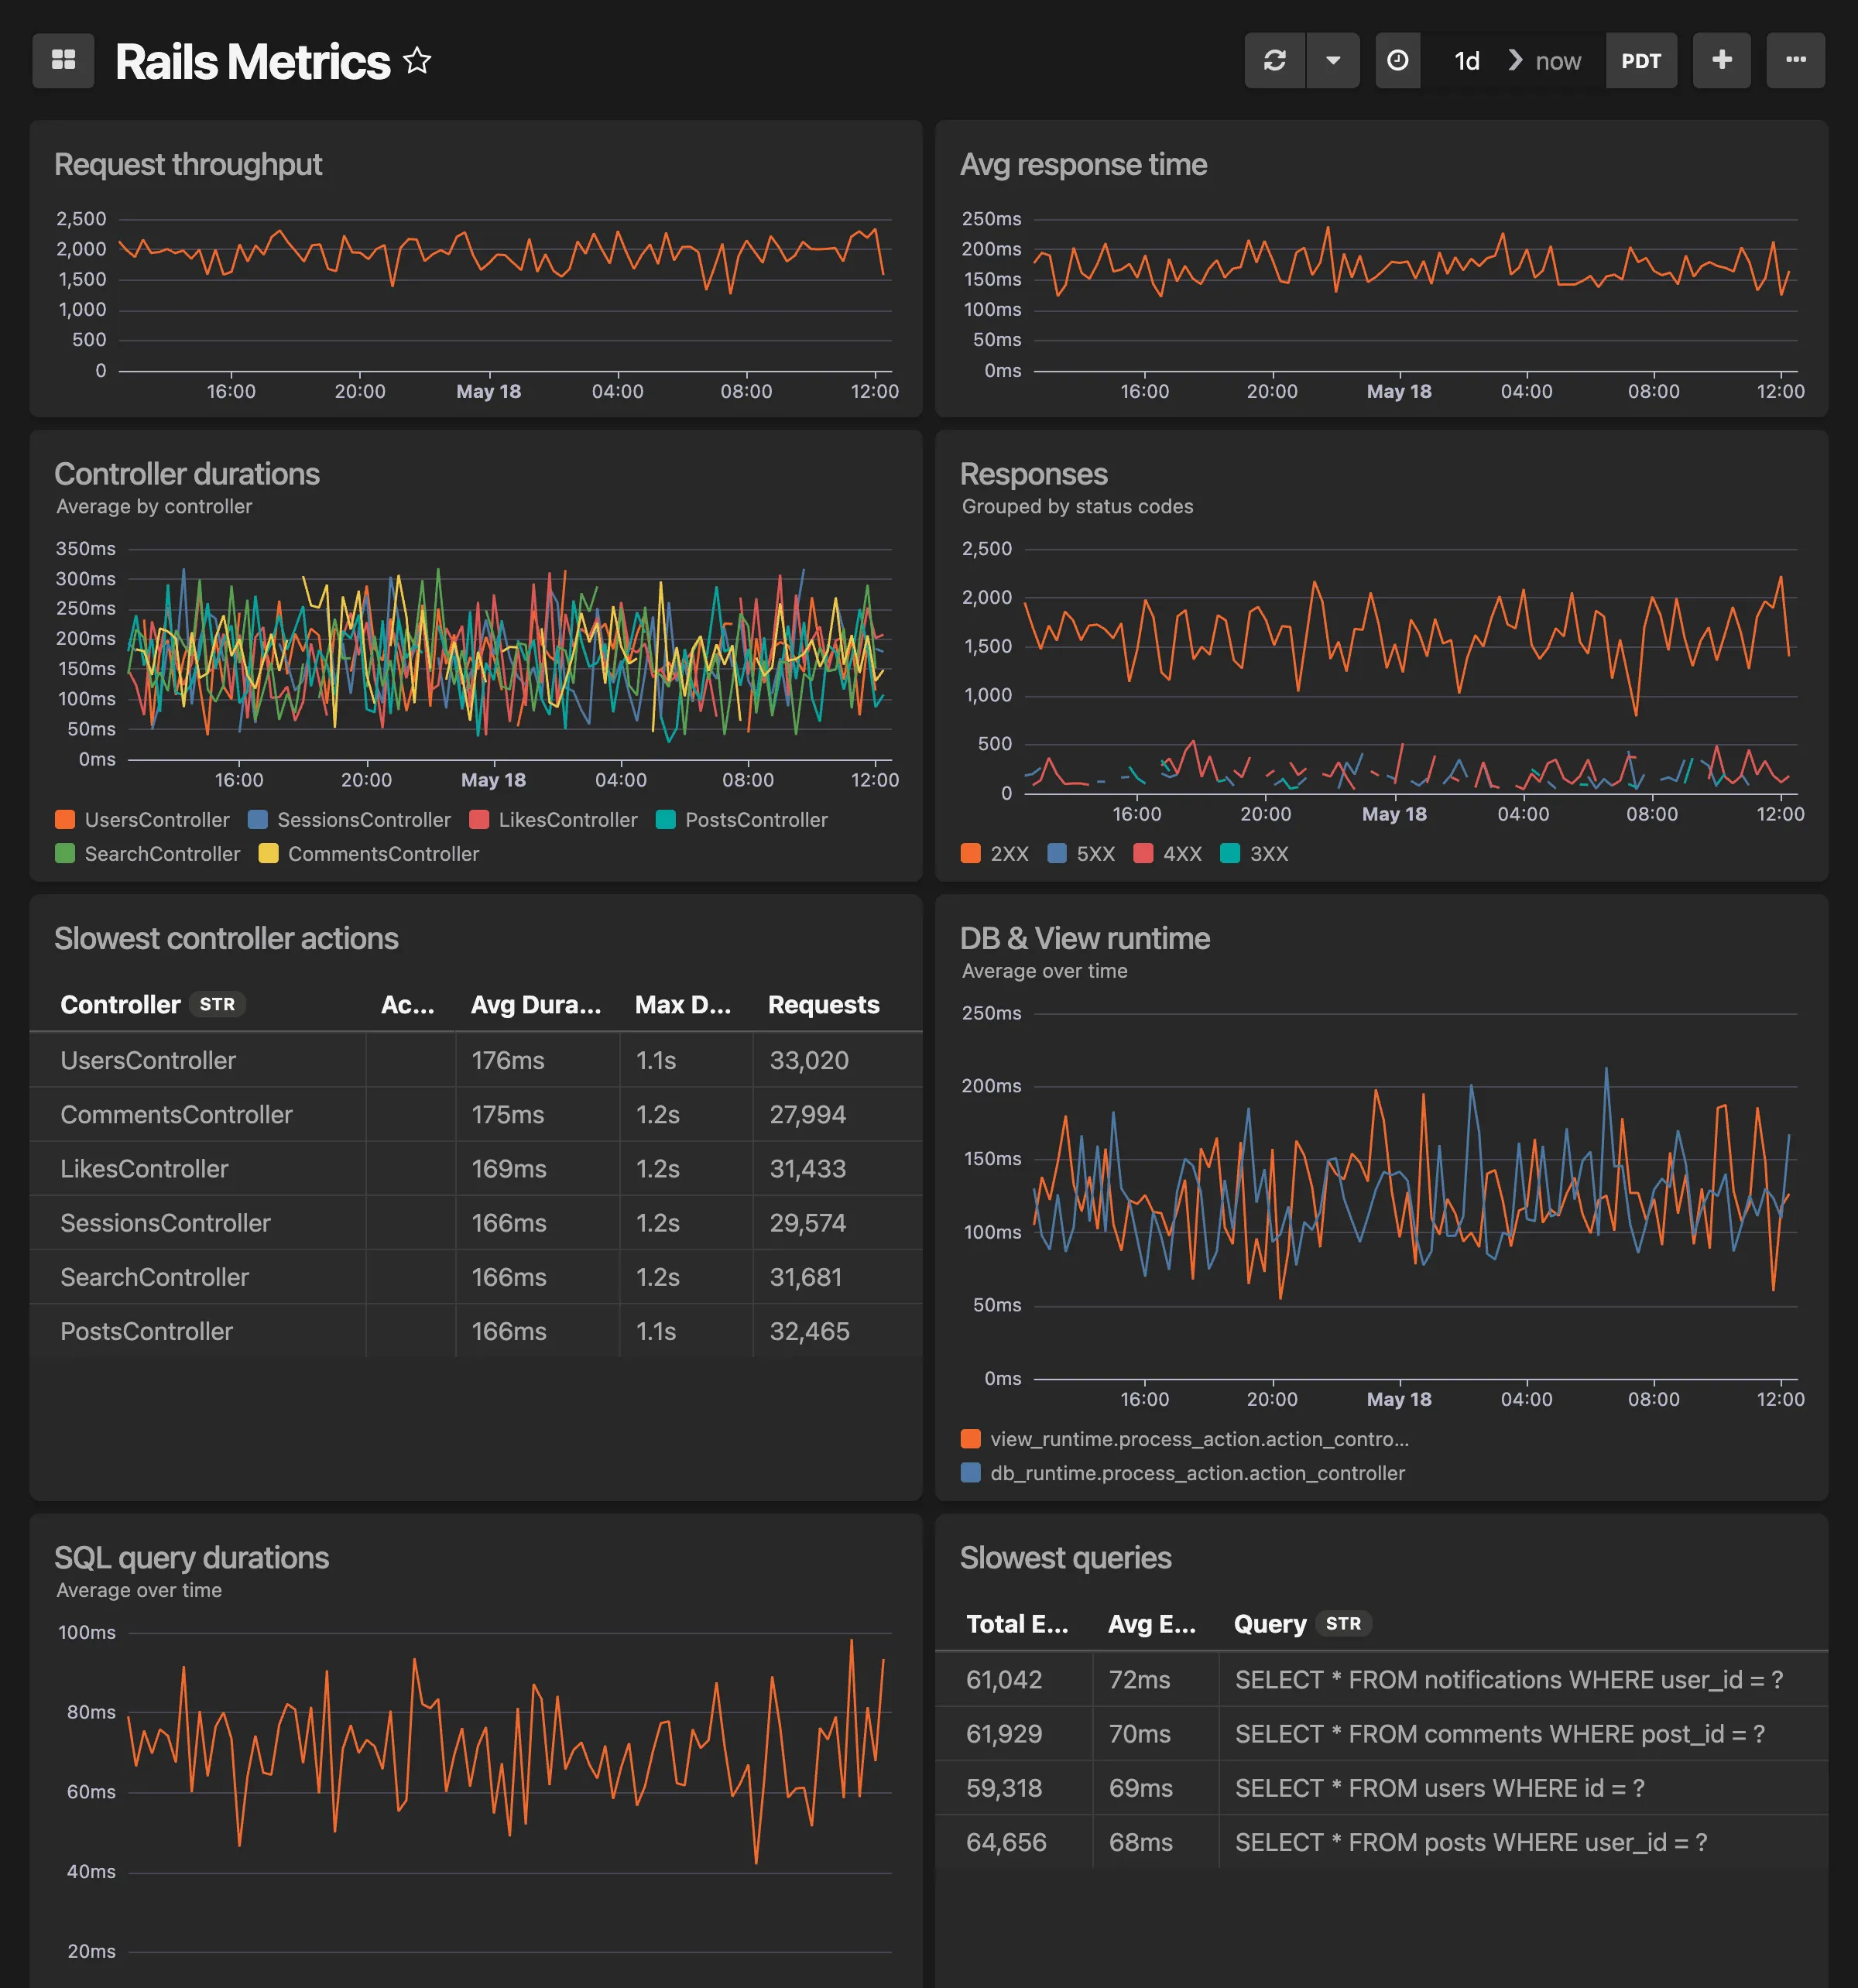
# Sidekiq dashboard
> Job counts, durations, and failure rates by worker
Drop in Dashboard for your Sidekiq instrumentation data **This dashboard includes:** * Job counts over time by worker * Average job duration by worker over time * Job duration distribution (binned by 100ms, by worker) * Job status counts (success/failure) by worker * Aggregate worker stats: successes, failures, total and average execution time * 10 slowest job runs (with details) To get started, make sure you have updated your Honeybadger gem to `>= 5.11`, then enable Insights instrumentation by including this in your `config/honeybadger.yml`:
```yaml
insights:
enabled: true
```
Check out the [Honeybadger client documentation](https://docs.honeybadger.io/lib/ruby/getting-started/sending-events-to-insights/) for more information. 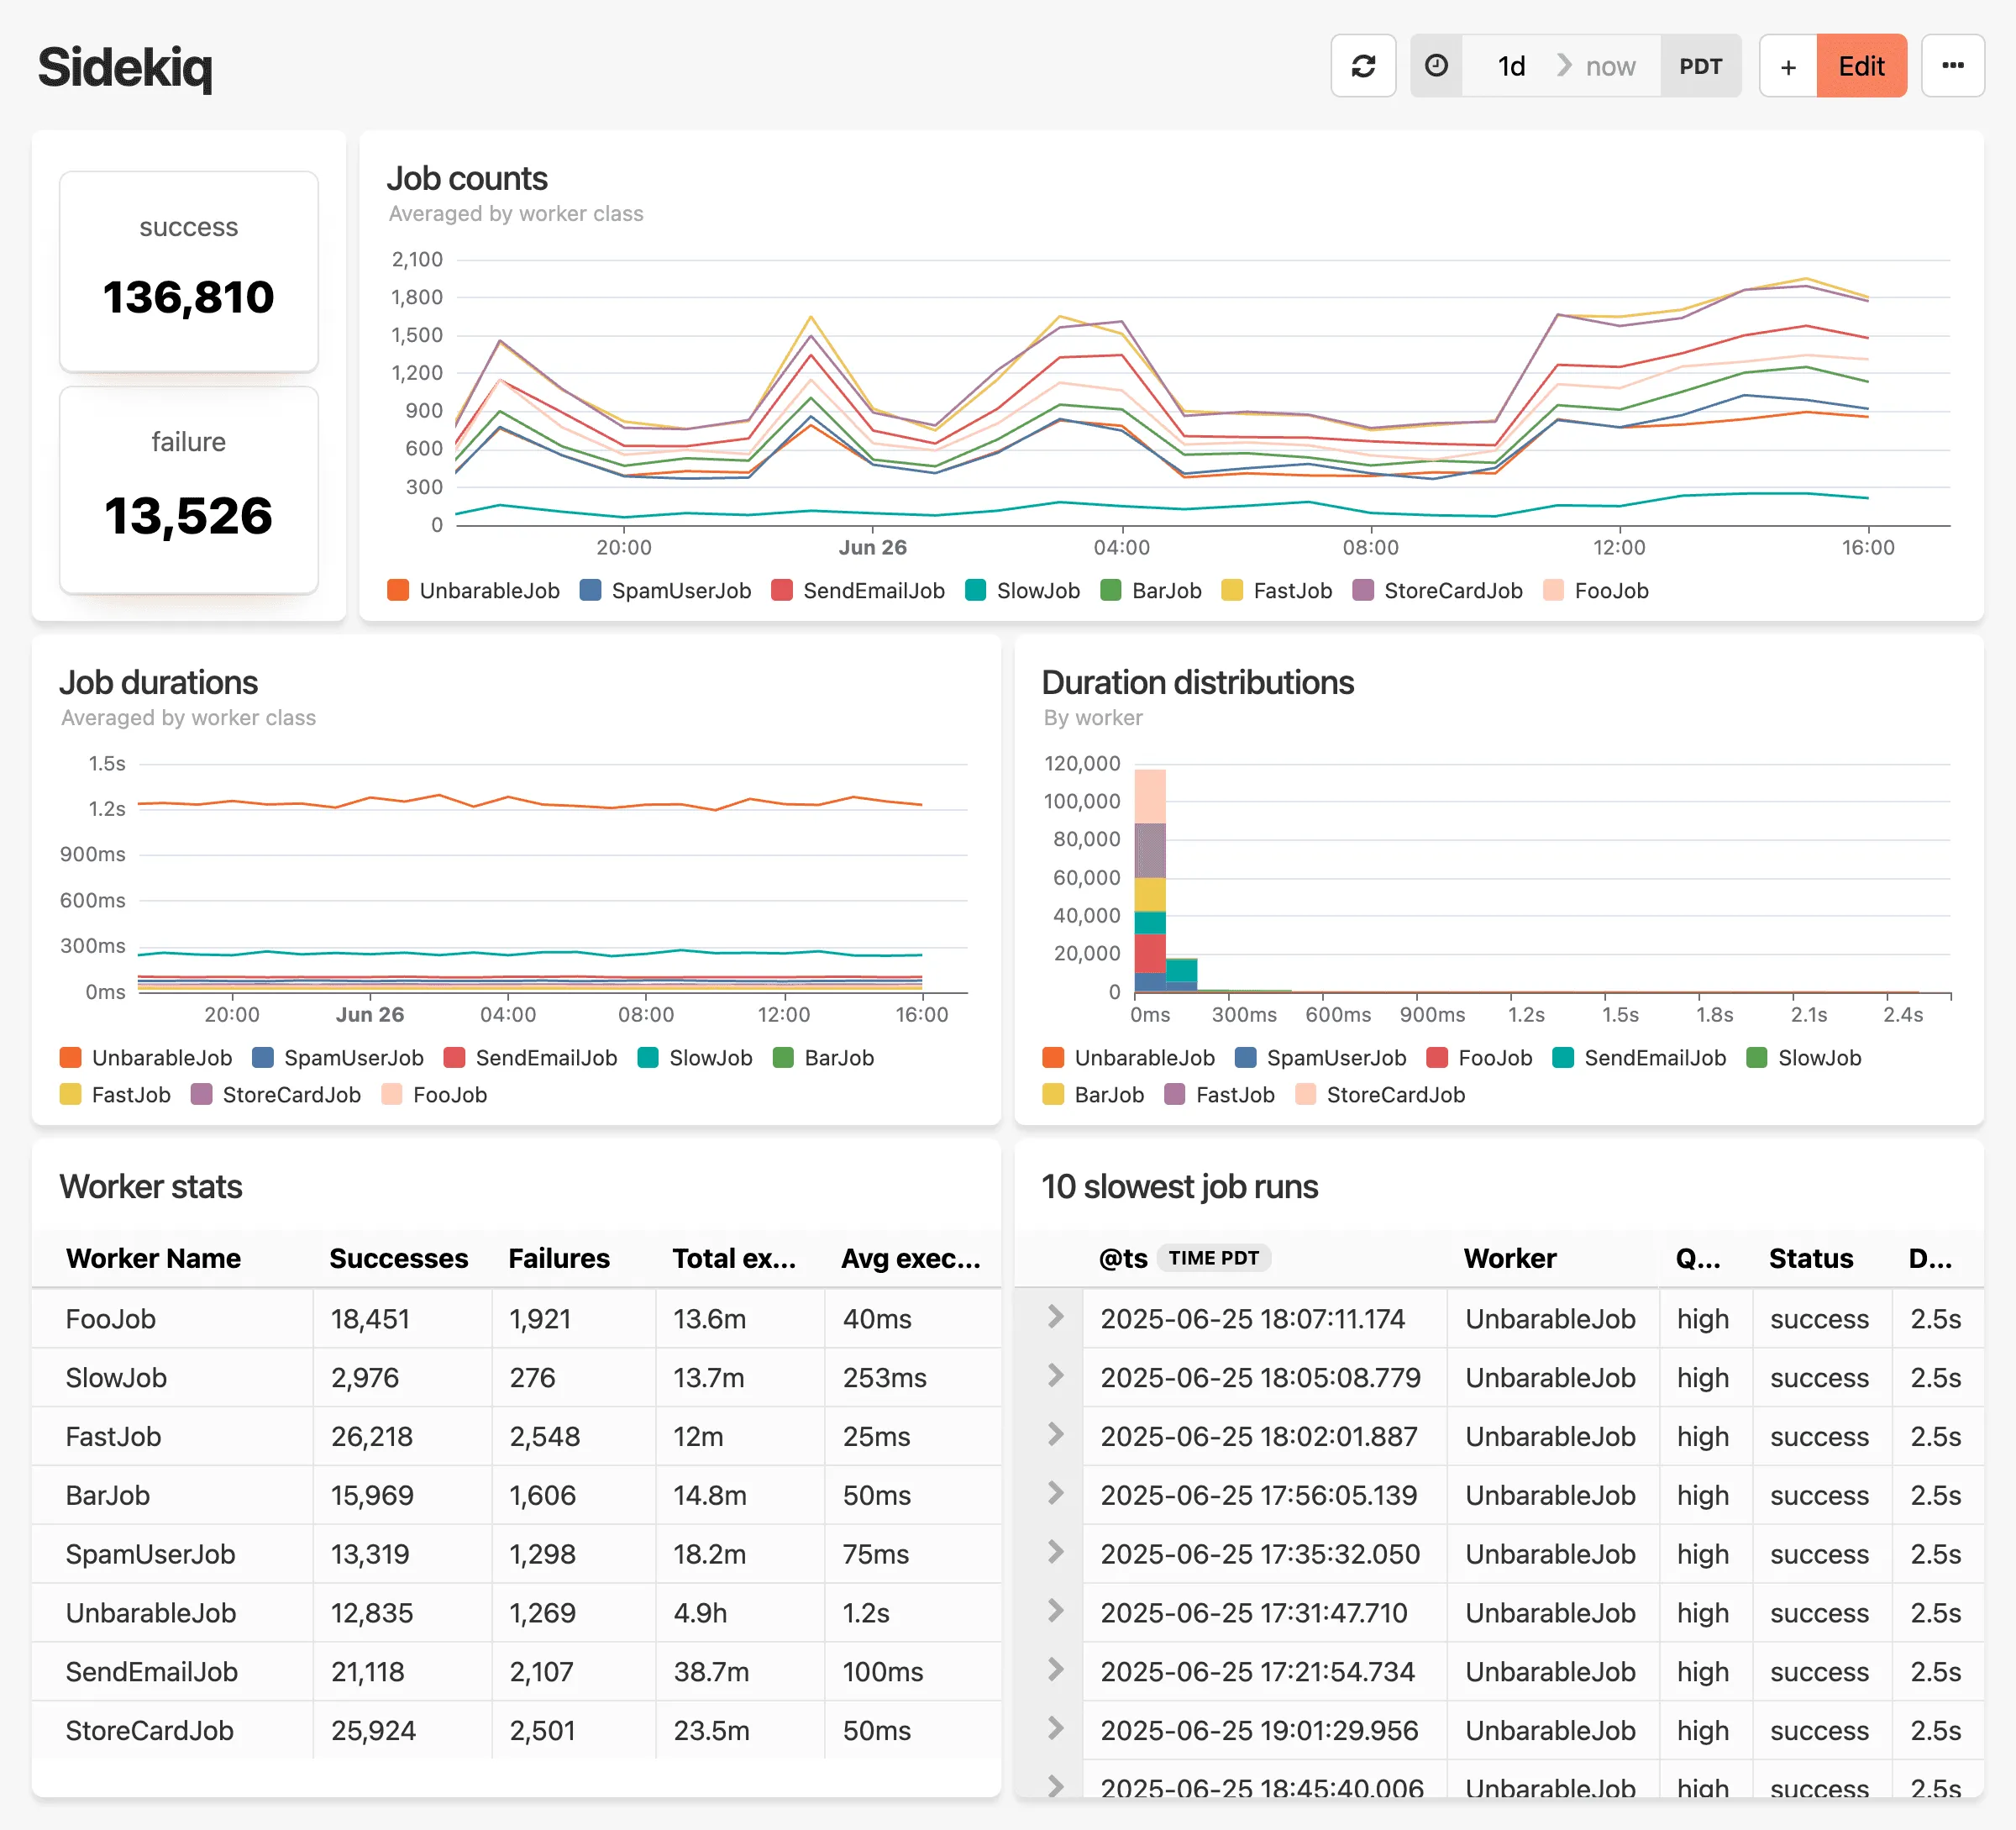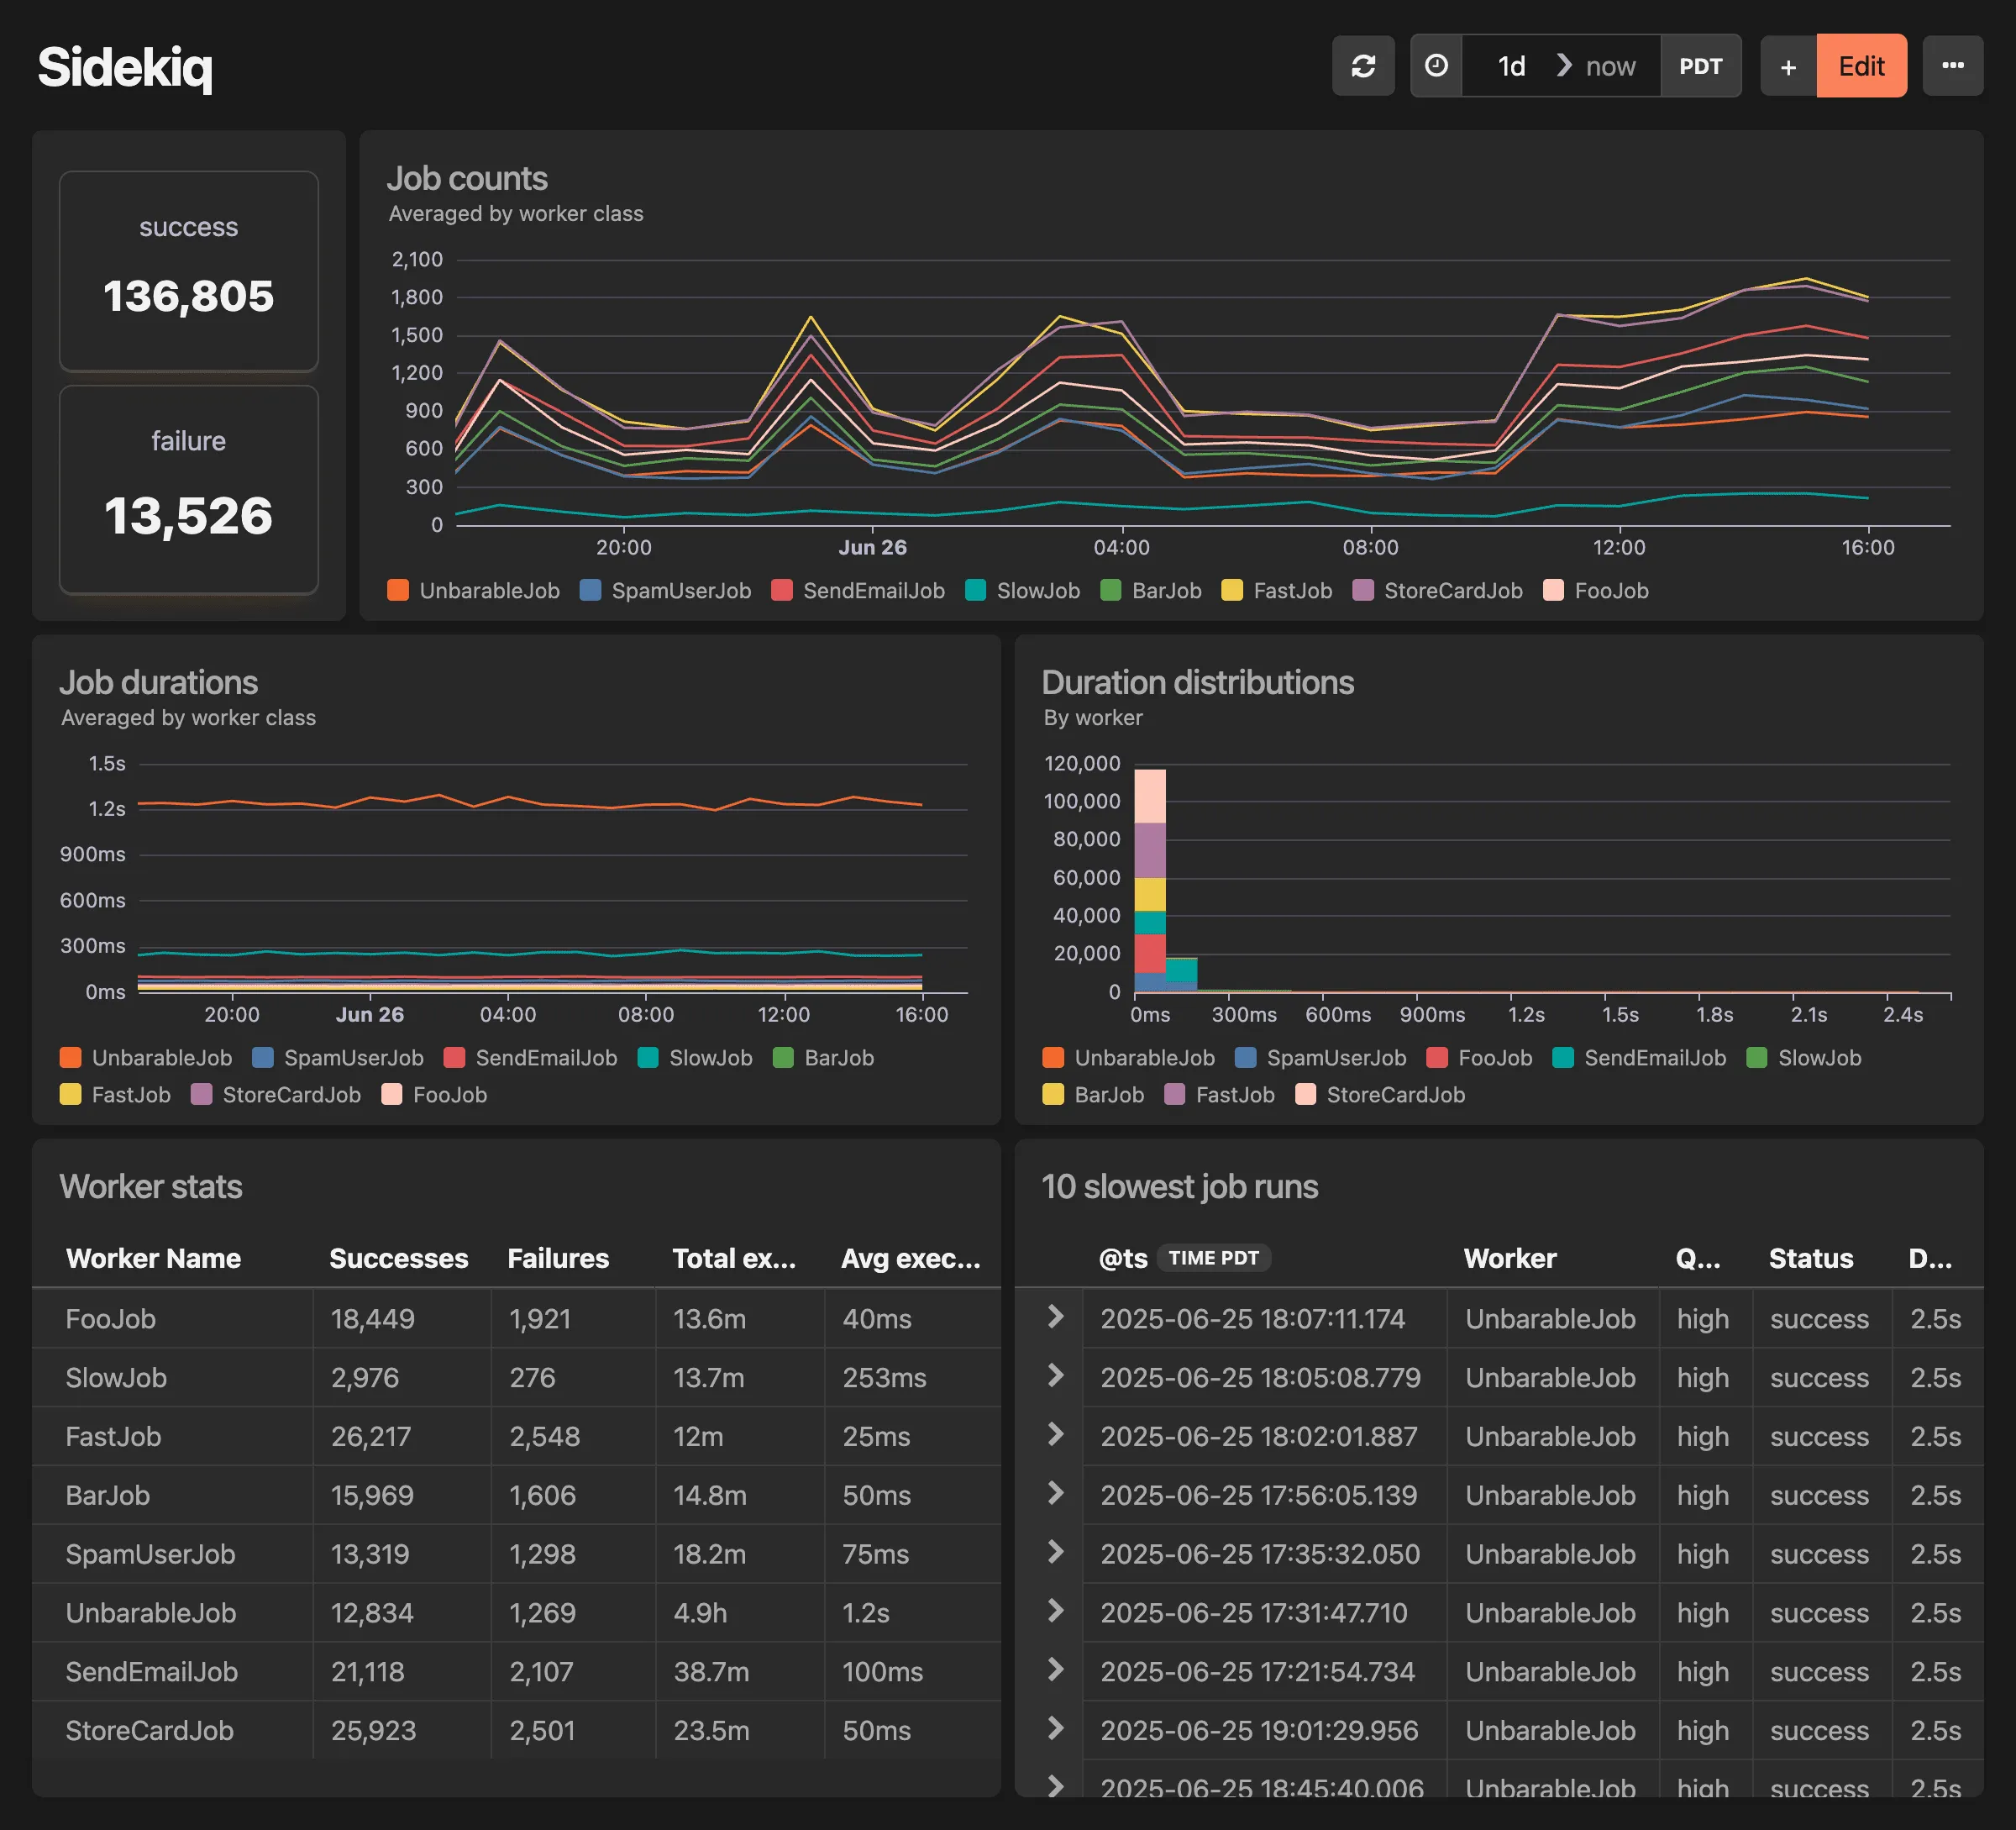
# Sidekiq Metrics dashboard
> Pre-aggregated job durations, queue depth, latency, and capacity
Drop in Dashboard for your Sidekiq metrics data This is the metrics-based counterpart to the Sidekiq (events) dashboard. In addition to job performance data, this dashboard includes infrastructure metrics like queue depth, latency, capacity, and utilization that are unique to the metrics pipeline. **This dashboard includes:** * Job durations by worker over time * Queue latency and depth per queue * Capacity and utilization * Infrastructure stats (processed, failed, scheduled, retry, dead) To get started, make sure you have updated your Honeybadger gem to `>= 5.11`, then enable Insights metrics by including this in your `config/honeybadger.yml`:
```yaml
insights:
enabled: true
sidekiq:
insights:
metrics: true
```
Check out the [Honeybadger client documentation](https://docs.honeybadger.io/lib/ruby/getting-started/sending-events-to-insights/) for more information. 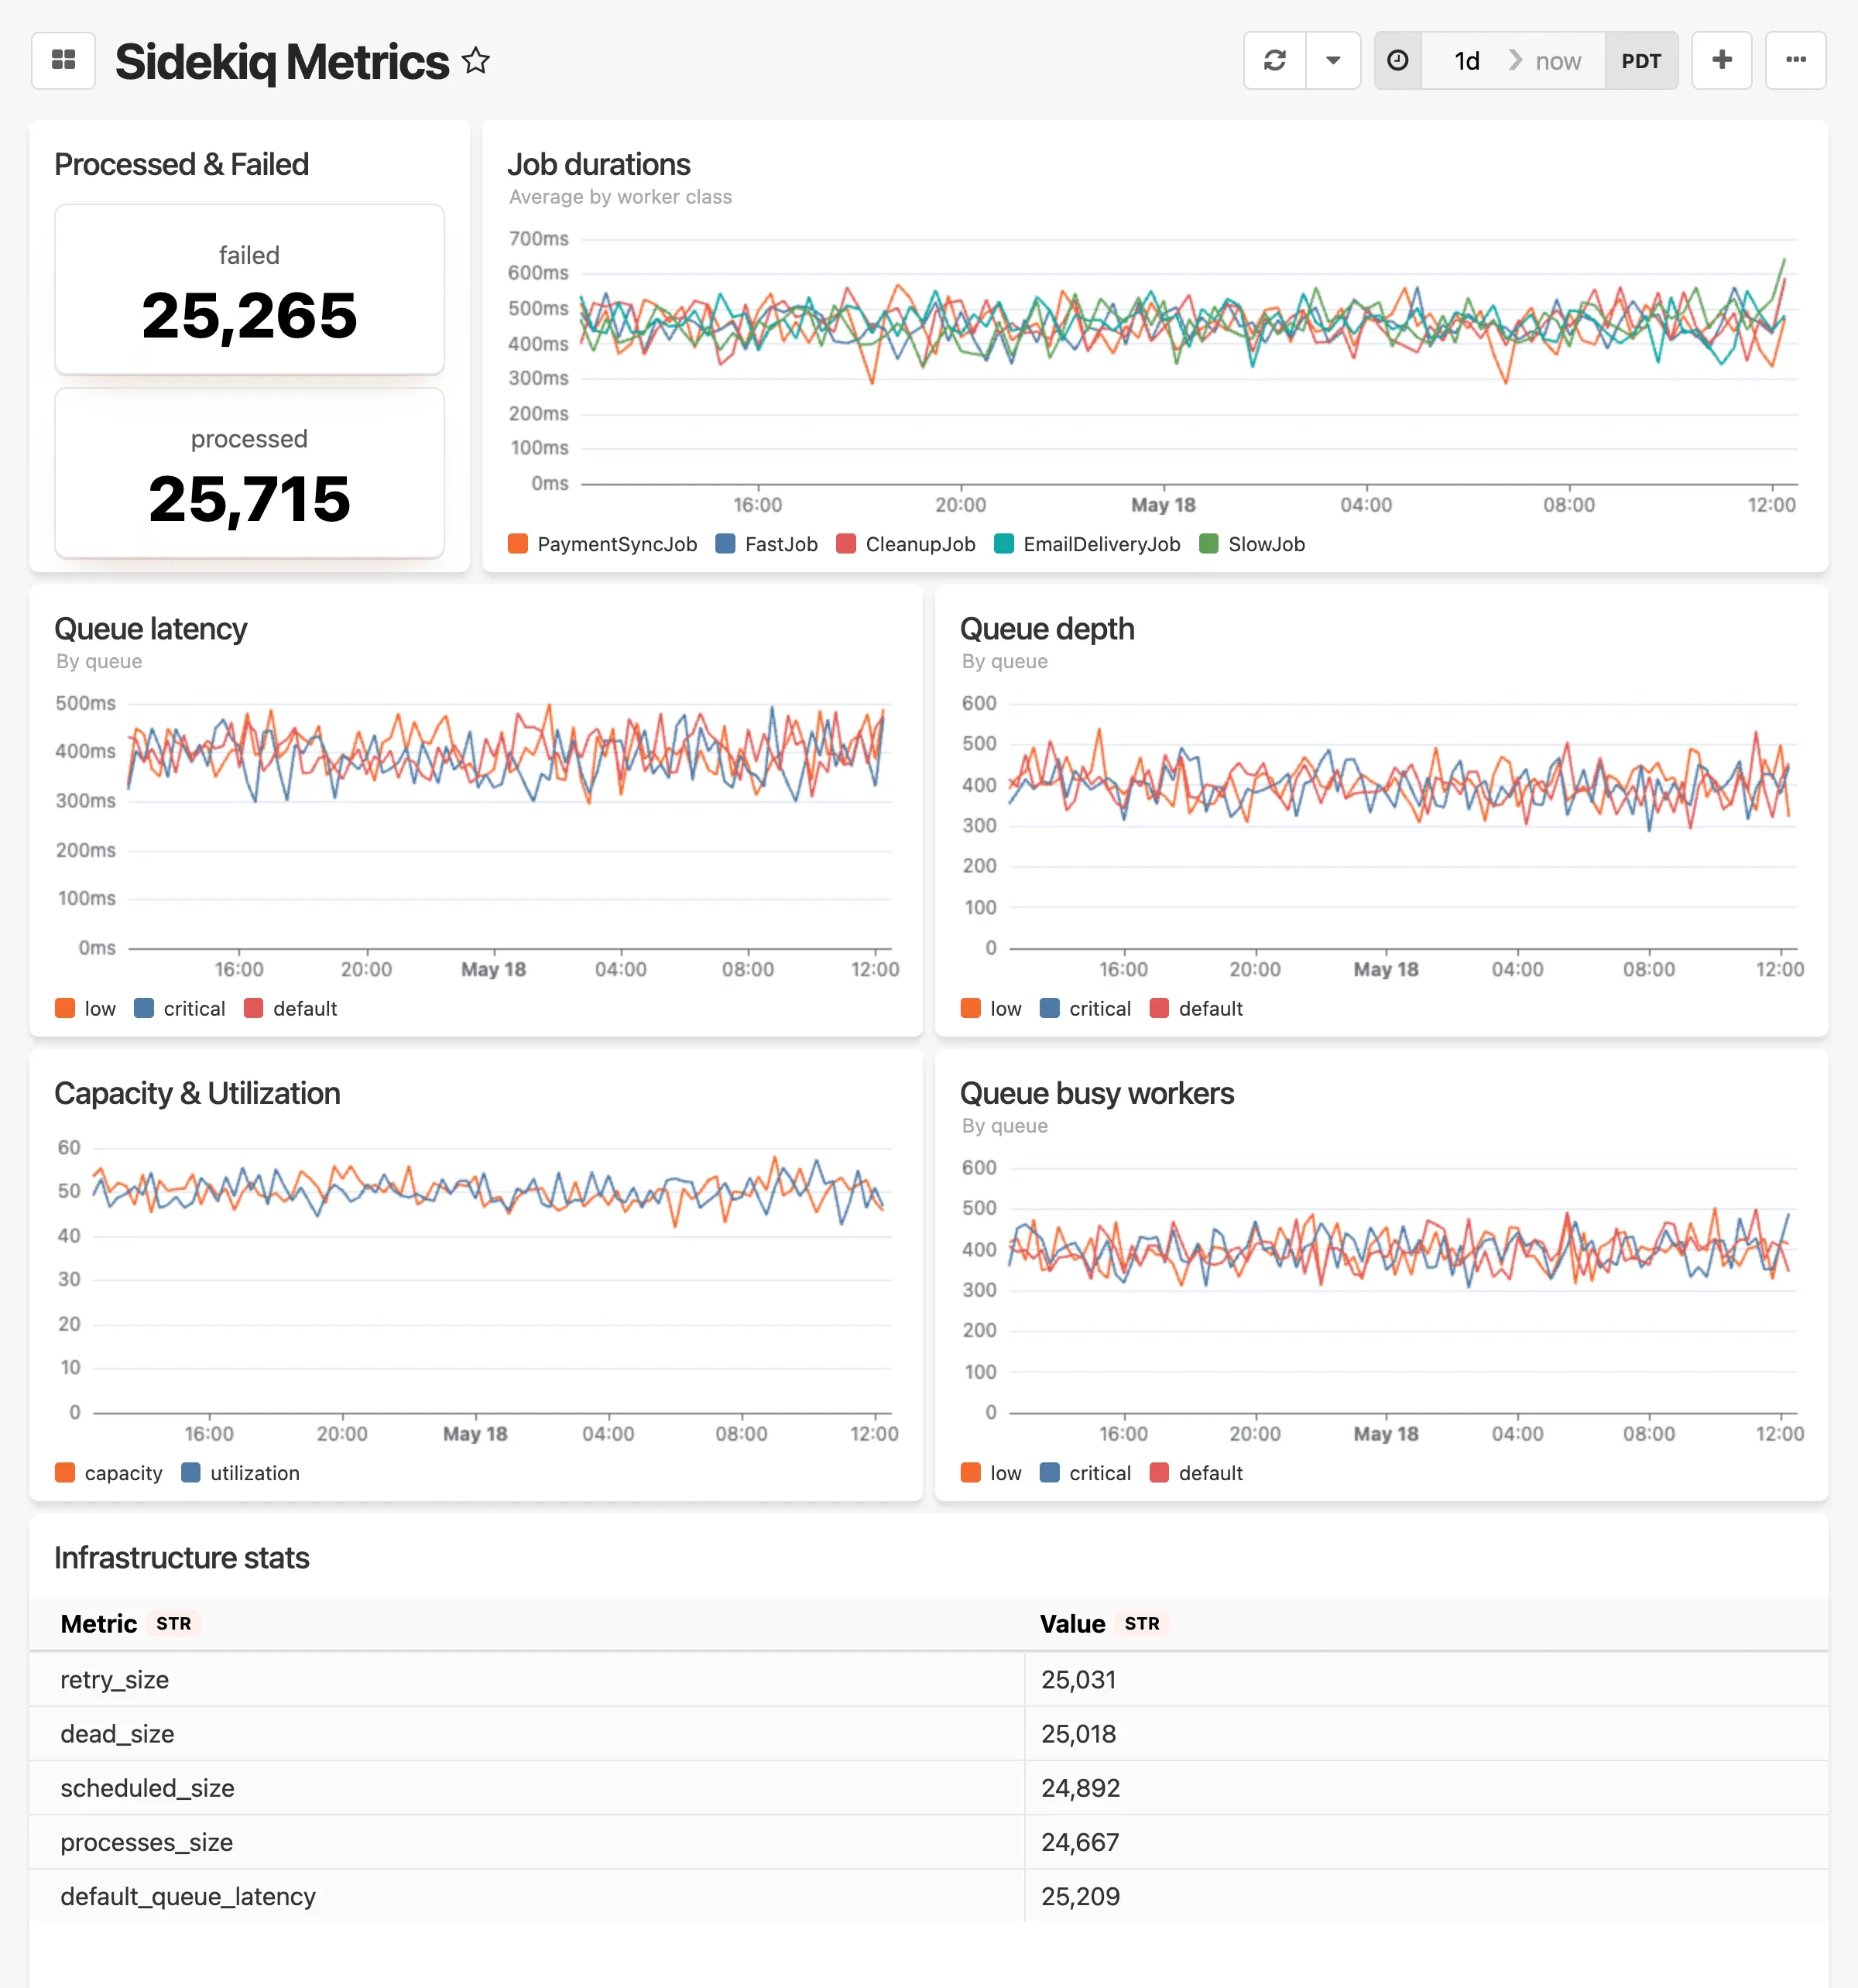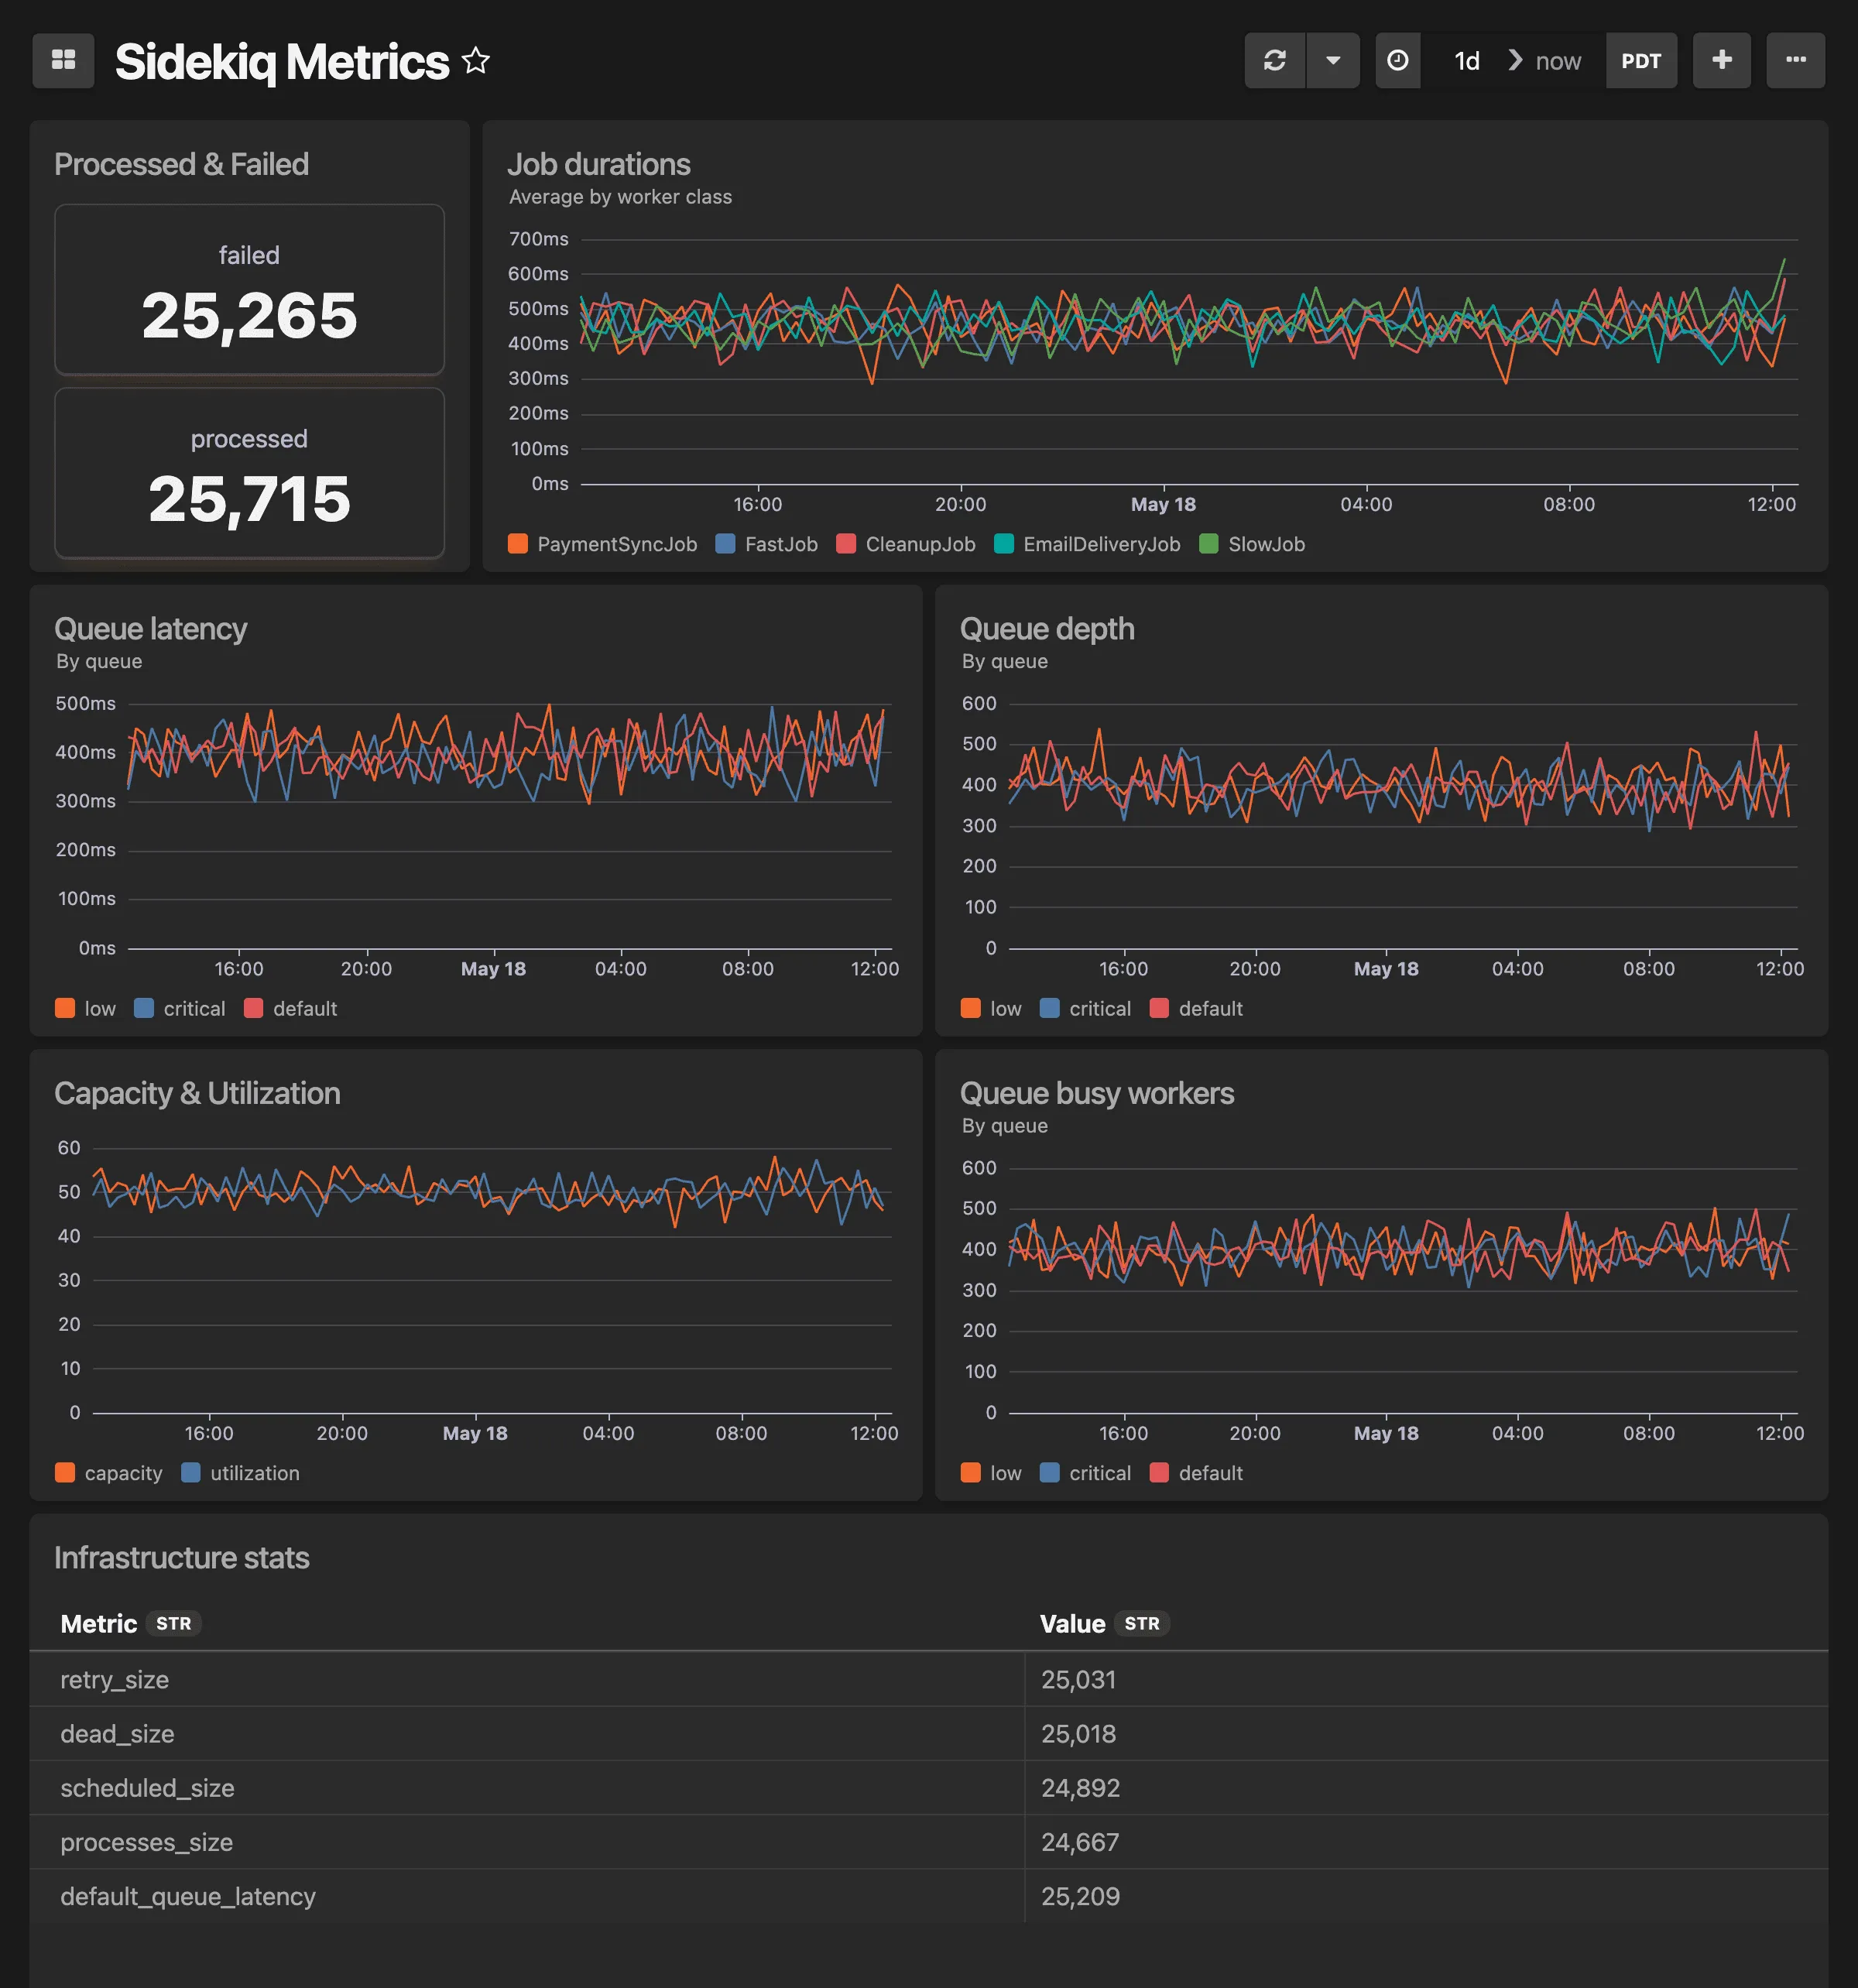
# Solid Queue Metrics dashboard
> Job statuses, active workers and dispatchers, and queue depths
Drop in Dashboard for your Solid Queue metrics data Monitor your Solid Queue infrastructure including job counts, worker/dispatcher status, and queue depths. **This dashboard includes:** * Job status overview (in progress, blocked, failed, scheduled, processed) * Active workers and dispatchers * Job trends over time * Queue depths by queue To get started, make sure you have updated your Honeybadger gem to `>= 6.3`, then enable Insights metrics by including this in your `config/honeybadger.yml`:
```yaml
insights:
enabled: true
solid_queue:
insights:
metrics: true
```
Check out the [Honeybadger client documentation](https://docs.honeybadger.io/lib/ruby/getting-started/sending-events-to-insights/) for more information. 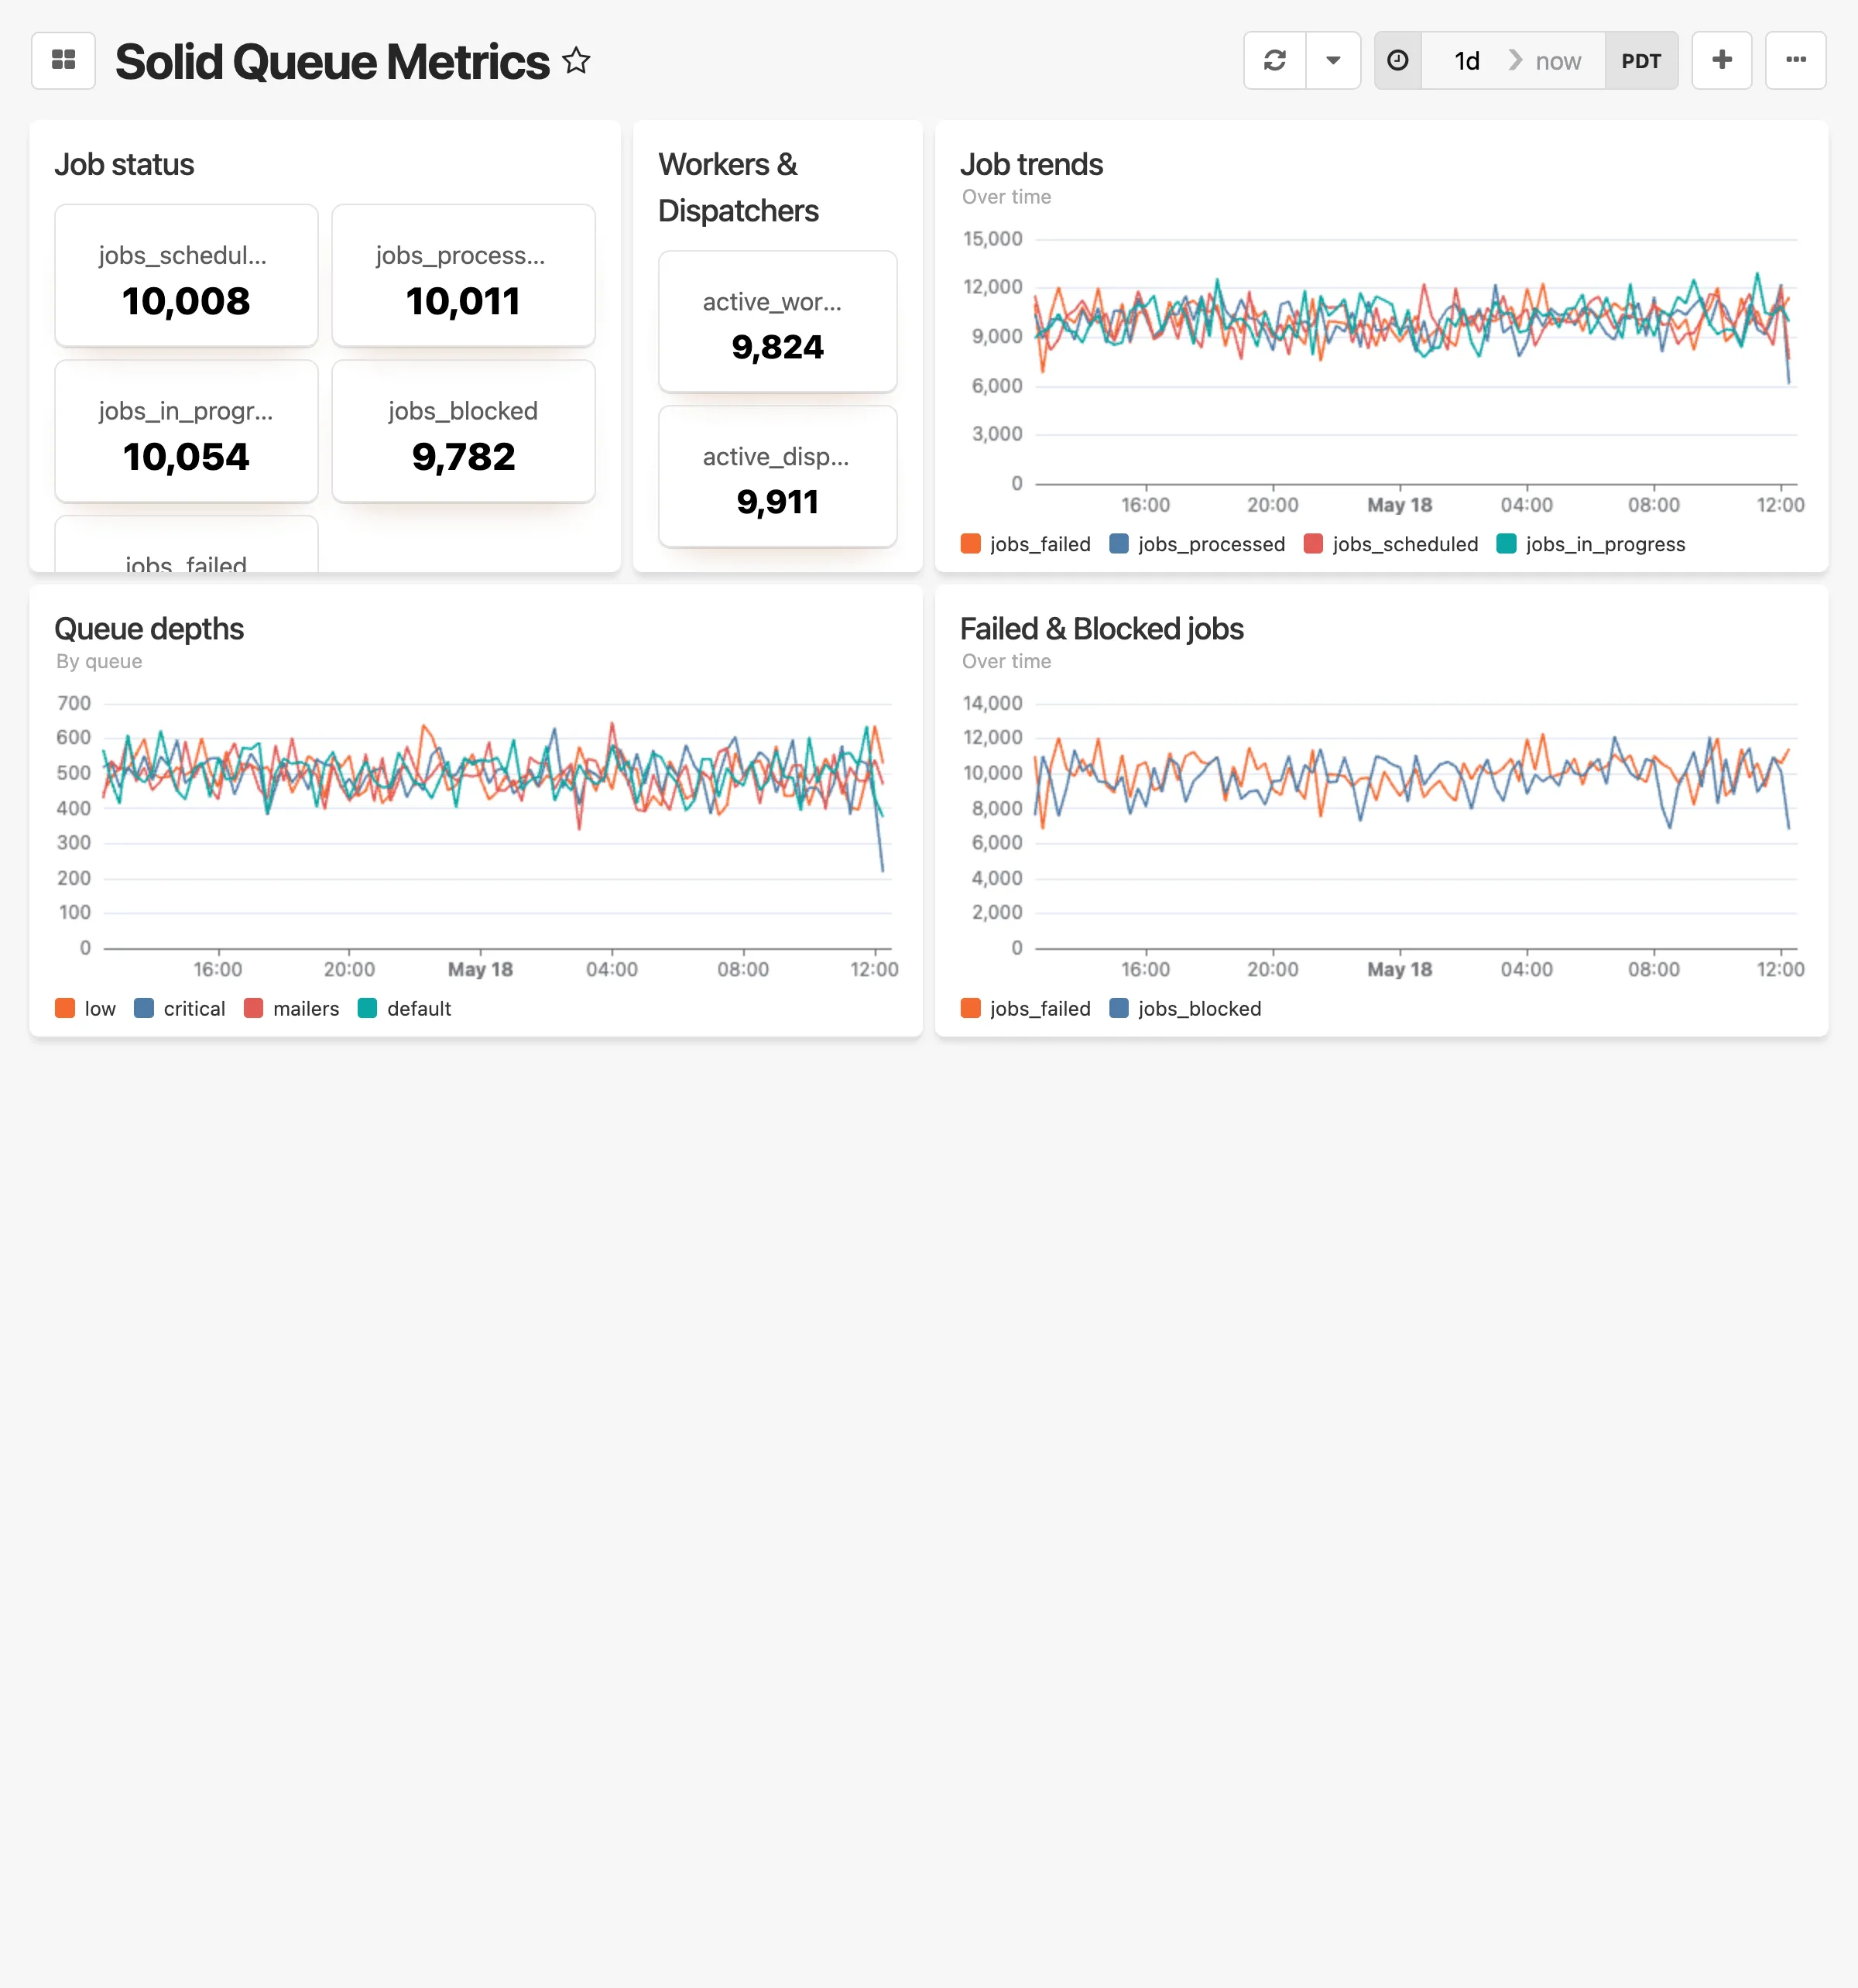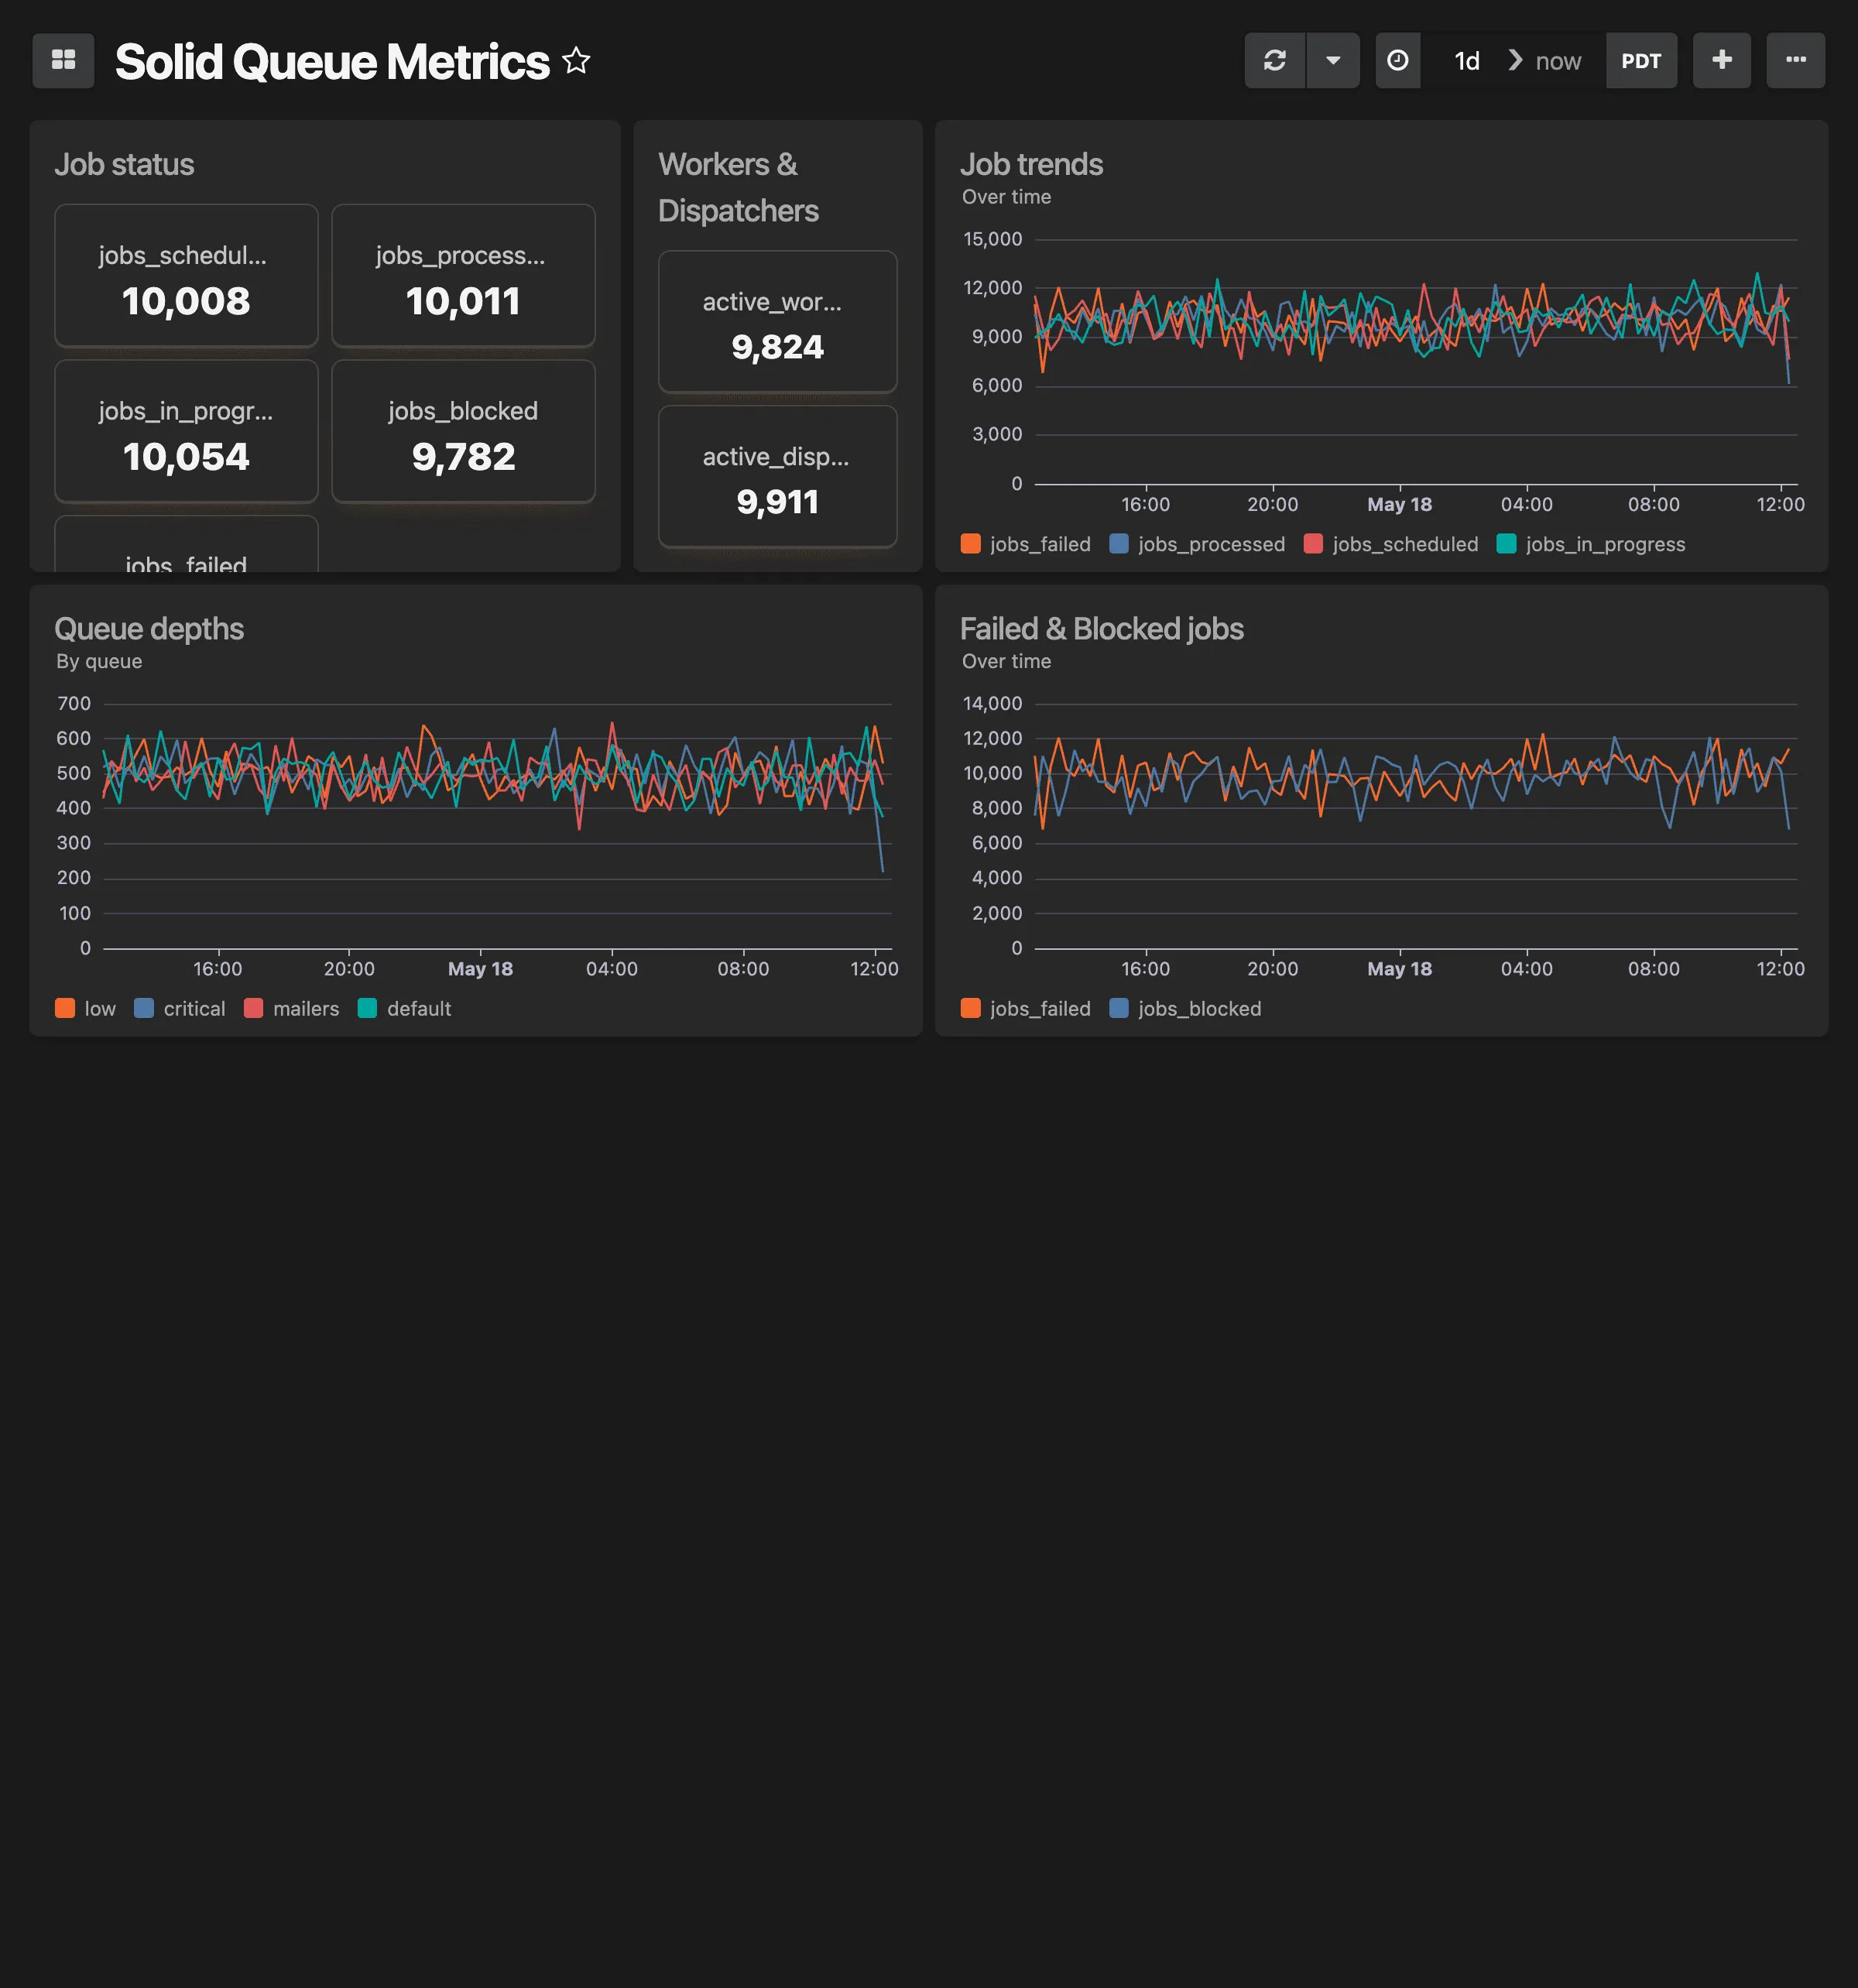
# System dashboard
> CPU load averages, memory usage, and disk usage by device
Ready made dashboard for monitoring system resources reported by the [Honeybadger CLI agent](https://docs.honeybadger.io/resources/cli/#agent). **This dashboard includes:** * CPU load averages (1, 5, and 15 minute intervals) * Memory usage percentage * Disk usage percentage by device 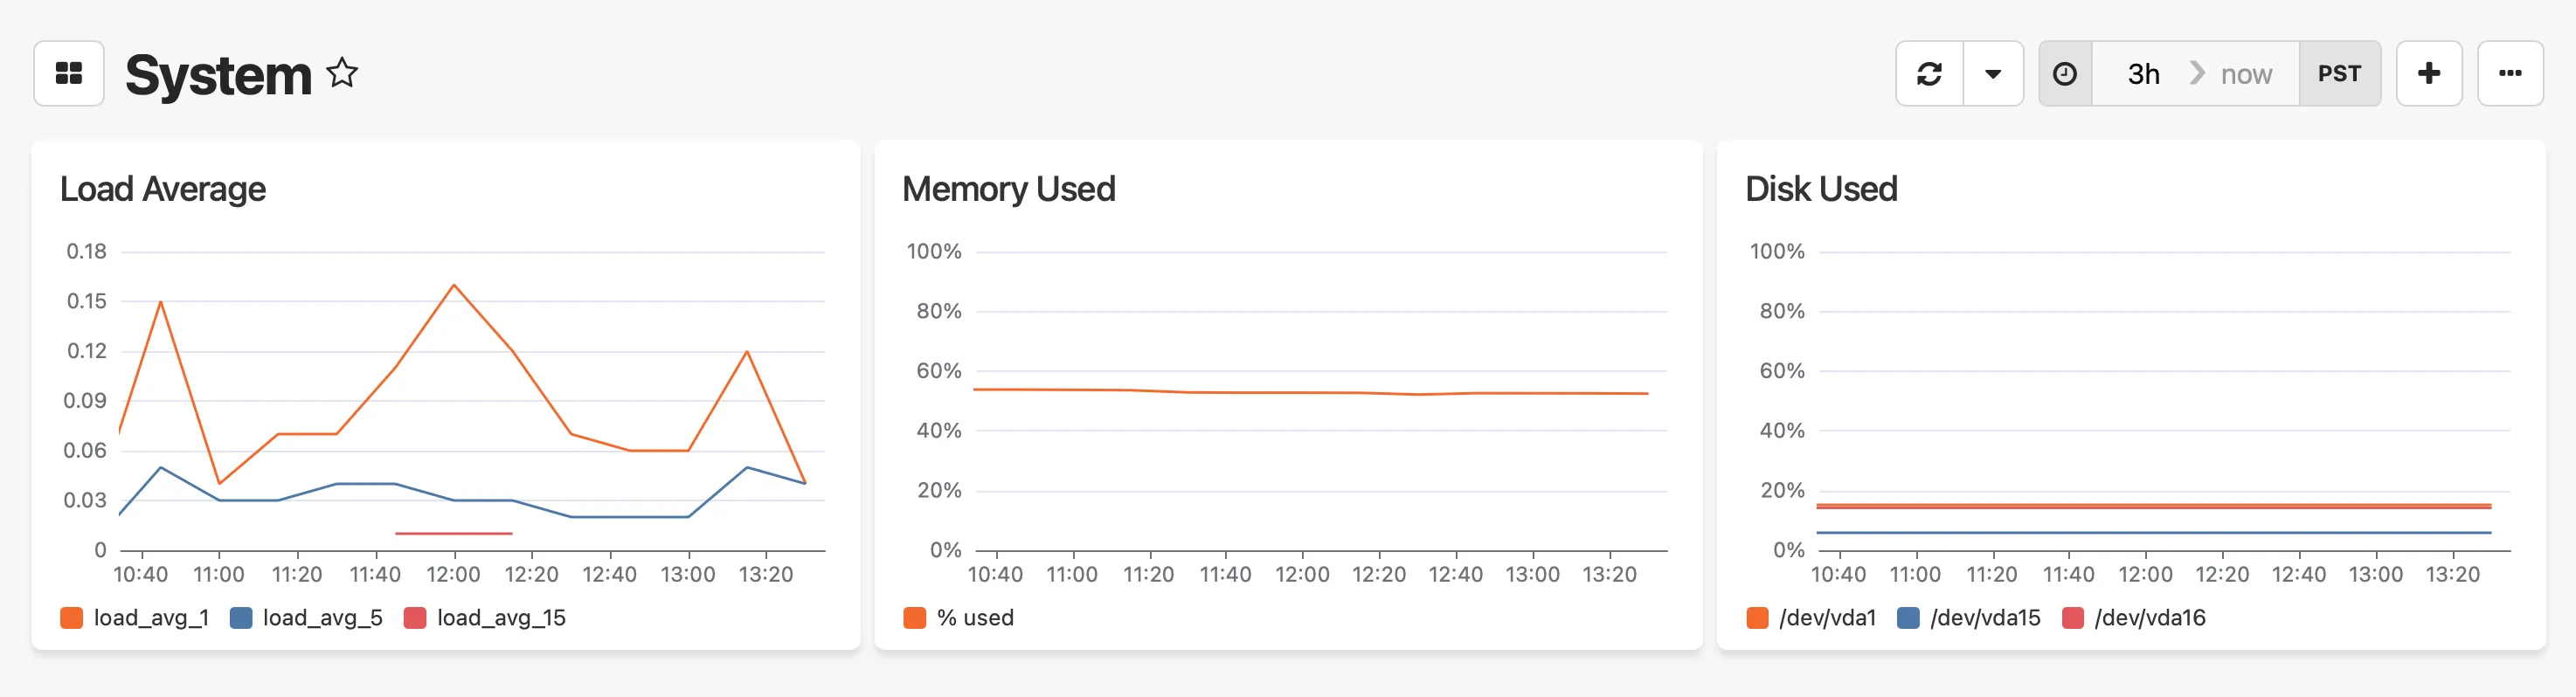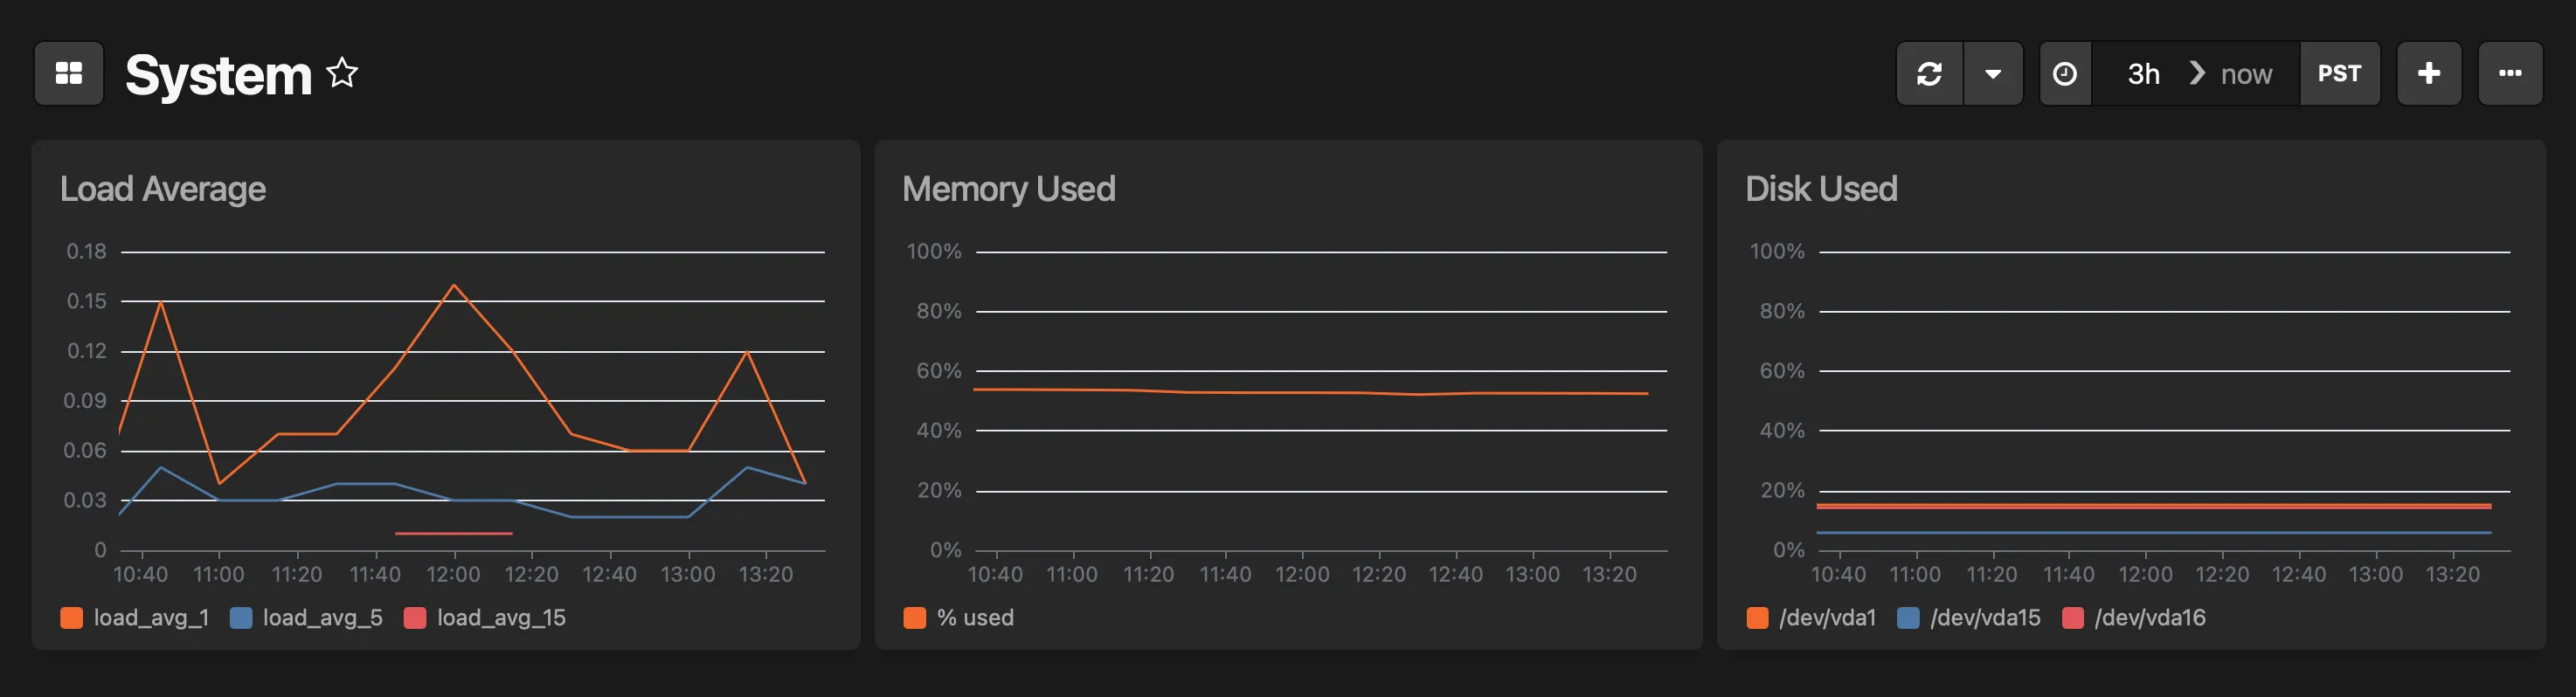
# Deployments
> Viewing and tracking deployments.
Deployment tracking lets you record when your app is deployed, see a history of deployments, and correlate code changes with errors. When you deploy, Honeybadger can automatically resolve open errors and notify your team. ## The Deployments page [Section titled “The Deployments page”](#the-deployments-page) Your most recent deployments are listed on your project’s Deployments page, sorted by timestamp with the newest first. You can also filter by environment and adjust the time range, with presets for month to date, the last seven days, and yesterday. For each deployment, Honeybadger displays the timestamp, environment, deploying user, and revision. When GitHub or GitLab is connected, Honeybadger links the revision to a comparison page that shows a diff of what changed since the last deploy. 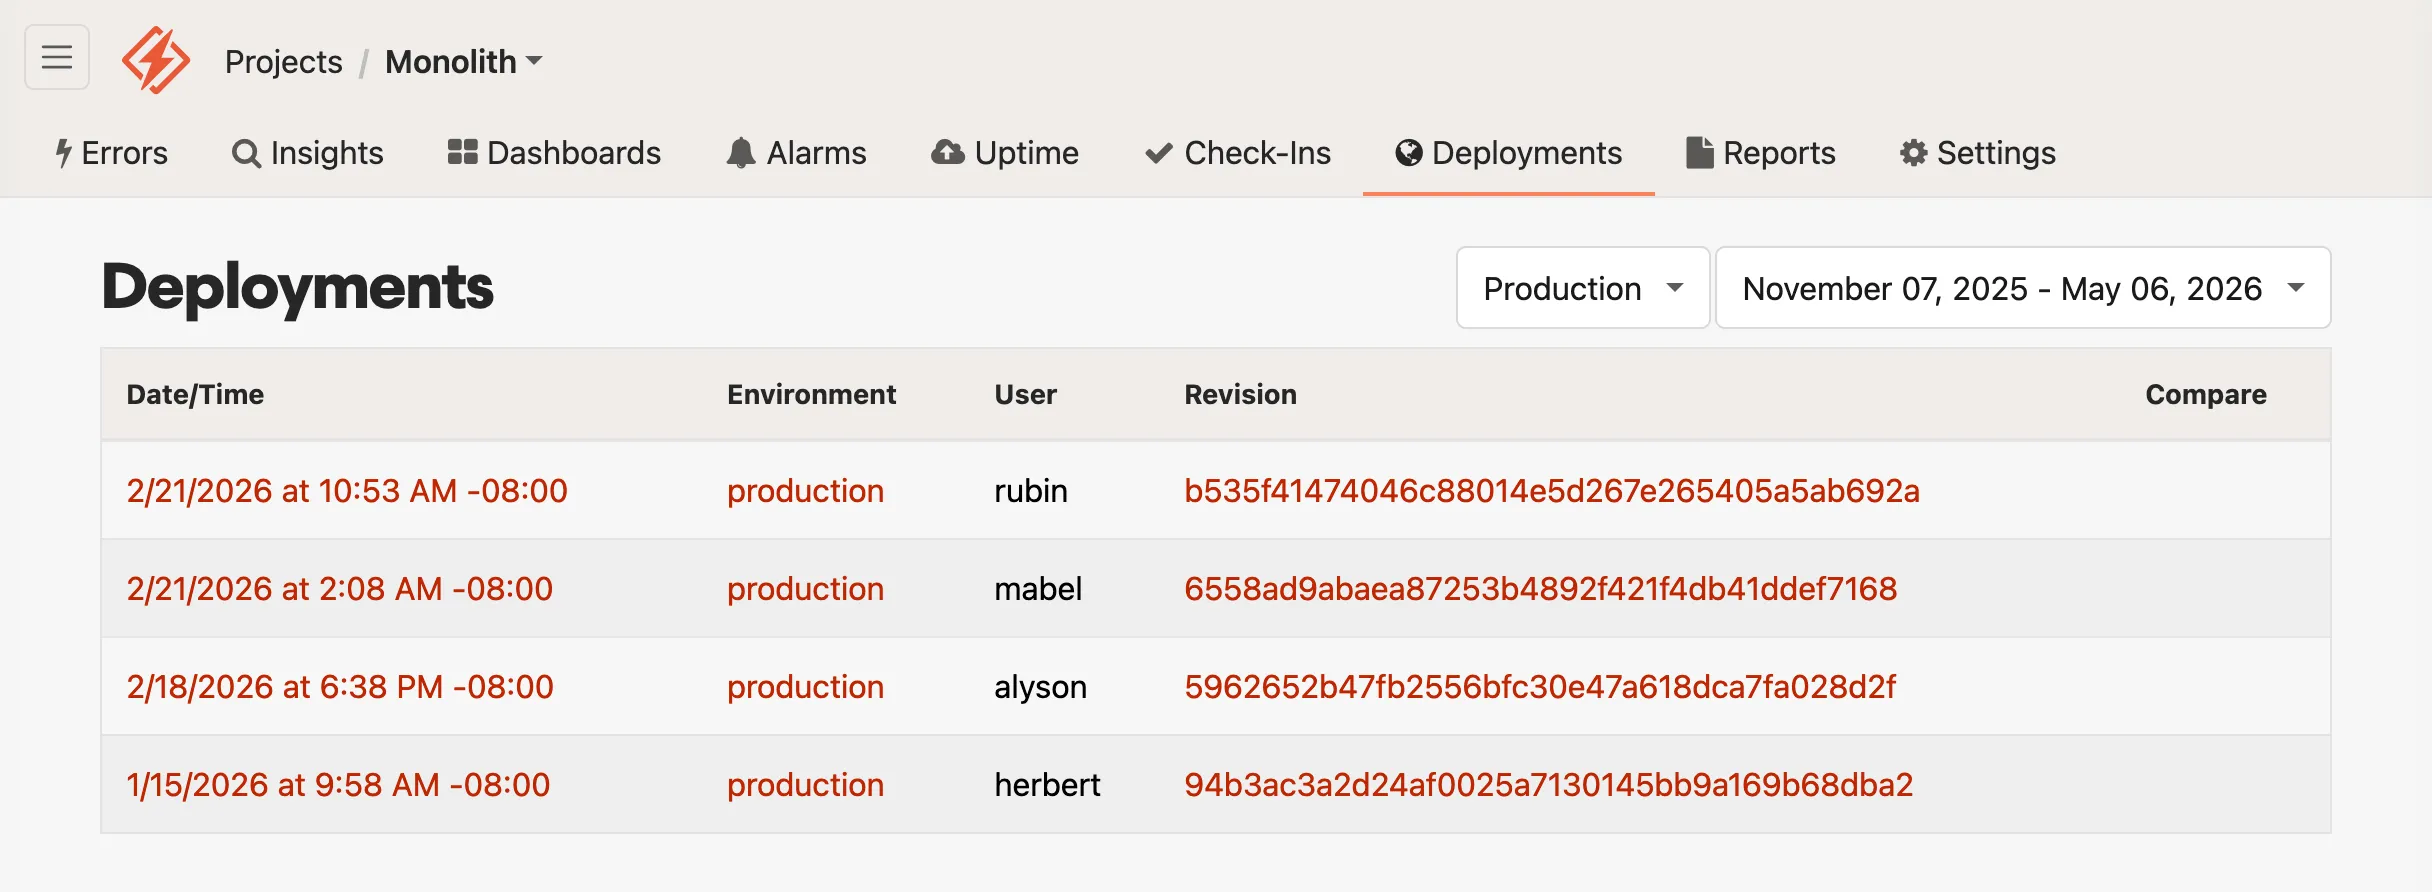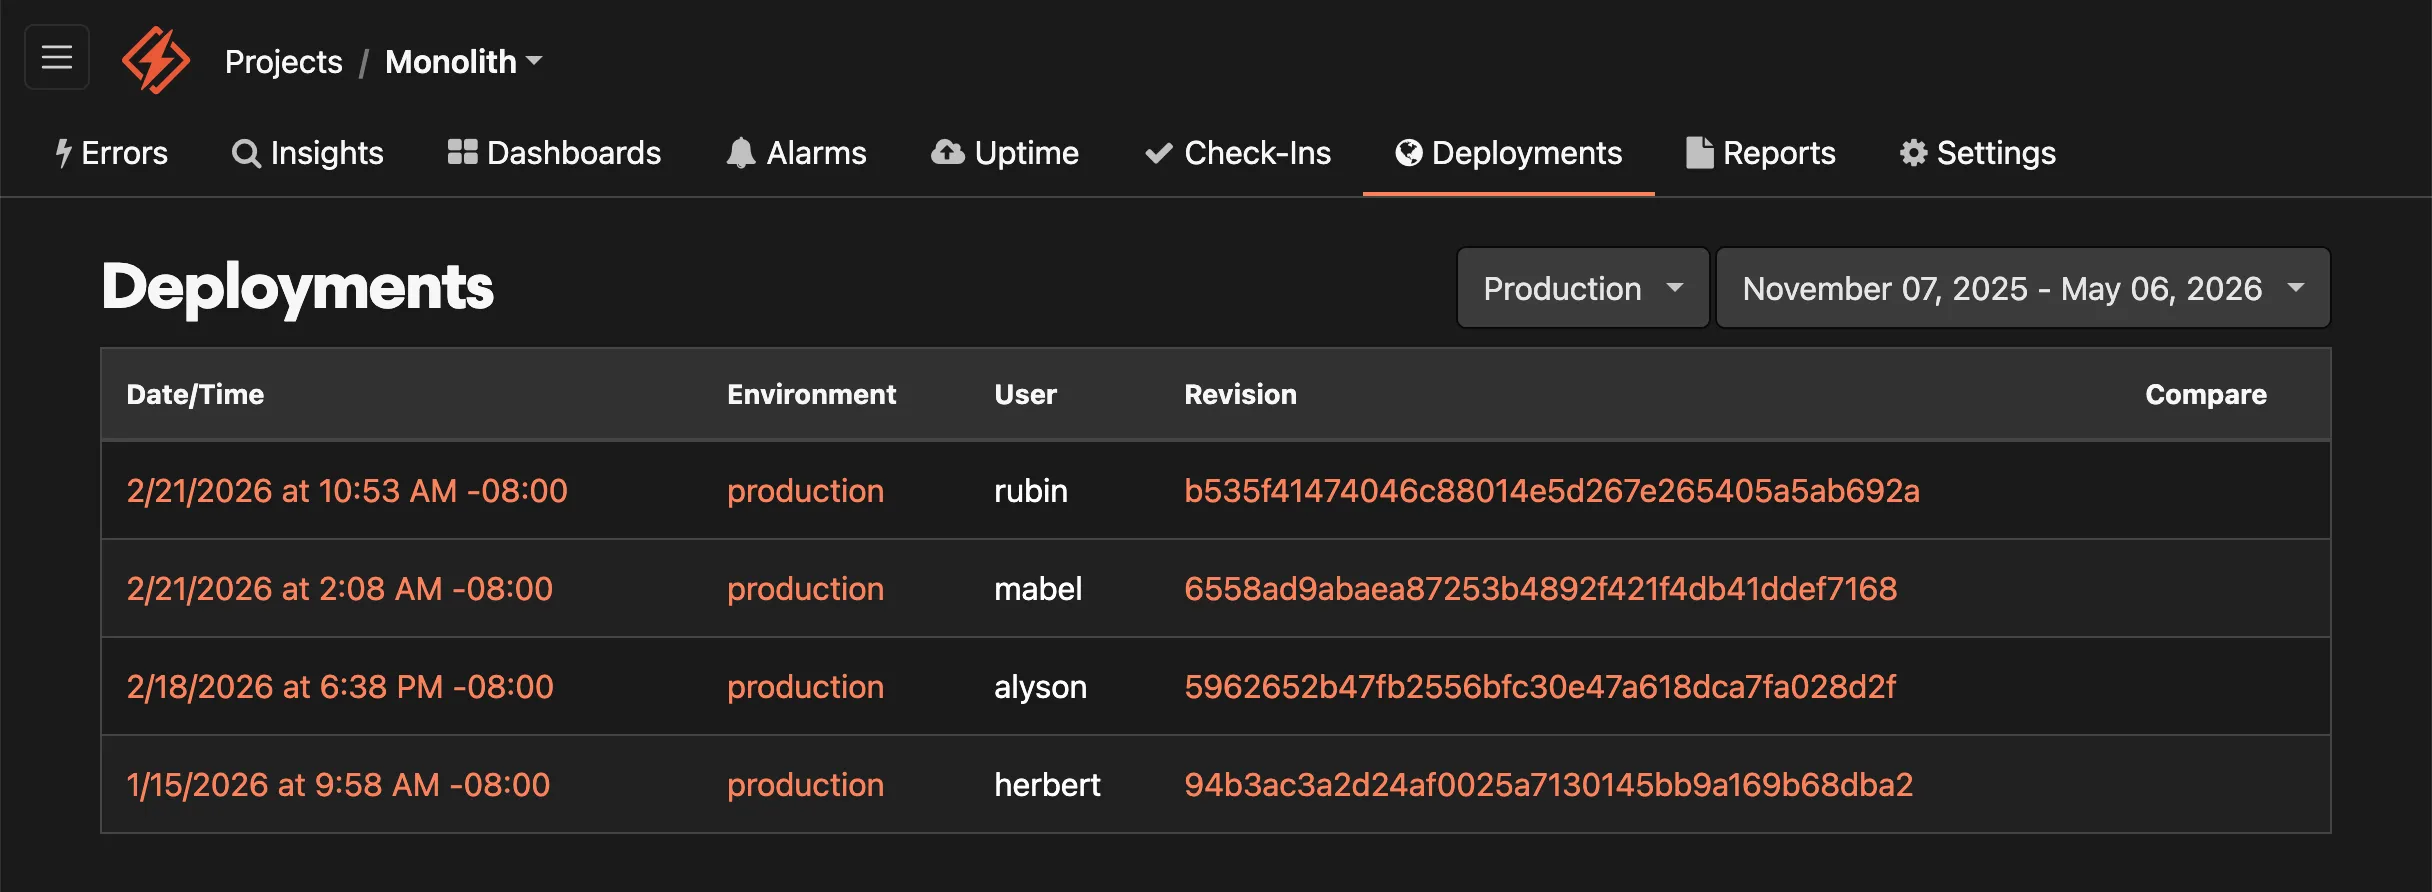 If your app is on Heroku, the user field shows which Heroku component triggered the deployment. ## Auto-resolving errors on deploy [Section titled “Auto-resolving errors on deploy”](#auto-resolving-errors-on-deploy) By default, all [unresolved errors](/guides/errors/#resolve--unresolve) are automatically marked as resolved when a deployment is recorded, which helps keep your [error list](/guides/errors/#browsing-errors) clean. If a resolved error re-occurs after a deploy, you will receive a new notification to let you know the error is still happening. Auto-resolving assumes you fix errors between deploys (or at least want to be reminded about errors frequently). To disable auto-resolve, uncheck *Resolve errors on deploy* in your [project’s settings](/guides/projects/#general-project-settings). When disabled, you can still [mark individual errors to resolve on the next deploy](/guides/errors/#resolve-on-deploy) on the error page. ## Searching with deployments [Section titled “Searching with deployments”](#searching-with-deployments) Honeybadger’s [error search](/guides/errors/search/) supports several deployment-related tokens: | Token | Description | | ------------------------------ | ------------------------------------------------------------------------------------------------------------ | | `occurred.after:'last deploy'` | Errors that occurred since the most recent deployment | | `revision:"v1.0"` | Errors that occurred from a deployment with this revision | | `is:pending_resolution` | Errors set to resolve on the next deploy (when [auto-resolve](#auto-resolving-errors-on-deploy) is disabled) | The `occurred.after:'last deploy'` token is useful for spotting errors in new code, especially when combined with [environment or assignee filters](/guides/errors/search/#examples). ## Reporting deployments [Section titled “Reporting deployments”](#reporting-deployments) To track your deployments, you’ll need to notify Honeybadger each time you deploy. There are several ways to do this depending on your stack: ### Client libraries [Section titled “Client libraries”](#client-libraries) We have language-specific deployment tracking guides for [Ruby](/lib/ruby/errors/tracking-deployments/), [JavaScript](/lib/javascript/errors/tracking-deploys/), [PHP](/lib/php/errors/tracking-deploys/), [Python](/lib/python/errors/tracking-deployments/), and [Elixir](/lib/elixir/errors/tracking-deployments/). ### CI/CD and platform integrations [Section titled “CI/CD and platform integrations”](#cicd-and-platform-integrations) * **GitHub Actions**: Use the [Honeybadger Deploy Action](https://github.com/marketplace/actions/honeybadger-deploy-action) * **Heroku**: See the [Heroku guide](/guides/heroku/#heroku-deployment-tracking) * **Netlify**: See the [JavaScript guide](/lib/javascript/errors/tracking-deploys/#from-netlify) * **Laravel Forge**: See the [PHP guide](/lib/php/errors/tracking-deploys/#tracking-deploys-from-laravel-forge) * **DeployHQ**: [Native Honeybadger integration](https://www.deployhq.com/support/integrations/honeybadger) ### Direct API [Section titled “Direct API”](#direct-api) For any other tool or pipeline, make a request directly to the Honeybadger API. See the [API reference](/api/reporting-deployments/) for a full list of parameters.
```sh
HONEYBADGER_ENV="production" \
HONEYBADGER_REVISION="$(git rev-parse HEAD)" \
HONEYBADGER_REPOSITORY="$(git config --get remote.origin.url)" \
HONEYBADGER_API_KEY="Your project API key" \
&& curl -g "https://api.honeybadger.io/v1/deploys?deploy[environment]=$HONEYBADGER_ENV&deploy[local_username]=$USER&deploy[revision]=$HONEYBADGER_REVISION&deploy[repository]=$HONEYBADGER_REPOSITORY&api_key=$HONEYBADGER_API_KEY"
```
If you are using our [EU stack](/resources/data-residency/), use `eu-api.honeybadger.io` instead of `api.honeybadger.io`. ### Honeybadger CLI [Section titled “Honeybadger CLI”](#honeybadger-cli) Use the `hb deploy` command in the [Honeybadger CLI](/resources/cli/):
```shell
hb deploy --environment production --repository github.com/org/repo --revision abc123 --user johndoe
```
## Deployment notifications [Section titled “Deployment notifications”](#deployment-notifications) Honeybadger can notify your team when your app is deployed. Any of your configured [integrations](/guides/integrations/) — Slack, PagerDuty, email, and more — can be set up to receive deploy notifications. If you’re using the webhook integration, see the [deployed event payload](/guides/integrations/payloads/deployed/) for the payload format.
# Error monitoring
> Collect, manage, and resolve your application errors.
## Installation [Section titled “Installation”](#installation) Before you can start using Honeybadger to squash bugs, you will need to install our library into your app. Installation usually boils down to: 1. Installing the Honeybadger library 2. Setting the API key 3. Enabling error reporting The details vary a little depending on language and platform. But you can always find the correct installation instructions for YOUR app on the “Project Settings” page. In case you are wondering, we officially support: [Ruby](/lib/ruby/), [client-side JavaScript](/lib/javascript/), [Vue](/lib/javascript/integration/vue3/), [Elixir](/lib/elixir/), [Go](/lib/go/), [NodeJS](/lib/javascript/integration/node/), [Java](/lib/java/), [Python](/lib/python/), [PHP](/lib/php/), [Clojure](/lib/clojure/), and [Cocoa](/lib/cocoa/) Check out any of these pages to see how to install Honeybadger for your app. Once our client library is installed and configured, errors thrown by your application are automatically sent to our API. ## Error grouping [Section titled “Error grouping”](#error-grouping) Honeybadger groups similar exceptions together using rules which we’ve found to work the best in most cases. The default information we use to group errors is: 1. The file name, method name, and line number of the error’s location 2. The class name of the error 3. The component/controller name We use this information to construct a “fingerprint” of the exception. Exceptions with the same fingerprint are treated as the same error in Honeybadger. You can customize the grouping for each exception by changing the error class name, component, or stack trace—or by sending a custom fingerprint. ## Anatomy of an error [Section titled “Anatomy of an error”](#anatomy-of-an-error) When your app reports an error to us, we make the details available on a web page that looks like this: 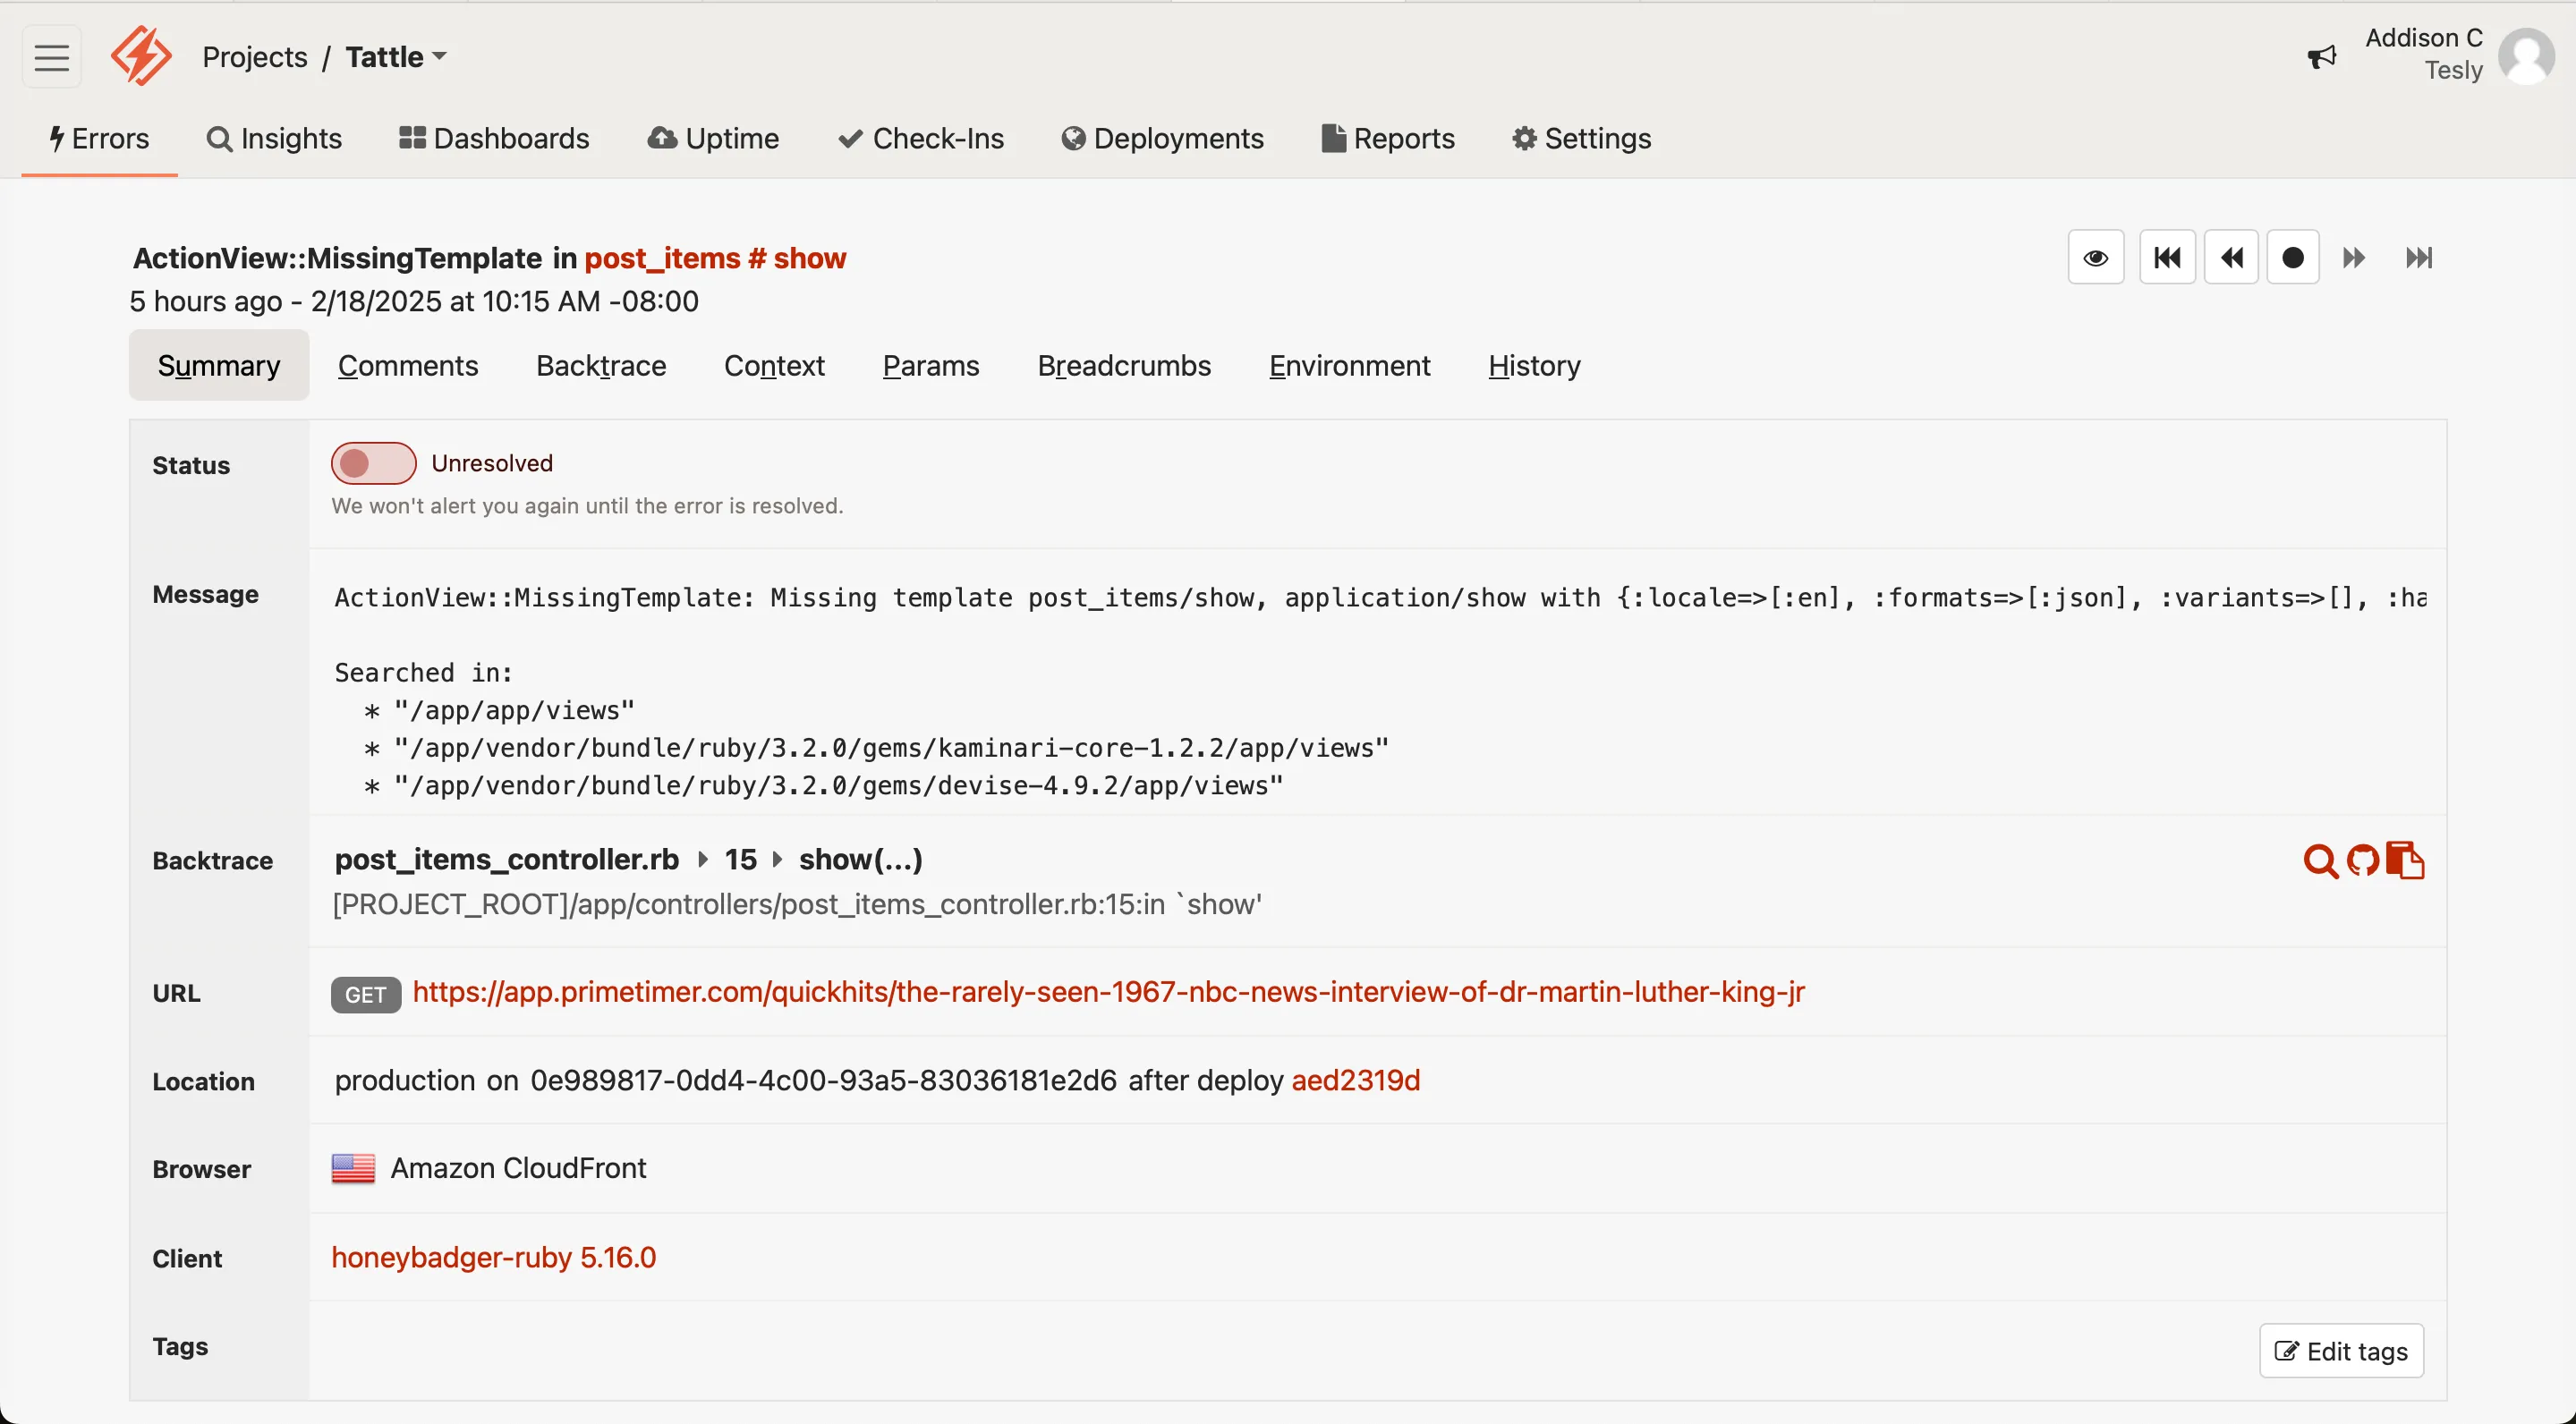 Yeah, it looks a little complicated. But once you understand what all the pieces are, you will see it is quite simple. Let’s inspect this page, piece by piece. ### Navigating occurrences [Section titled “Navigating occurrences”](#navigating-occurrences) 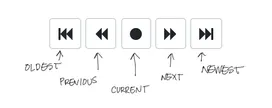 Honeybadger groups identical errors together. Using our navigation bar, you can still navigate between each individual occurrence (or notice, as we also call them) of the error. ### Resolve / unresolve [Section titled “Resolve / unresolve”](#resolve--unresolve) When an error is marked “unresolved” we will not send you any additional notifications when it re-occurs. Errors are auto-resolved on deploy by default, but that is [configurable](/guides/projects/#general-project-settings).  ## Error actions [Section titled “Error actions”](#error-actions) Here you can perform many of the actions available to your error. Also, as you set up [integrations](/guides/integrations/) for the project, any that can link back to the error (say, an issue tracker like GitHub) can be managed here.  ### Assign an error [Section titled “Assign an error”](#assign-an-error) Using this button, you can assign the error currently viewed to any user in the project. This can later be used to search by assignment, or, with assignment notifications enabled, to inform a user that a new error has been assigned to them. ### Pause or ignore an error [Section titled “Pause or ignore an error”](#pause-or-ignore-an-error) 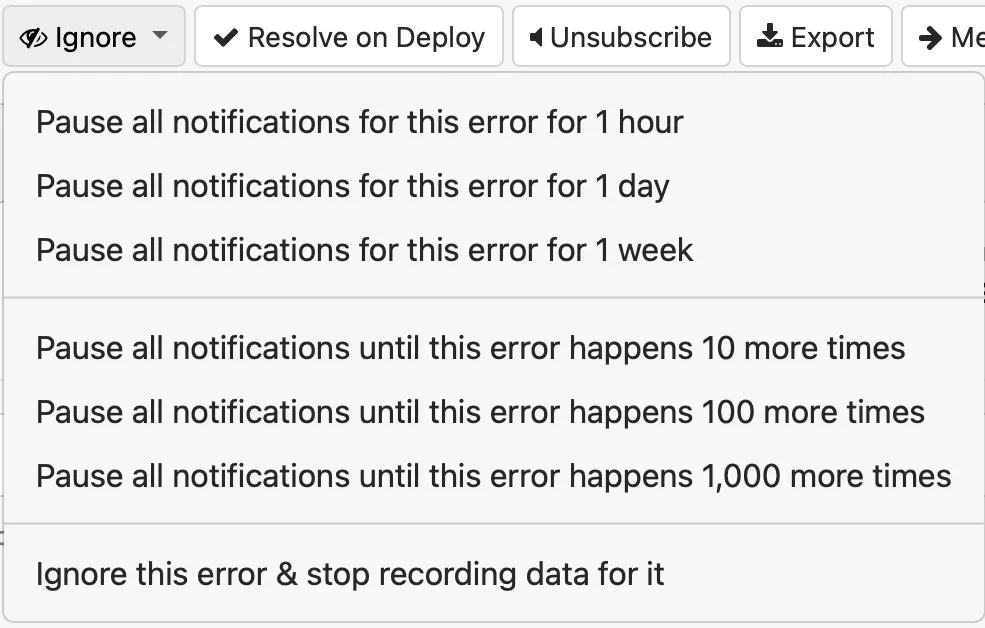 One of the more common actions used is to ignore the occurrences of an error. #### Pausing [Section titled “Pausing”](#pausing) You can choose to “Pause” for a time duration or occurrence count. We will still record the occurrences, we just will not notify you. Pausing notifications does not affect the resolved/unresolved status of an error. If you resolve an error while notifications are paused, the next occurrence will still mark it as unresolved — you just won’t be notified about it. When notifications resume depends on the type of pause: * **Time-based pause:** Notifications resume on the first occurrence received after the time period has elapsed. * **Count-based pause:** Notifications resume on the occurrence that exhausts the count (e.g., the 10th occurrence when paused for 10). In both cases, a notification will be sent even if the error was already reopened by an earlier occurrence during the pause. #### Ignoring [Section titled “Ignoring”](#ignoring) When you “ignore” an error we will stop recording altogether, so it will not go against your quota. ### Resolve on deploy [Section titled “Resolve on deploy”](#resolve-on-deploy) By default, Honeybadger resolves all the errors in your project when you [report a deployment](/api/reporting-deployments/), causing new alerts to be sent for any of the errors that re-occur. You can turn off this behavior by unchecking the “Resolve on deploy” checkbox in [Project Settings](/guides/projects/#general-project-settings). When turned off, there is a new action in the [actions area](#error-actions) of the error detail page, allowing you to resolve individual errors on the next deploy.  To find errors waiting to be resolved on the next deploy, use the `is:pending_resolution` [search token](/guides/errors/search/#examples). ### Unsubscribe [Section titled “Unsubscribe”](#unsubscribe) Unsubscribing from an error disables it from sending notifications - but only for the user currently viewing the error. To silence it for all users, use the pause action. ### Export an error [Section titled “Export an error”](#export-an-error) The Export dropdown allows you to download the data for the current error as [Markdown](https://daringfireball.net/projects/markdown/), or export a JSON file of all occurrences via email. The Markdown version includes the error summary, stack trace, environment details, and breadcrumbs for the current error formatted in standard Markdown syntax compatible with GitHub, Notion, Google Docs, and other Markdown-capable tools.  When exporting all occurrences, you’ll receive an email to download a JSON file containing the data. This file is a [newline-delimited JSON file](https://en.wikipedia.org/wiki/JSON_streaming#Newline-delimited_JSON), which means each line is a valid JSON object. Each of those JSON objects has the data (parameters, context, etc.) for a single occurrence of the error. ### Merge errors [Section titled “Merge errors”](#merge-errors) Using the merge action, you can combine one error with another error. This takes all the existing notices from the “donor” error and adds them to the “receiver” error’s notice history. ### Share URL [Section titled “Share URL”](#share-url) Sharing the URL of the error will give you a link to a webpage displaying the error. This webpage does not allow for any actions, comments, or the ability to resolve the error. ### Delete [Section titled “Delete”](#delete) This removes the error and all of the notice history for that error. This is especially useful if your error information happens to accidentally include sensitive information. New instances of the error will appear again on a new error page. ### Action integrations [Section titled “Action integrations”](#action-integrations) GitHub and other project management integrations will add another action button - in GitHub’s case the button is labeled “Create issue”. Other integrations will behave similarly. ## Anatomy of an error, continued [Section titled “Anatomy of an error, continued”](#anatomy-of-an-error-continued) Each error page contains a substantial amount of detail related to the error itself and a history of all the actions done to the error. You can see how many times it was resolved or merged and who performed each action. From the top of the error page, you can see all of the categories and can click to any of them. There’s even a keyboard shortcut for each category.  ### Notices [Section titled “Notices”](#notices) The Notices section allows you to see the distribution of occurrences over time. You can constrain the dates and filter using the same search criteria as our [error search](/guides/errors/search/). When you view an error after doing a search, the search criteria will be applied to the notice list. 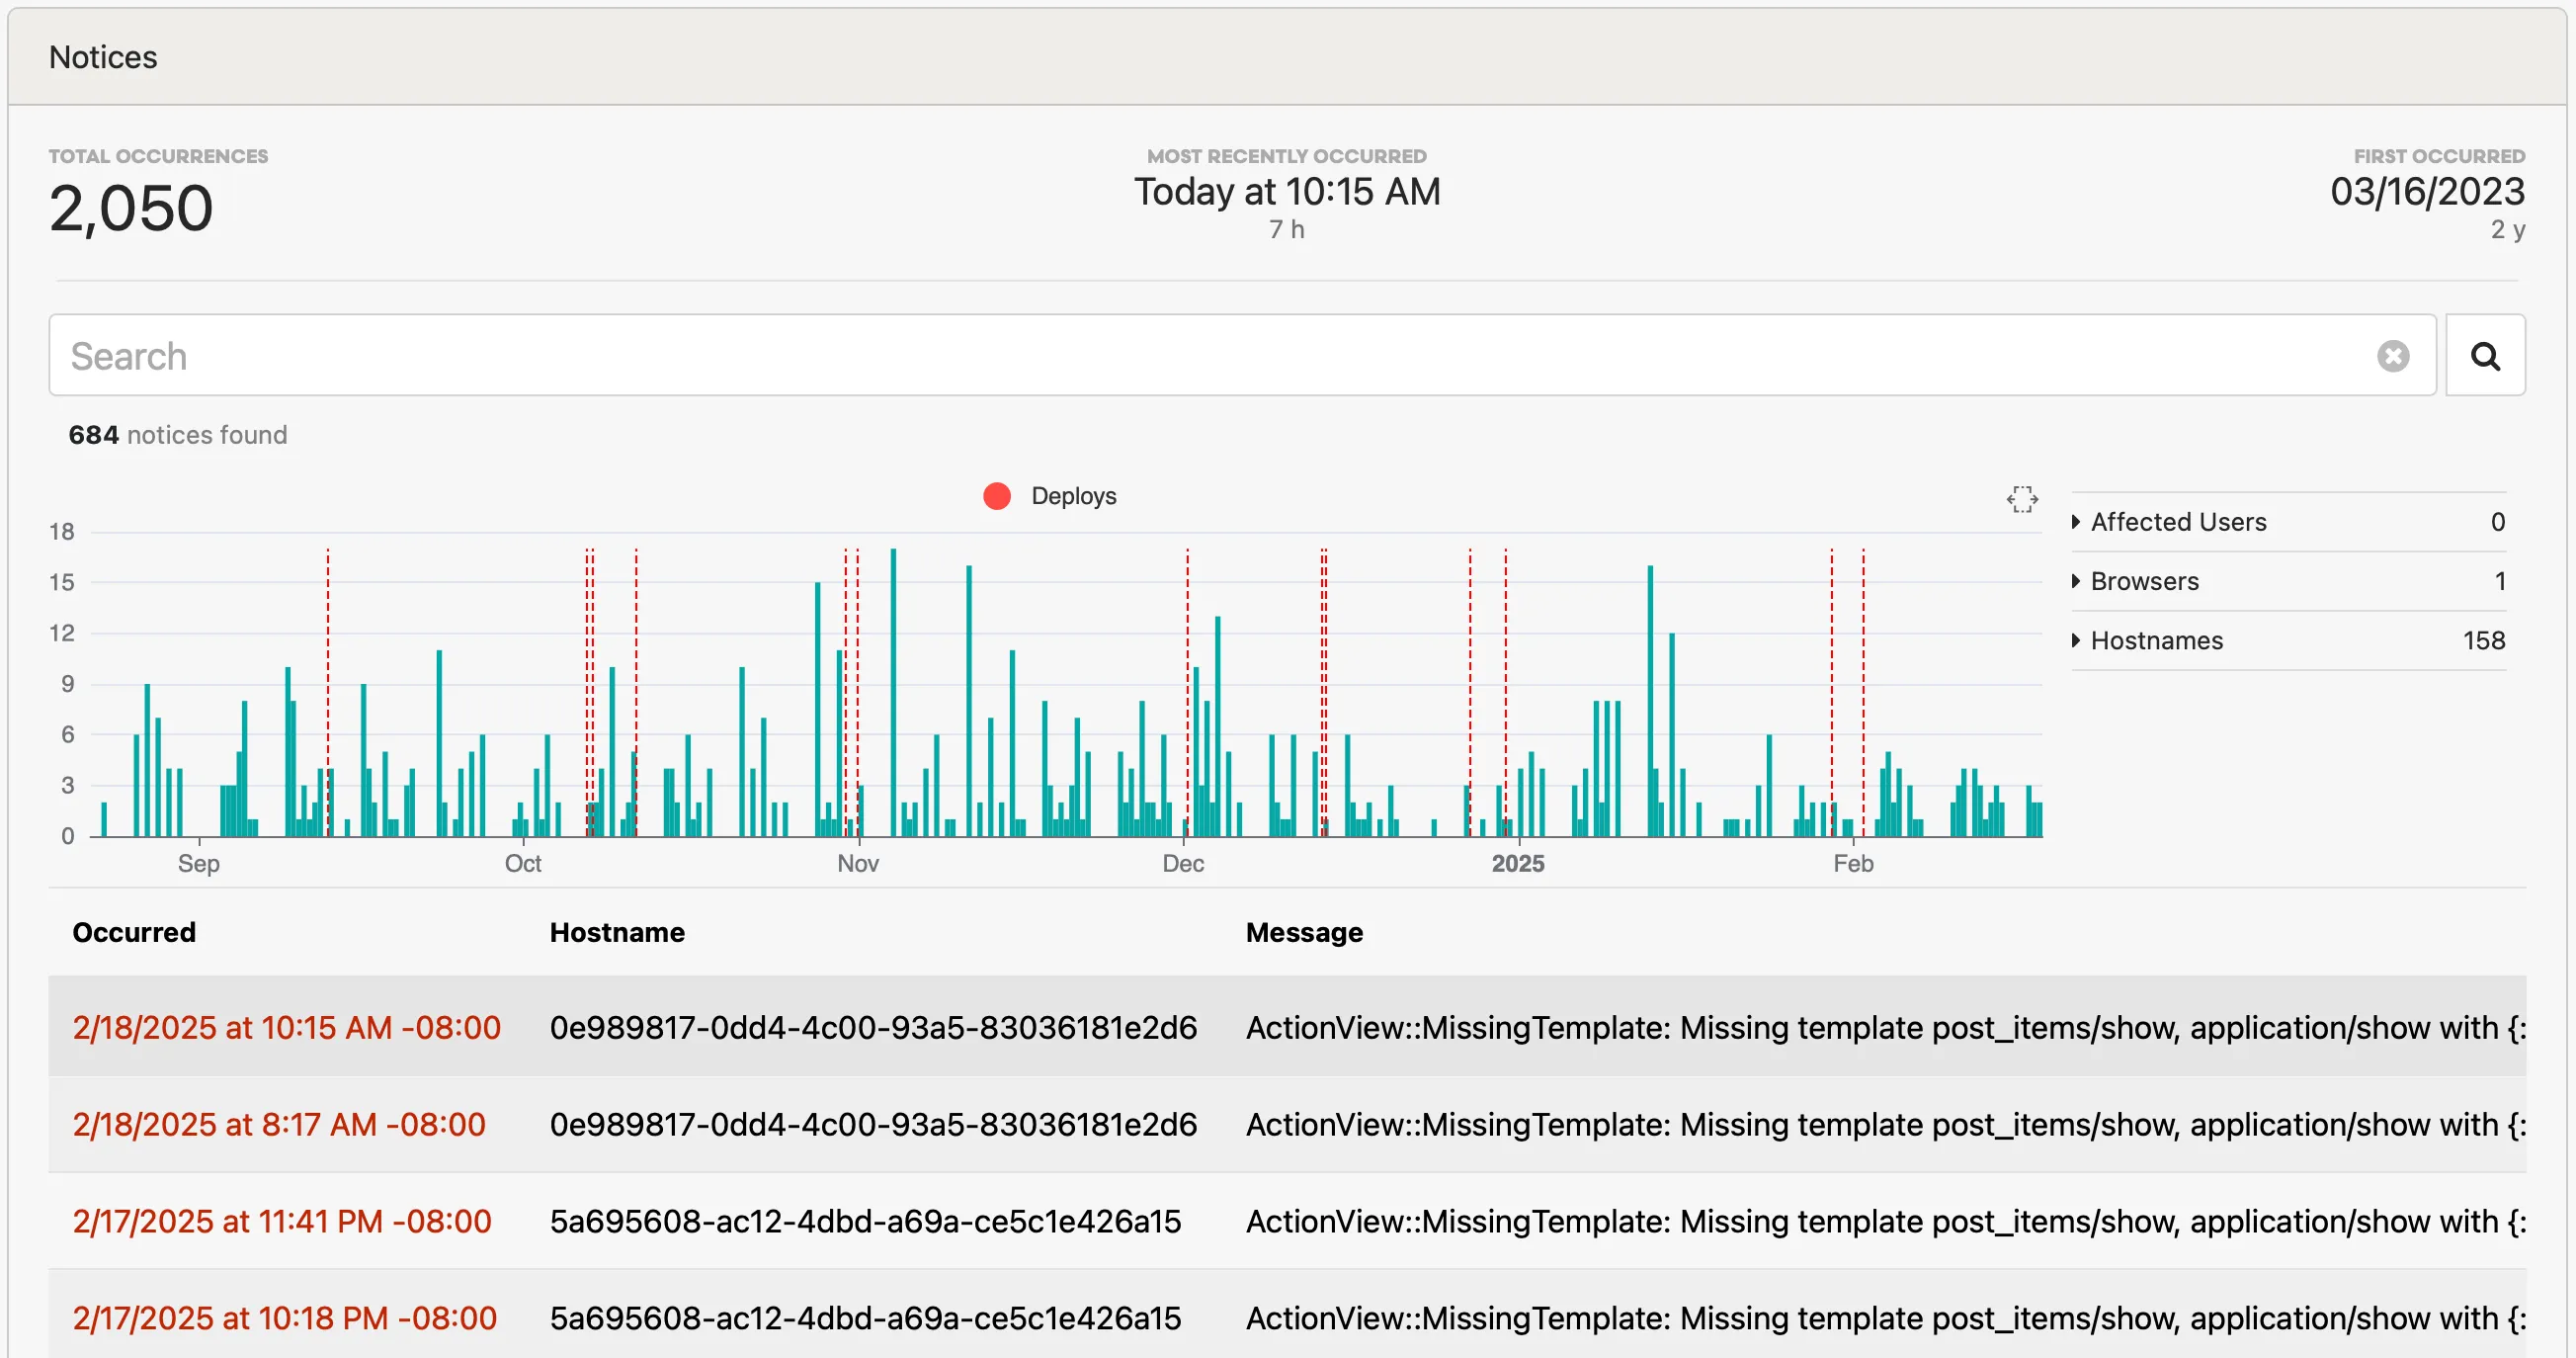 ### Comments [Section titled “Comments”](#comments) Communicate with team members, or record notes to retain context around an error. Your comments can be formatted in GitHub-flavored Markdown. 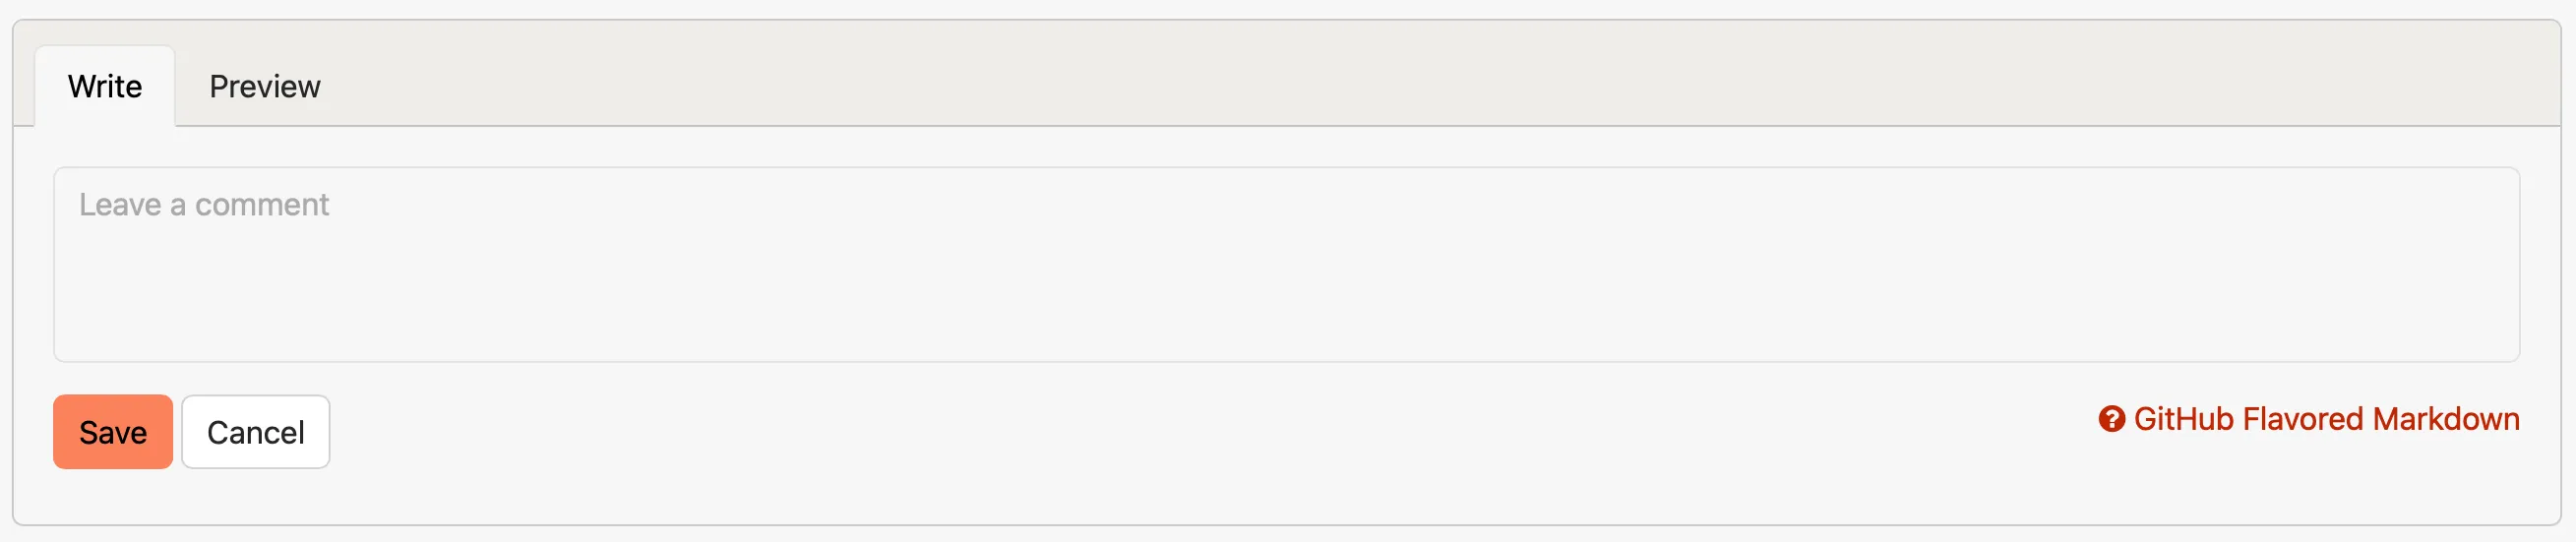 Type `@` in a comment to mention a teammate. An autocomplete menu lets you pick from the project’s members, and mentioned users are notified by email and by in-app notification (subject to their personal alert preferences). Editing a comment to add a new mention also notifies the newly-mentioned user. ### Backtrace [Section titled “Backtrace”](#backtrace) Each line in the backtrace links to the GitHub or Bitbucket repo. You can even click a button to open the file in your [local editor](#local-edits). 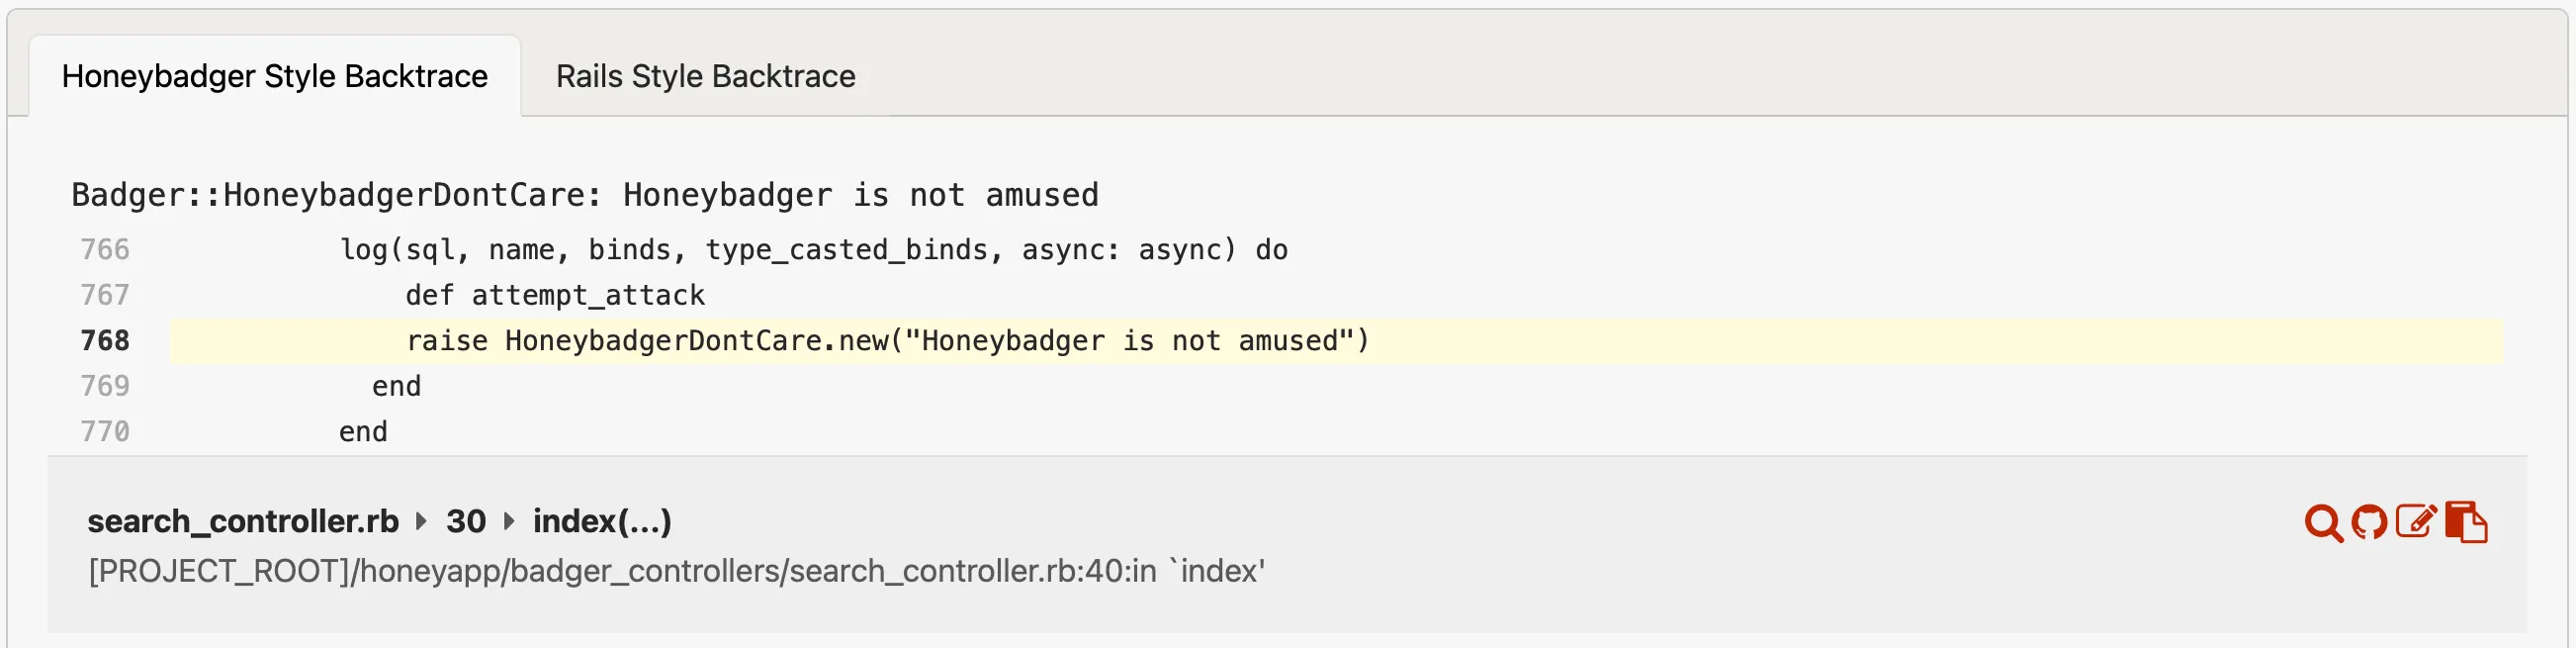 ### Request params, cookies, ENV, etc. [Section titled “Request params, cookies, ENV, etc.”](#request-params-cookies-env-etc) When an error occurs during a web request, we record all the relevant debug info like params, cookies, the session, etc. 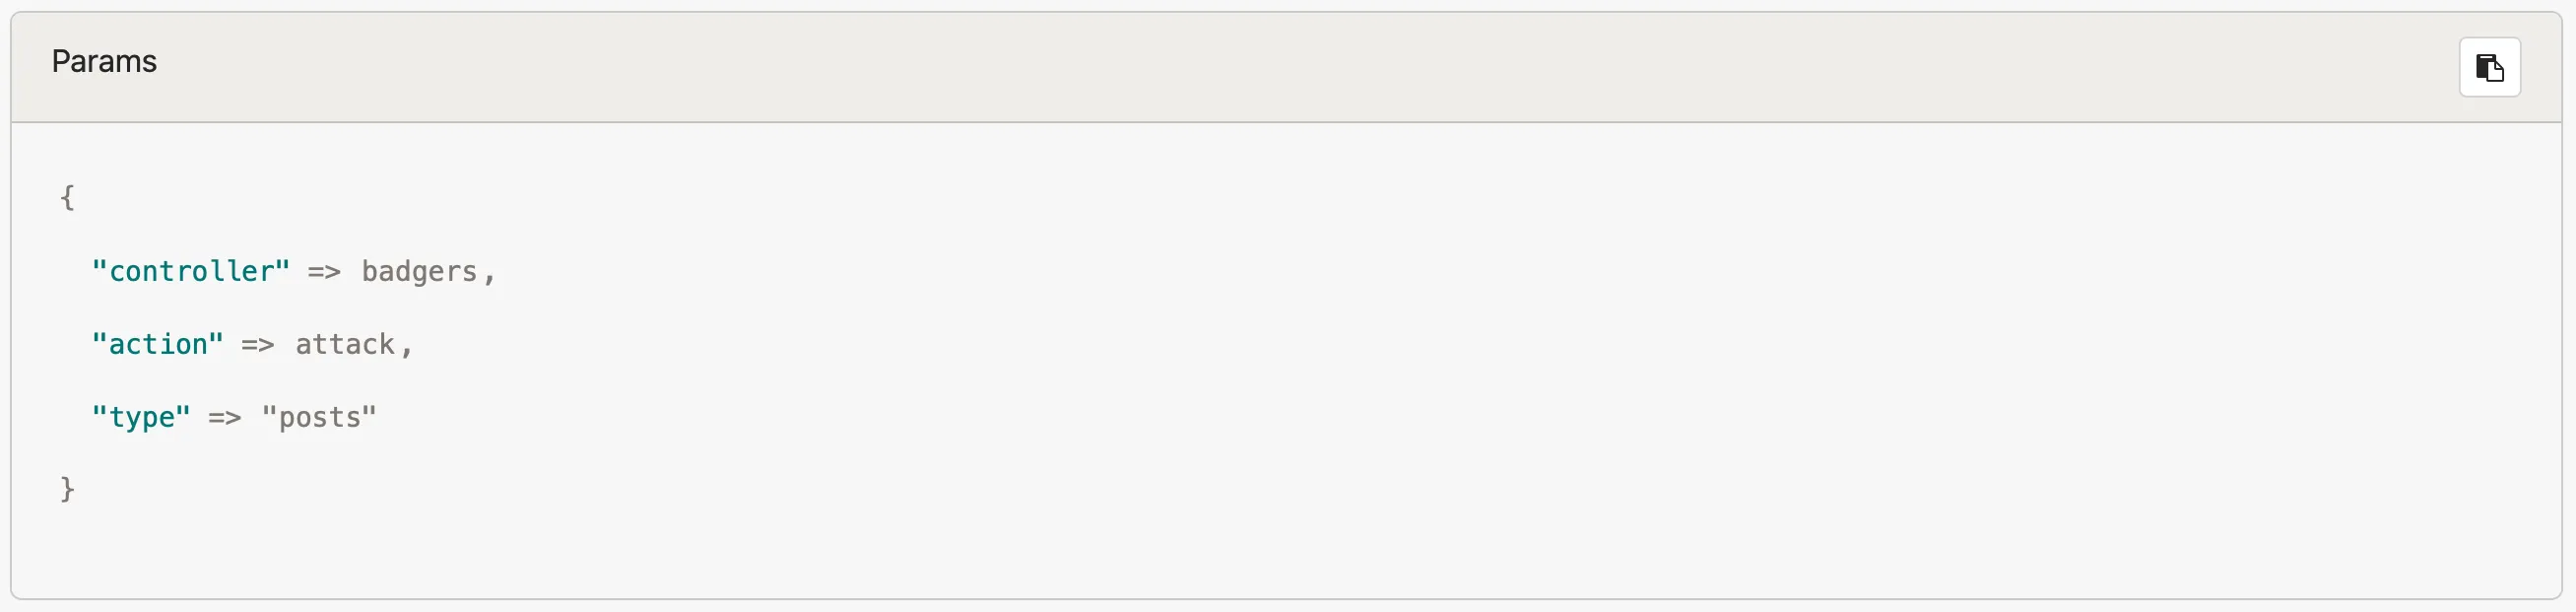 ### Context data [Section titled “Context data”](#context-data) Our clients support providing a special set of data called **context**. This data is provided by you to help with debugging. You can use our [search functionality](/guides/errors/search/#search-by-request) to find errors with specific context.  ## Browsing errors [Section titled “Browsing errors”](#browsing-errors) Once you start collecting errors, it can be difficult to keep track of them. To make it easier, we’ve built a great interface for browsing and searching errors. 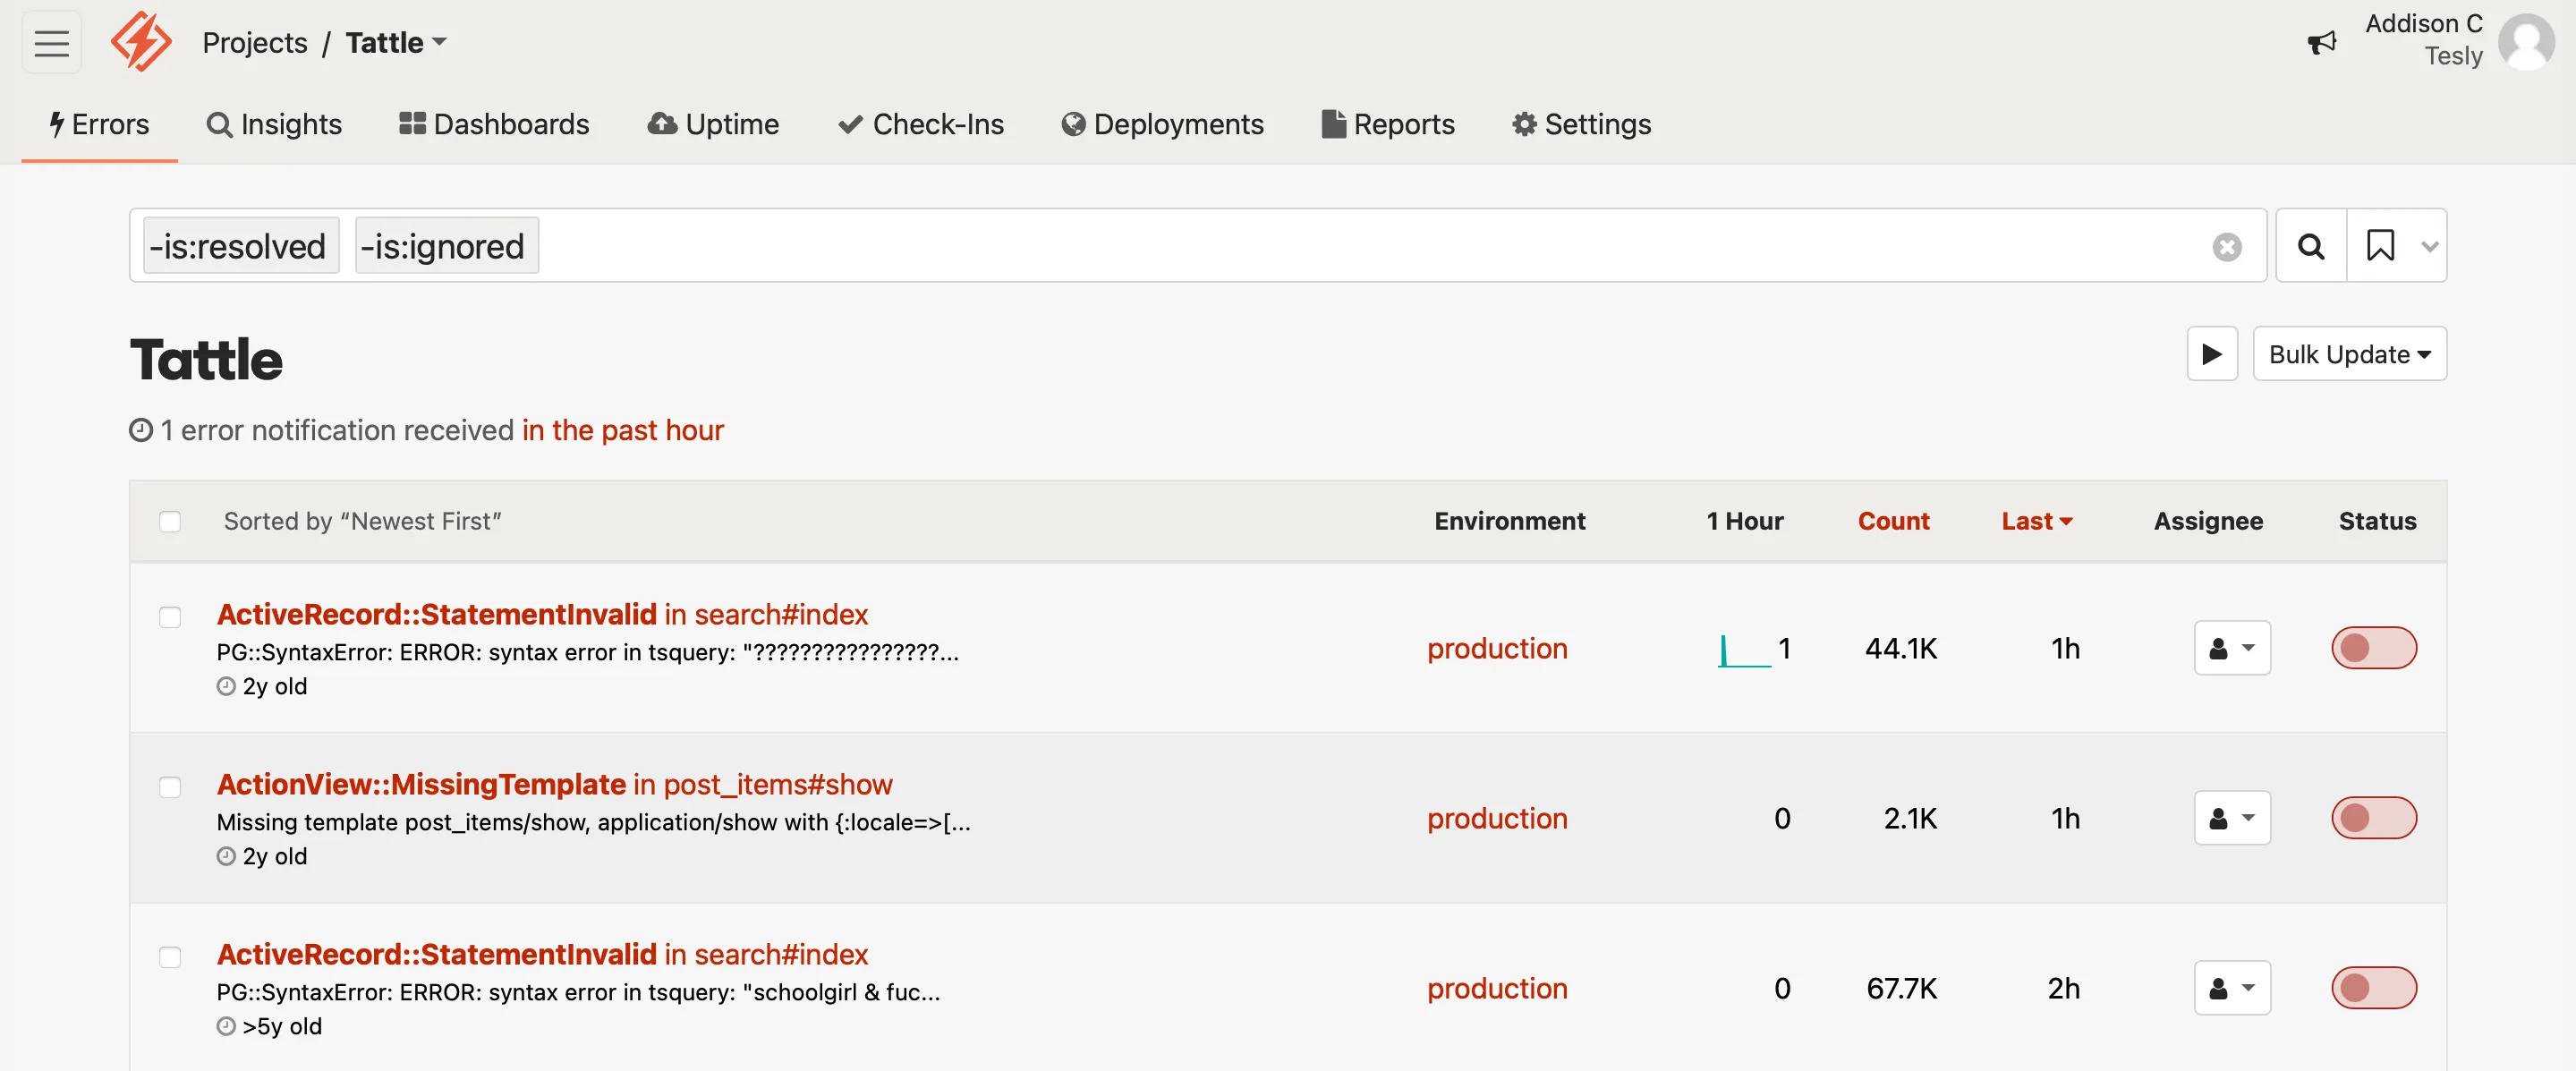 ### Search [Section titled “Search”](#search) With advanced search, you can search by any field of params, environment, cookies or the session. Check out our dedicated [search guide](/guides/errors/search/) for more info. ### Batch actions [Section titled “Batch actions”](#batch-actions) 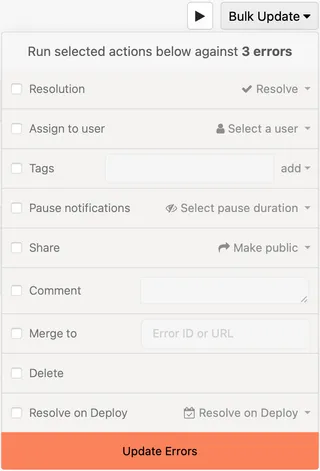 You can use the *Bulk Update* dropdown to update multiple errors simultaneously. You can apply actions to all search results (this is the default), or you can use the checkboxes in the error list to apply the actions to selected errors. 1. Use the search to select which errors you’d like change. 2. Click on “Actions” and select one or more options from the drop-down. #### Merging by batch [Section titled “Merging by batch”](#merging-by-batch) You can merge two or more errors to create a single error. There are two ways to merge errors: 1. Click the [Merge](#merge-errors) button in the [*Actions*](#error-actions) panel on the error detail page, as described above. 2. Select two or more errors to merge from the [error index page](#browsing-errors) using the checkboxes and use the “Merge to” action in the [*Bulk Update*](#batch-actions) dropdown. Note: The *Bulk Update* method can merge up to ten thousand error occurrences simultaneously. You can perform multiple updates if necessary. ## Local edits [Section titled “Local edits”](#local-edits) One of the advanced features in Honeybadger is configuring your local editor settings so that we can display links to open files locally when showing you an error backtrace:  To configure your editor, [visit the Local Editor tab under My Settings](https://app.honeybadger.io/users/edit#editor). Select the editor you use (if you use a different editor that supports opening files via a custom protocol, [let us know about it](https://www.honeybadger.io/pages/contact)). Next, enter the absolute path to each project you wish to enable local editor links for and click “Save” at the bottom. Re-visit your error pages - they should now have the “Open in editor” links! Most editors work without any additional setup, but Sublime and Visual Studio Code don’t ship with a custom protocol by default. In order to make them work, you’ll need to install one of these libraries: * [Sublime 2 handler for OS X](https://github.com/asuth/subl-handler) * [Sublime 3 handler for OS X](https://github.com/saetia/sublime-url-protocol-mac) * [Visual Studio Code handler](https://github.com/robyoder/vscode-handler) If you’re using Atom, make sure you’re on version 1.23 or later for this to work. Disclaimer: We do not endorse nor support these libraries; they are 3rd party open source software. ## Content Security Policy reports [Section titled “Content Security Policy reports”](#content-security-policy-reports) If you use [Content Security Policy (CSP)](https://developer.mozilla.org/en-US/docs/Web/HTTP/CSP) headers to help mitigate XSS attacks, you can use Honeybadger to track policy violations. You can configure the required headers via code when using [Rails](/lib/ruby/integration-guides/rails-exception-tracking/#content-security-policy-reports) or [Sinatra](/lib/ruby/integration-guides/sinatra-exception-tracking/#content-security-policy-reports), or you can configure your web server or framework to emit the headers. Either way, configuring CSP reporting requires specifying the `report-uri` directive:
```plaintext
Content-Security-Policy: ...; report-uri https://api.honeybadger.io/v1/browser/csp?api_key=PROJECT_API_KEY&env=production
Content-Security-Policy-Report-Only: ...; report-uri https://api.honeybadger.io/v1/browser/csp?api_key=PROJECT_API_KEY&report_only=true&env=production
```
The `env` and `report_only` parameters are optional. When `report_only` is true, CSP report payloads will show up as “CSP Report” in our UI; otherwise, the label will be “CSP Error”. Since CSP violations can be noisy, we strongly suggest you track them in a separate Honeybadger project.
# Error search
> All the ways you can find your errors.
Honeybadger provides powerful search features that let you easily find previously-occurred errors by type, location, meta-data and many other attributes. You can search for errors in a single project, or across all projects. To search by error type and message, you can simply enter those into the search box. More advanced searches are accomplished via a special query language. We’ve provided a query builder that lets you construct useful queries quickly and easily. ## How to search [Section titled “How to search”](#how-to-search) Enter a free-form text value, or one or more `key:"value"` tokens into the search box. Then press enter, or click on the magnifying glass button. Tokens are separated by spaces. Single and double quotes are allowed. Example query: `john class:UserError -tag:wip -tag:pending component:"UsersController" action:'update'`. Because these search queries can become quite complex, we’ve included a query builder that allows you to construct them without much typing. The query builder automatically opens when you focus the search box. 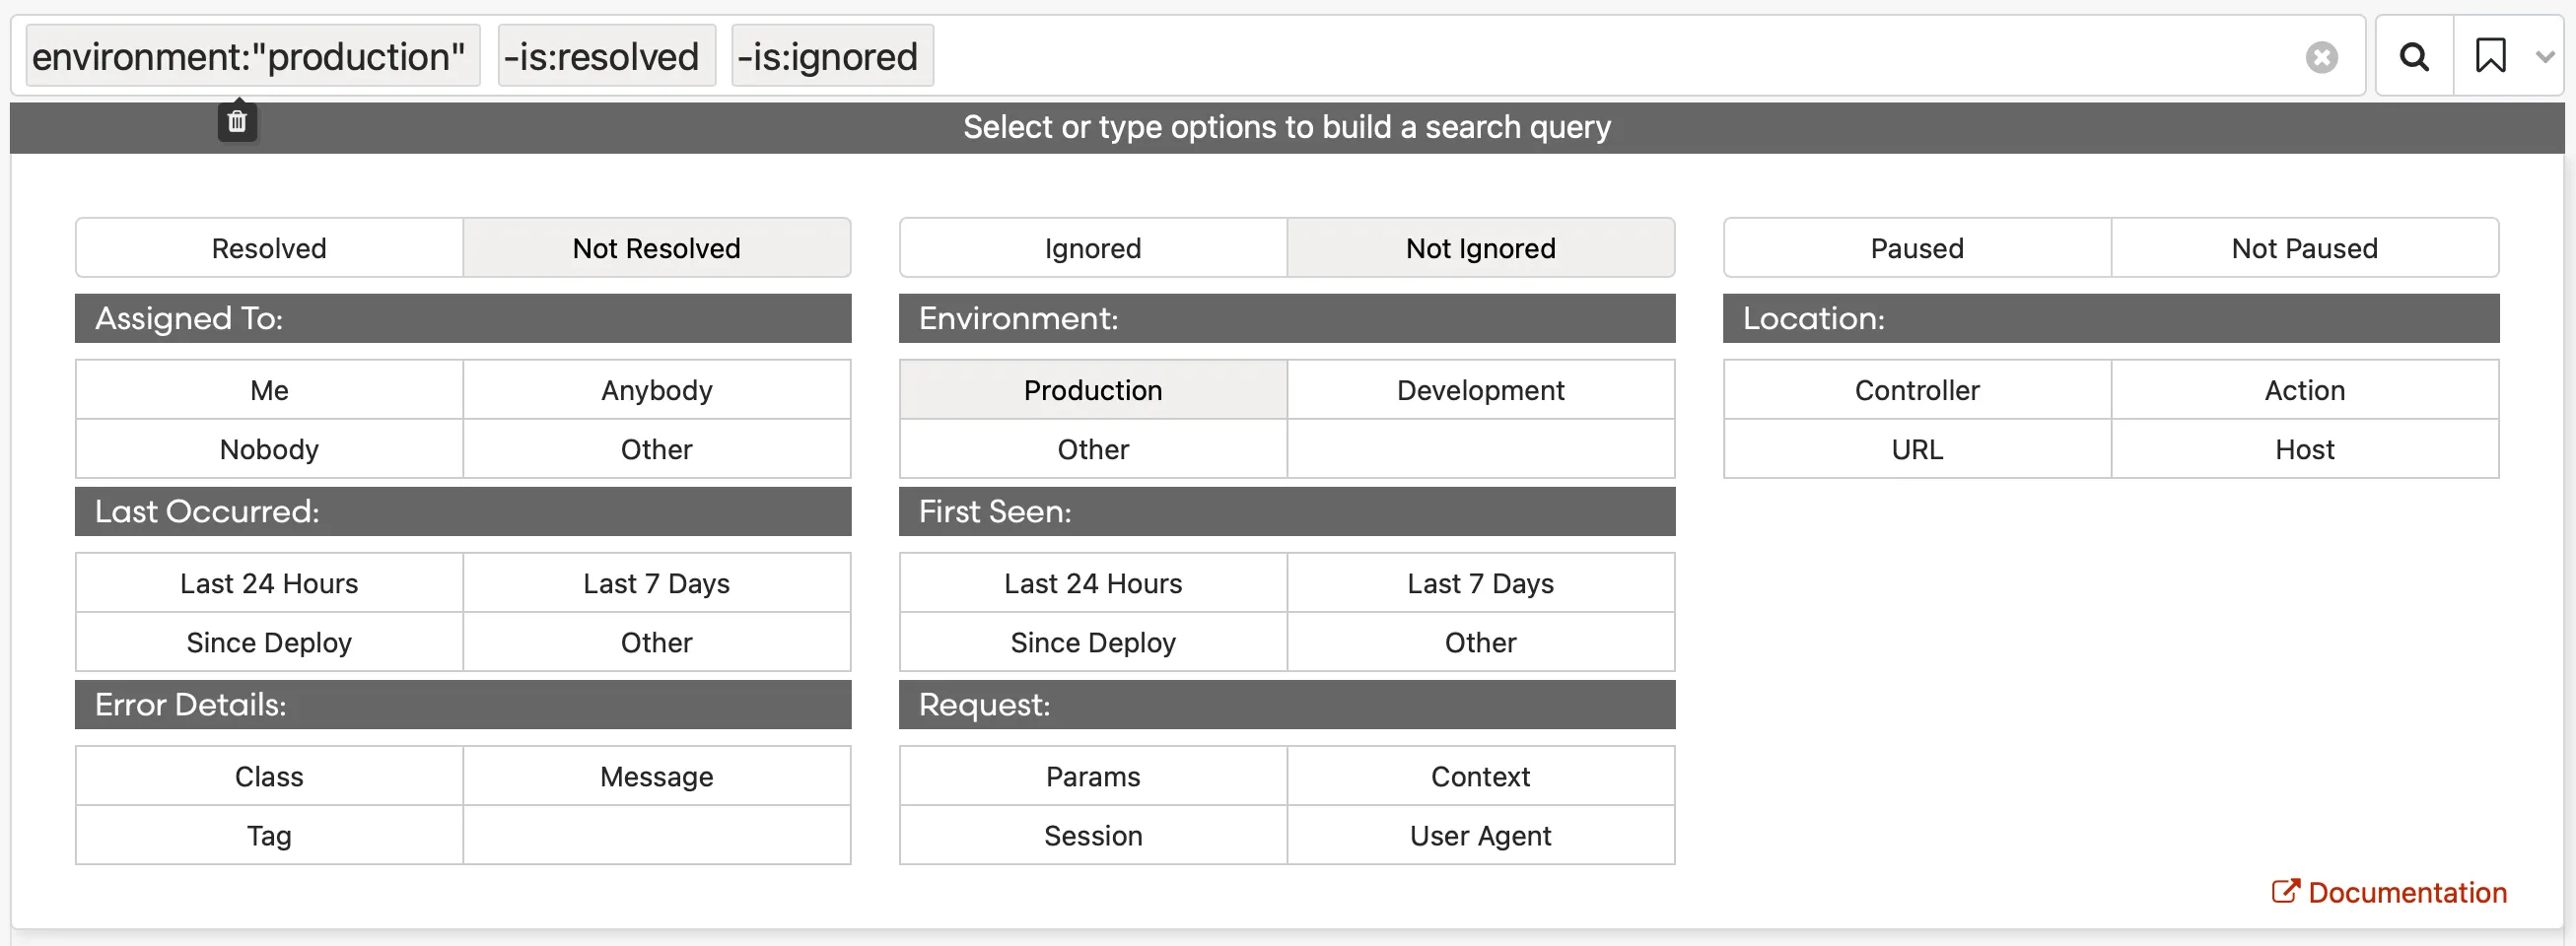 ## Natural language search [Section titled “Natural language search”](#natural-language-search) You can search for errors without writing the query yourself. Click the lightbulb icon next to the search box to open the “Describe your search” panel, then describe what you want to find. Click Translate and Honeybadger will turn it into a search query. 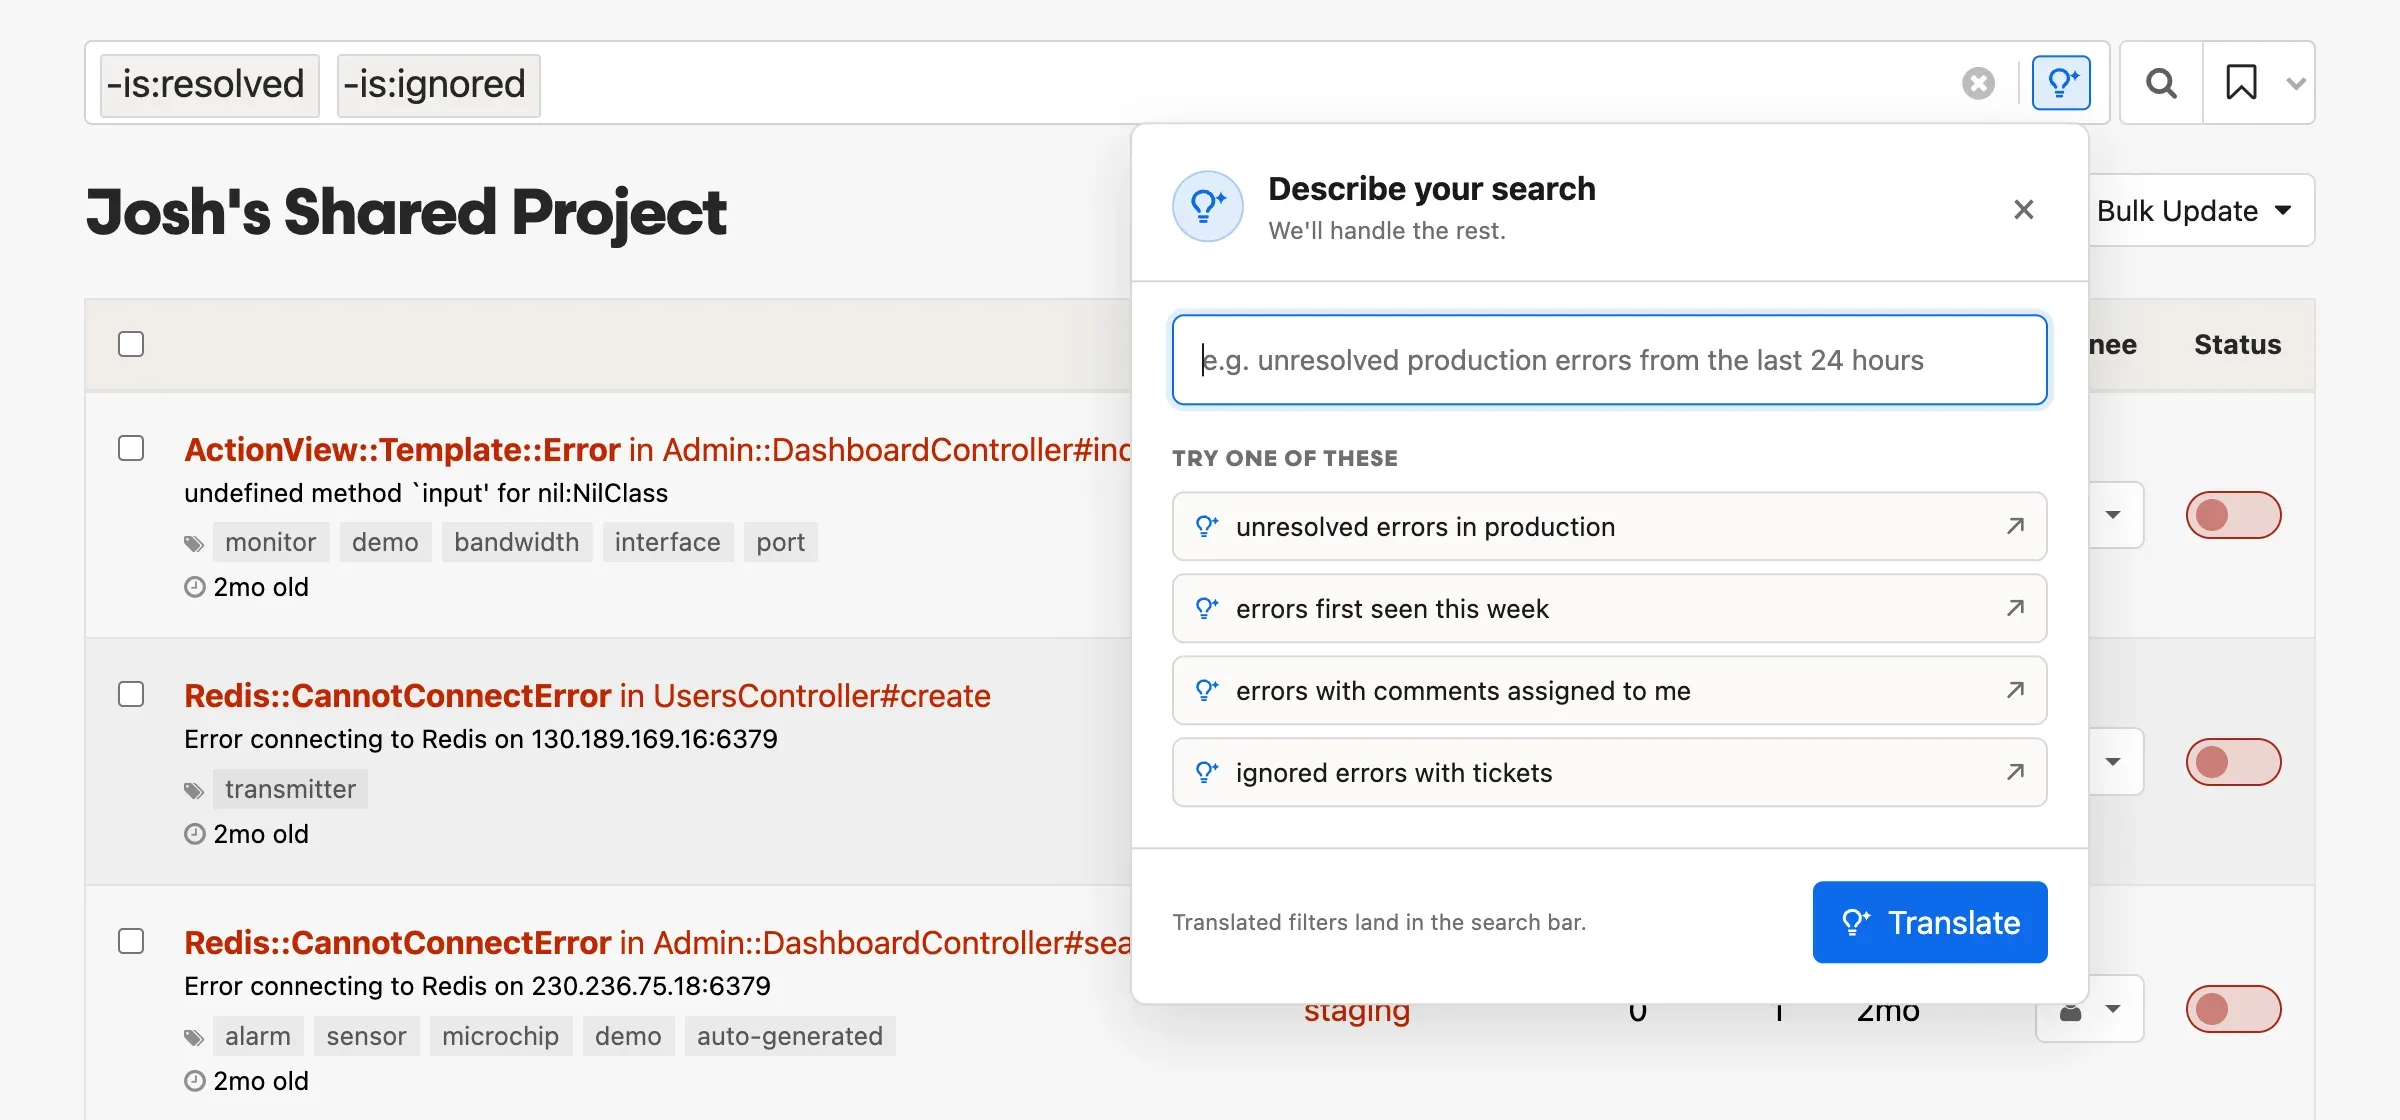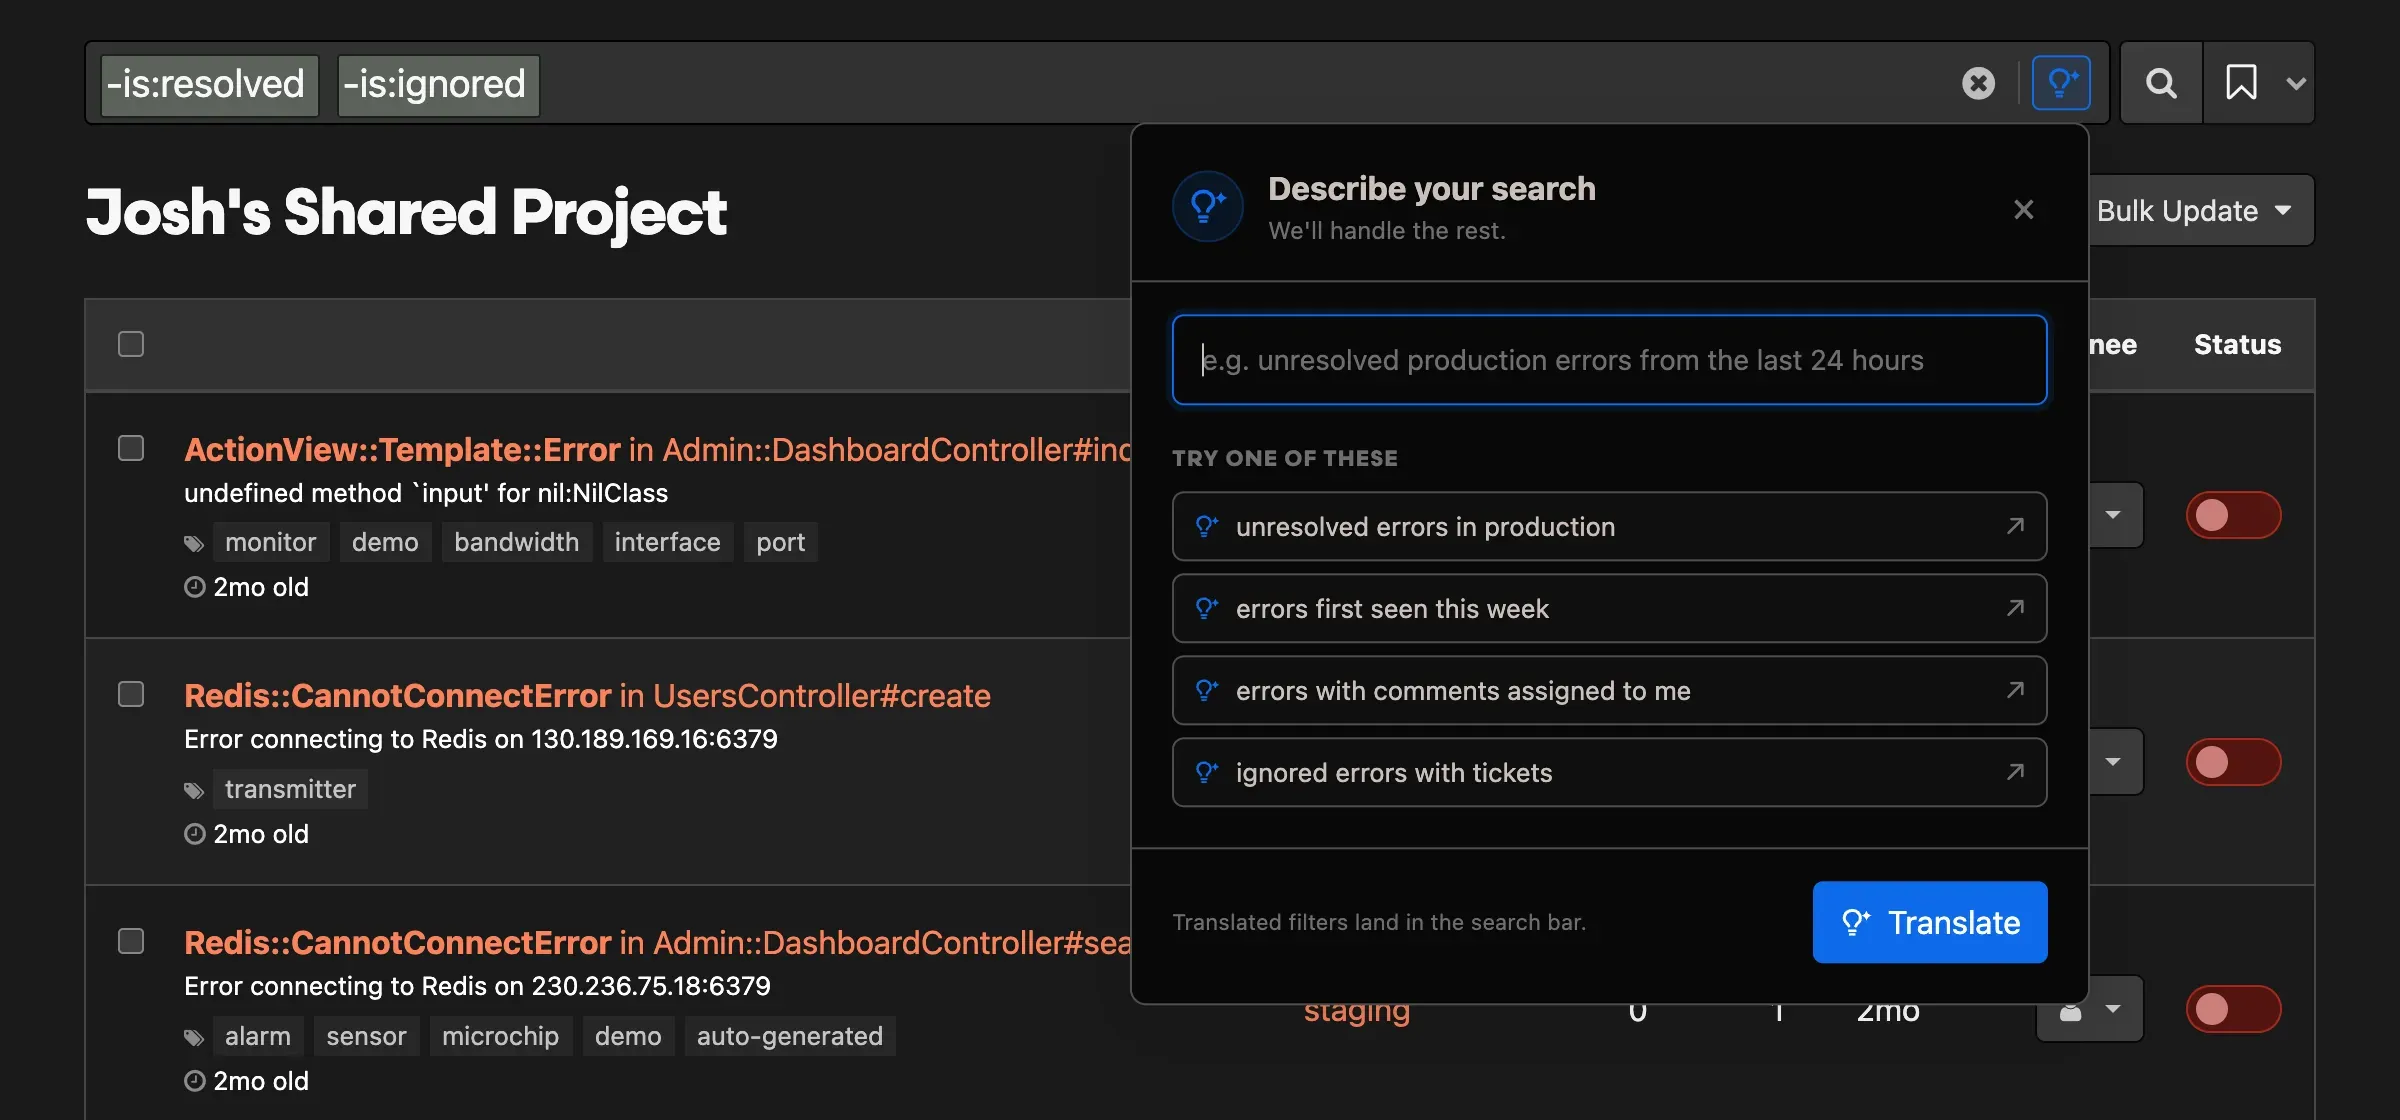 The translated filter is added to the search bar and runs immediately. You can then edit the query by hand or adjust it with the query builder. This can also be a useful way to learn the query syntax. **Note:** The NL search uses an LLM, so it may not always get things right. If the translations are not what you expected, please feel free to [reach out to support](mailto:support@honeybadger.io). ## Keyboard navigation [Section titled “Keyboard navigation”](#keyboard-navigation) Use the following keyboard shortcuts in the search box as you edit your query. Additional context-sensitive options will be shown to you as you type. | Key | Response | | ------------- | -------------------------------------------------- | | enter | Submits form | | tab | Tabs to next token and selects value inside quotes | | shift-tab | Reverse-cycles selected token | | mod backspace | Deletes selected token | | escape | Closes hint | ## Keyboard shortcuts [Section titled “Keyboard shortcuts”](#keyboard-shortcuts) Quickly search errors using the following keyboard shortcuts while on the error page in the project. Note that these shortcuts immediately trigger a page load and will not preserve the state of the search builder. | Key | Response | | ------ | ------------------------------------ | | / | Focus search box | | A or a | Show resolved And Unresolved Errors | | U or u | Show Unresolved Errors | | R or r | Show Resolved Errors | | M or m | Show Errors Assigned to Me | | T or t | Show All Users’ Errors | | J or j | Jump to another project \* | | E or e | Show errors in all environments \*\* | \*This shortcut can be used on any page of the project. \*\*Use first character of environment name to filter by environment. ## How tokens are combined [Section titled “How tokens are combined”](#how-tokens-are-combined) When combining different tokens, we use AND. So `class:MyError assignee:myemail@domain.com` searches for `MyError` instances that are assigned to me. When combining multiple values for the same token, we use OR. For example, `class:"Foo" class:"Bar" `will return errors with class `Foo` OR `Bar`. There’s one minor exception to this rule. Negative tokens, i.e. tokens preceded by `-` will be combined with AND. Here are a few examples: | Example query | Searches | | --------------------------------------- | --------------------------------------------------- | | `class:"Foo" is:resolved` | Resolved errors with class `Foo` | | `-class:"Foo" is:resolved` | Resolved errors without class `Foo` | | `-class:"Foo" -is:resolved` | Unresolved errors without class `Foo` | | `class:"Foo" class:"Bar" is:resolved` | Resolved errors with class `Foo` OR class `Bar` | | `-class:"Foo" -class:"Bar" is:resolved` | Resolved errors without class `Foo` AND class `Bar` | ## Examples [Section titled “Examples”](#examples) ### Search by state [Section titled “Search by state”](#search-by-state) Search errors that are resolved, ignored, paused, or pending resolution, and the inverse of those states. By default, Honeybadger sorts all errors by `-is:ignored` and `-is:resolved`, showing you everything that has not been set as ignored or resolved. These tokens are automatically populated in the search box. | Example query | Searches | | ------------------------ | -------------------------------------------------------- | | `is:resolved` | Resolved errors | | `-is:resolved` | Unresolved errors | | `is:paused` | Paused errors | | `-is:paused` | Errors that aren’t paused | | `is:ignored` | Ignored errors | | `-is:ignored` | Errors that aren’t ignored | | `is:pending_resolution` | Errors that are set to be resolved on the next deploy | | `-is:pending_resolution` | Errors that aren’t set to be resolved on the next deploy | 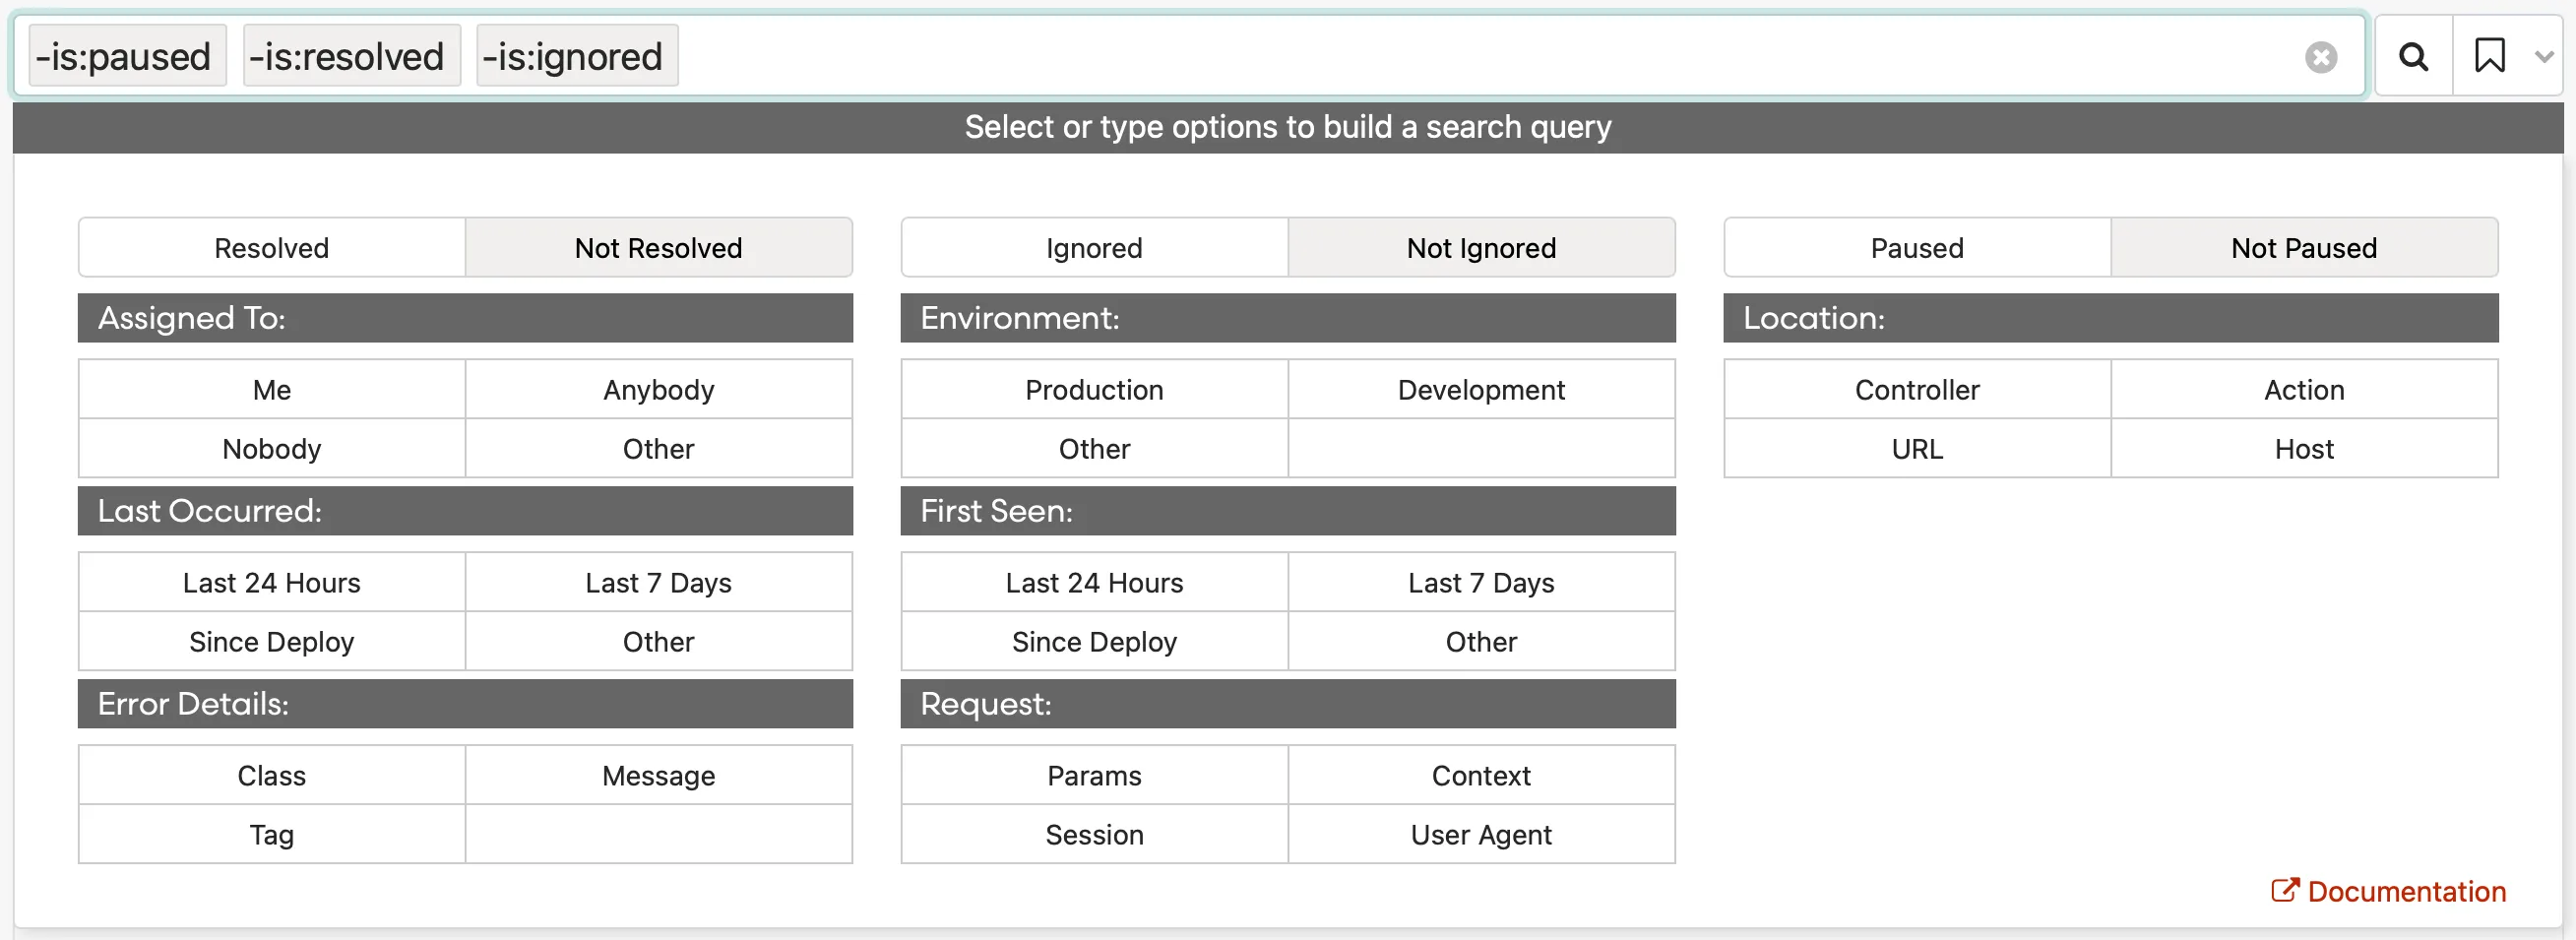 ### Search by assignee [Section titled “Search by assignee”](#search-by-assignee) Errors can be assigned to team members, and results can be refined by assignment. Tokens can be combined to search errors assigned to multiple team members. | Example query | Searches | | ---------------------------- | ---------------------------------------- | | `assignee:"nobody"` | Unassigned errors | | `assignee:"anybody"` | Errors assigned to anyone | | `assignee:"jane@email.com"` | Errors assigned to a specific person | | `-assignee:"jane@email.com"` | Errors not assigned to a specific person | If other, choose a team member from the drop-down list or begin typing to trigger auto-complete. 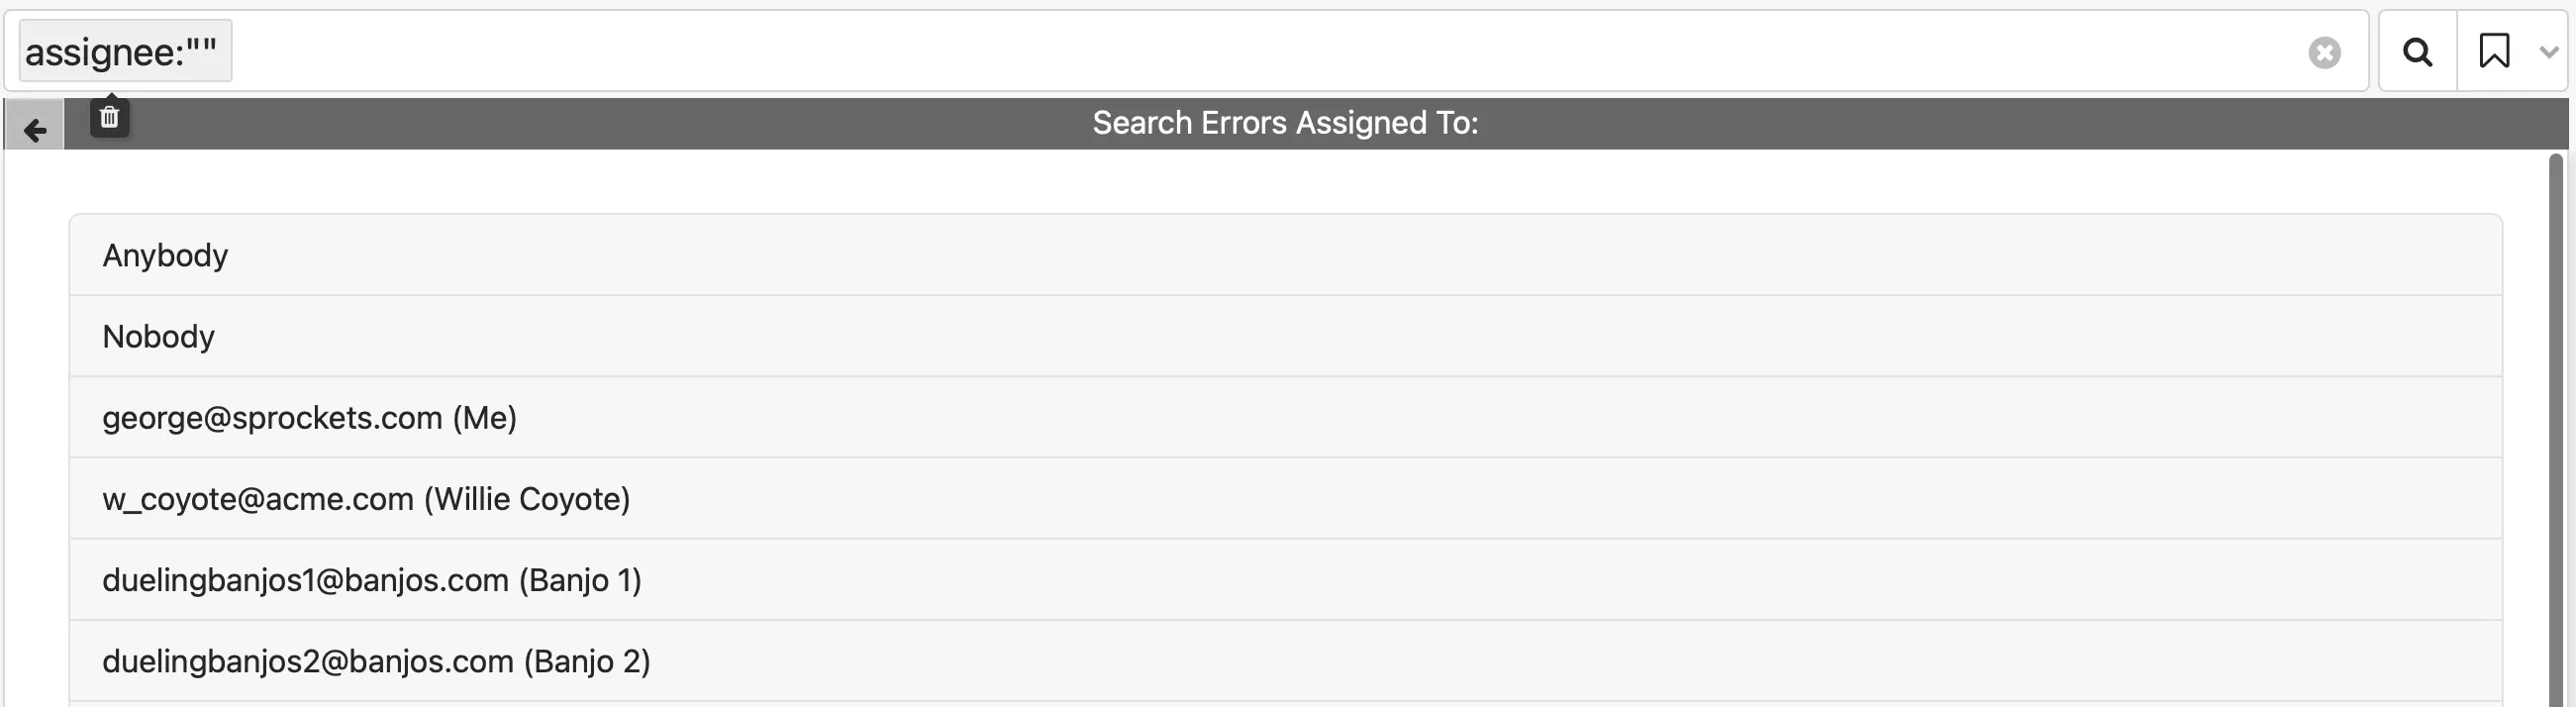 ### Search by environment [Section titled “Search by environment”](#search-by-environment) Search errors by your environment: | Example query | Searches | | ---------------------------------- | ----------------------------------- | | `environment:"production"` | Errors occurring in production | | `-environment:"production"` | Errors not occurring in production | | `environment:"development"` | Errors occurring in development | | `-environment:"development"` | Errors not occurring in development | | `environment:"custom_environment"` | Errors occurring in any environment | If other, choose an environment from the drop-down list or begin typing to trigger auto-complete.  ### Search by date [Section titled “Search by date”](#search-by-date) Search errors by their occurrence. Your timezone is automatically determined but can be changed manually. | Example query | Searches | | ----------------------------------------- | --------------------------------------------- | | `occurred.after:"YYYY-MM-DD 0:00 UTC-7"` | Errors last seen after an exact date | | `occurred.before:"YYYY-MM-DD 0:00 UTC-7"` | Errors last seen before an exact date | | `occurred.after:"24 hours ago"` | Errors last seen after a human-friendly date | | `occurred.before:"24 hours ago"` | Errors last seen before a human-friendly date | You can enter human-friendly dates like `today`, `this week`, or `July 1`, for example: `occurred.after:"this week"`. If you want to see errors that **last** occurred as of a certain date — that is, they haven’t occurred again since that date — you can use `last_occurred` instead of `occurred`, like so: `last_occurred.before:"1 week ago"`.  ### Search by first seen [Section titled “Search by first seen”](#search-by-first-seen) Search errors by when they were first seen. Your timezone is automatically determined but can be changed manually. | Example query | Searches | | ---------------------------------------- | ---------------------------------------------- | | `created.after:"YYYY-MM-DD 0:00 UTC-7"` | Errors first seen after an exact date | | `created.before:"YYYY-MM-DD 0:00 UTC-7"` | Errors first seen before an exact date | | `created.after:"24 hours ago"` | Errors first seen after a human-friendly date | | `created.before:"24 hours ago"` | Errors first seen before a human-friendly date | You can enter human-friendly dates like `today`, `this week`, or `July 1`, for example: `created.after:"September 12"`. ### Search by error details [Section titled “Search by error details”](#search-by-error-details) Search error by class, tag, and message. | Example query | Searches | | -------------------------------- | ----------------------------------------------------------- | | `class:"PermissionDeniedError"` | Errors with a certain class | | `-class:"PermissionDeniedError"` | Errors without a certain class | | `tag:"tag_example"` | Errors with a tag | | `-tag:"tag_example"` | Errors Without a tag | | `message:"404"` | Errors with a message | | `-message:"404"` | Errors without message text | | `has:ticket` | Errors with an associated GitHub issue, Asana task, etc. | | `-has:ticket` | Errors without an associated GitHub issue, Asana task, etc. | | `has:comment` | Errors that have comments from team members | | `-has:comment` | Errors that have no comments from team members | Class, tag, and message can be combined for specific results. For example, the query: `message:"NameError" class:"TextOrganizer" tag:"priority"` searches errors containing “NameError” from the TextOrganizer class with a “priority” tag. ### Search by location [Section titled “Search by location”](#search-by-location) Search errors by component, action, URL, file name, and host. | Example query | Searches | | ----------------------------------- | ---------------------------------------------------------------------------------------------------------------------------------- | | `component:"UsersController"` | Errors occurring in a controller/component | | `-component:"UsersController"` | Errors not occurring in a controller/component | | `action:"update"` | Errors occurring in an action | | `-action:"update"` | Errors not occurring in an action | | `request.url:"https://google.com"` | Errors occurring at a URL | | `-request.url:"https://google.com"` | Errors not occurring at a URL | | `request.host:"api.yoursite.com"` | Errors occurring in an application with this in the HTTP\_HOST environment variable (the Host: header provided by the browser) | | `-request.host:"api.yoursite.com"` | Errors not occurring in an application with this in the HTTP\_HOST environment variable (the Host: header provided by the browser) | | `file:somefile.rb` | Errors occurring in this file | | `-file:somefile.rb` | Errors not occurring in this file | | `hostname:"api-east1-a"` | Errors occurring on a server with this hostname | | `-hostname:"api-east1-a"` | Errors not occurring on a server with this hostname | | `revision:"v1.10"` | Errors occurring from a deployment tagged with this revision | | `-revision:"v1.10"` | Errors not occurring from a deployment tagged with this revision | Locations can be combined for more specific results. For example, the query: `component:"UsersController" action:"update" request.url:"/docs"` searches errors generated from the update action in the UsersController in the URL `camera`. ### Search by request [Section titled “Search by request”](#search-by-request) Search errors by context, params, user agent, or session hashes. | Example query | Searches | | ----------------------------------------------- | --------------------------------------------------------------------- | | `context.user_id:*` | Errors that impacted a user (if you send user\_id in context) | | `context.user_email:*` | Errors that impacted a user (if you send user\_email in context) | | `context.user.email:"bob@example.io"` | Errors with a matching context value | | `-context.user.name:"Bob"` | Errors without a matching context value | | `params.user.first_name:"Bob"` | Errors with a matching param value | | `params.old:"useless"` | Errors without a matching param value | | `request.user_agent:"Googlebot` | Errors caused by a user with this user agent | | `-request.user_agent:"Googlebot` | Errors not caused by a user with this user agent | | `request.referer:"http://my.site.com/location` | Errors that occurred when the user came from a particular URL | | `-request.referer:"http://my.site.com/location` | Errors that occurred when the user did not come from a particular URL | Requests can be combined or nested for more specific results. For example, searching for context.user.email:bob\@example.com would match the following hash that was sent in the context with an error: `{ user: { email: "bob@example.com" } }` When searching these hashes, separate the nested levels of the hash with a period. For example `params.user.first_name:bob`. Searches against context, params, user agent, or session hashes use \* as a wild-card, so a search for `context.user.email:*@example.com` would match any email address at example.com. ### Searching for arrays [Section titled “Searching for arrays”](#searching-for-arrays) When searching for data within array values, one way is to do the search on a key that contains the array value. For example, you might have a sidekiq job that shows up with params in our UI like this:
```ruby
{"job" => {"args" => [{"job_class" => "Foo", "job_id" => "123"}]}}
```
To search for “Foo”, your search should look like this: `params.job.args:*Foo*` You could be more explicit by including the array index in the query: `params.job.args.0.job_id:123` ## Sorting results [Section titled “Sorting results”](#sorting-results) Error results can be sorted by date or error count. ### Sort by date [Section titled “Sort by date”](#sort-by-date) Sorting by “Last seen” lets you quickly jump to the newest or oldest exceptions that match your search result. 1. Go to your project’s error list page 2. Click on the table header labeled “last seen” 3. Click on it again to reverse the sort order 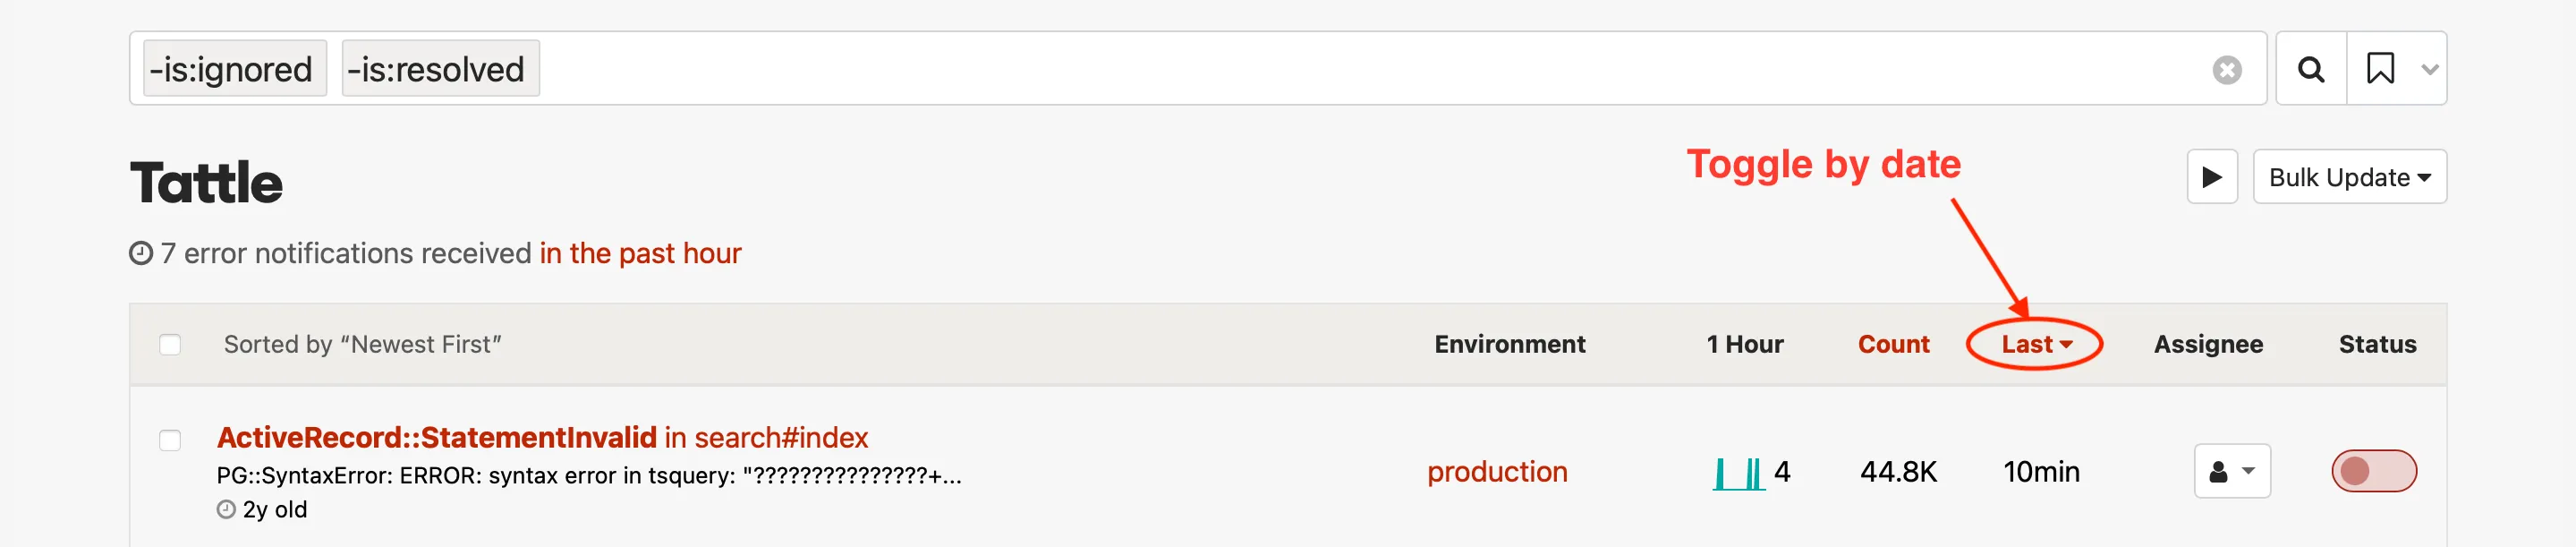 ### Sort by count [Section titled “Sort by count”](#sort-by-count) Sorting by “Times” lets you see which errors have happened the most or the fewest times. 1. Go to your project’s error index 2. Click on the table header labeled “times” 3. Click on it again to reverse the sort order 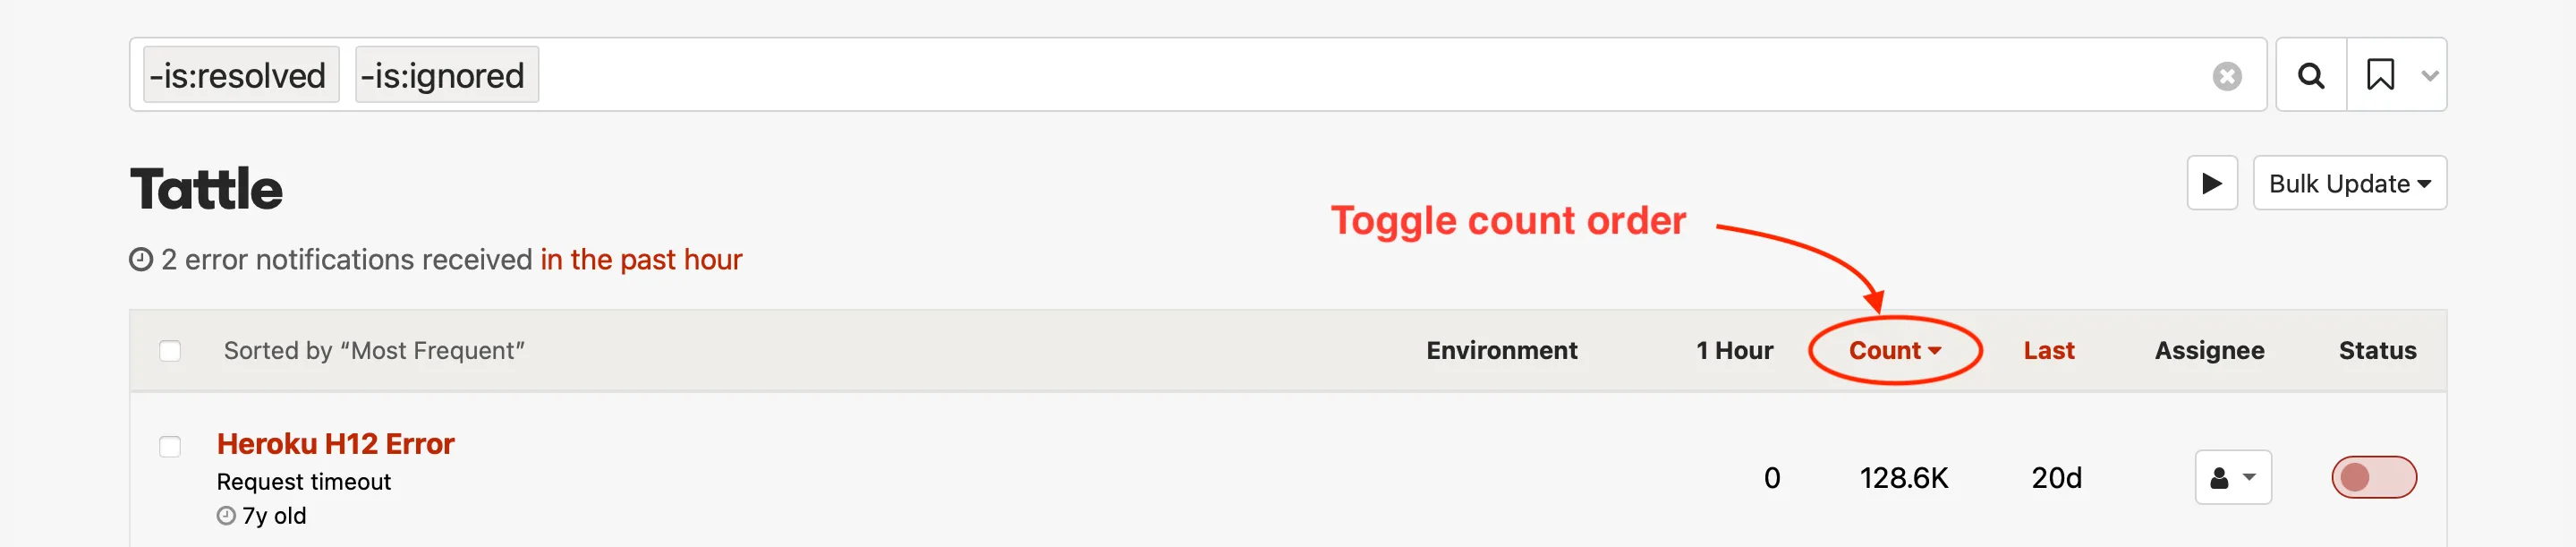 ## Saved searches and default search [Section titled “Saved searches and default search”](#saved-searches-and-default-search) You can save a search using the button with the bookmark icon to the right of the button with the search icon. This allows to easily re-use a search. You can also pin a saved search to use that search as the default search. Once you have pinned a search, those search terms will be used as the default view for the project.  ## Batch actions [Section titled “Batch actions”](#batch-actions)  You can use the *Bulk Update* dropdown to update multiple errors simultaneously. You can apply actions to all search results (this is the default), or you can use the checkboxes in the error list to apply the actions to selected errors. 1. Use the search to select which errors you’d like change. 2. Click on “Actions” and select one or more options from the drop-down. ## Free-form text search [Section titled “Free-form text search”](#free-form-text-search) Search through your errors by **class** or error **message** by typing your search term into the search box. Free-form text queries can also be combined with `key:value` tokens, for example: `john class:UserError component:UsersController action:update`.
# Heroku
> Honeybadger + Heroku <3.
Honeybadger has great built-in support for Heroku, including automated deployment tracking and monitoring of Heroku [platform errors](https://devcenter.heroku.com/articles/error-codes). ## Overview [Section titled “Overview”](#overview) There are two ways to use Honeybadger with Heroku: via our Heroku add-on, and via a regular Honeybadger account. Each has its own unique strengths. * **Heroku Add-On:** When you purchase the Honeybadger add-on through the Heroku marketplace, you’re buying access for a single project and a single user. If this is all you need, the Heroku add-on can be super convenient. But if you have several users managing errors for multiple projects, it can be a hassle…not to mention more expensive. * **“Regular” Honeybadger Account:** If you’ve signed up for a Honeybadger account via our website, good news! You still have access to all our Heroku-related features. We’ll cover how to set that up below. You’ll also get a plan that allows multiple projects and multiple users. ### Converting Heroku accounts [Section titled “Converting Heroku accounts”](#converting-heroku-accounts) If you are currently a Heroku add-on customer and would like to switch to a “regular” account, we can do that. Just email us at . ## Heroku deployment tracking [Section titled “Heroku deployment tracking”](#heroku-deployment-tracking) With deployment tracking, Honeybadger is notified when you deploy your app. It’s optional, but enabling it lets you do some really cool things, like: * Send alerts to Slack whenever your project is deployed. * Automatically resolve errors on deployment, so that any new occurrences **after** deployment will send you a new notification. * See which errors occurred after which deployments. It’s super easy to set up deployment tracking for your Heroku apps. Just run the following command, making sure to add your Honeybadger API key at the end:
```bash
heroku webhooks:add -i api:release -l notify -u "https://api.honeybadger.io/v1/deploys/heroku?repository=git@github.com/username/projectname&environment=production&api_key=PROJECT_API_KEY" --app app-name
```
If you’re using our Ruby gem, you can use the `honeybadger` command line tool to do the same thing:
```bash
bundle exec honeybadger heroku install_deploy_notification
```
## Heroku platform errors [Section titled “Heroku platform errors”](#heroku-platform-errors) > If you’re a Heroku add-on customer, platform error monitoring may already be set up. To check, run `heroku drains -a APP_NAME` and see if it mentions Honeybadger or “logplex.honeybadger.io”. If it does, you don’t need to set anything else up. Normally, Honeybadger only sees errors that happen inside your application. On Heroku, we’re able to go one step farther and monitor [platform errors](https://devcenter.heroku.com/articles/error-codes). These include the dreaded H12 timeouts and R99 errors you may have seen in your Heroku logs. To capture these errors we use Heroku’s log drain feature. Each line of your logs is sent to our servers in the background. We pull out the errors and throw everything else away. To add the log drain, run the following command, replacing API\_KEY with your Honeybadger project’s secret token and APP\_NAME with the name of your Heroku app:
```bash
heroku drains:add https://logplex.honeybadger.io/heroku/v1?api_key=PROJECT_API_KEY-a APP_NAME
```
To monitor different environments in the same Honeybadger project, add the `env` parameter to the log drain endpoint, i.e.:
```bash
heroku drains:add https://logplex.honeybadger.io/heroku/v1?api_key=PROJECT_API_KEY&env=production -a APP_NAME
```
## Heroku platform logs [Section titled “Heroku platform logs”](#heroku-platform-logs) To send all of your Heroku logs into [Insights](/guides/insights) (in addition to errors, as described above), create an additional log drain for your Heroku app using an API key displayed on the API keys tab of the project settings page:
```bash
heroku drains:add "https://logplex.honeybadger.io/v1/events?api_key=PROJECT_API_KEY"
```
You can optionally add the `env` parameter to the log drain endpoint. If you do so, each payload recorded from Logplex will have a field named `environment` added to it. You can then add a filter for the desired environment to your queries, like `filter environment::str == 'production'`.
```bash
heroku drains:add https://logplex.honeybadger.io/v1/events?api_key=PROJECT_API_KEY&env=production
```
# Insights & Logging
> Dive into your Honeybadger and application events.
You can use [Honeybadger Insights](https://www.honeybadger.io/tour/logging-observability/) to dive into the data collected by Honeybadger and the logs and other events that you send to our [Events API](/api/reporting-events/). We provide a query language (that we lovingly call [BadgerQL](/guides/insights/badgerql/)) that enables quick discovery of what’s happening inside your applications. The Insights UI also lets you chart the results of those queries and add those charts to [dashboards](/guides/dashboards/) that you can share with your team. 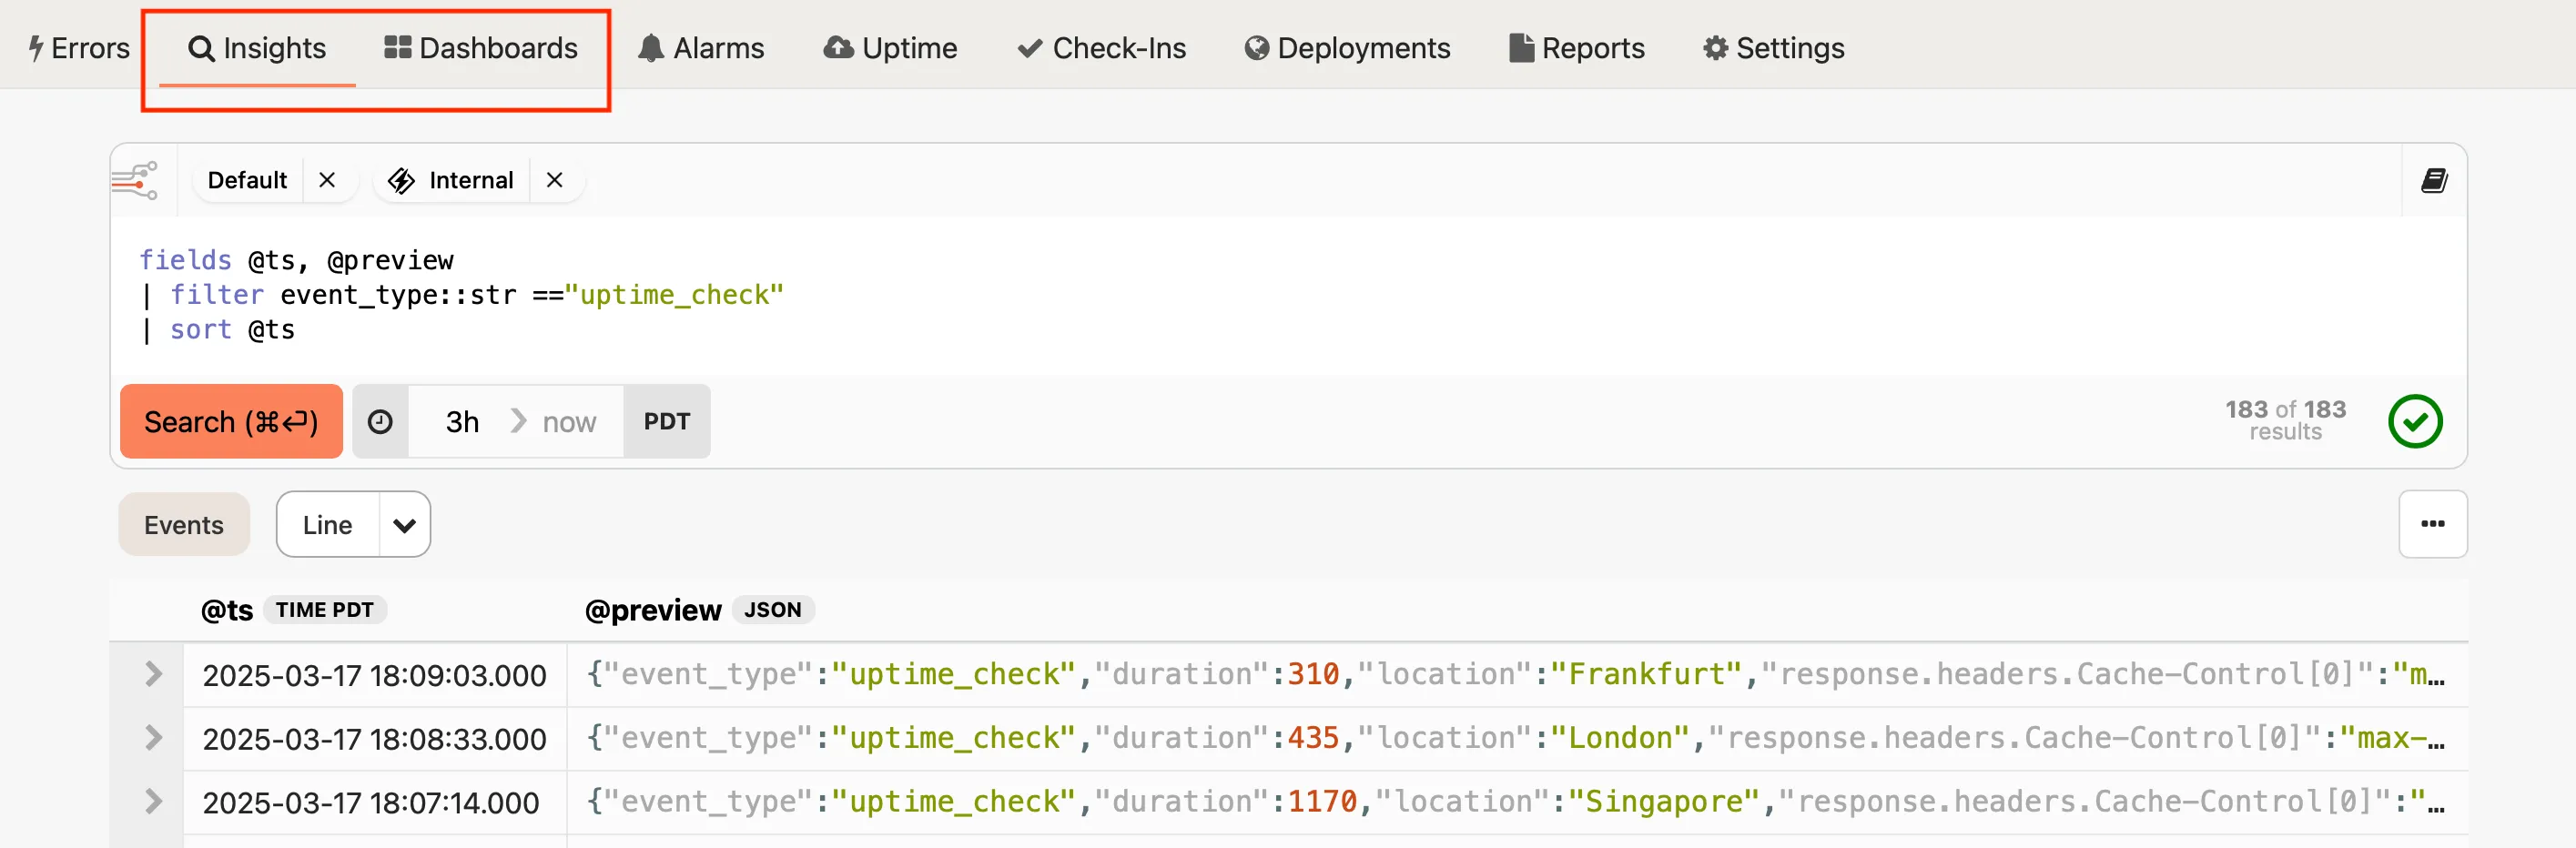 ## Querying and visualization [Section titled “Querying and visualization”](#querying-and-visualization) Our [query language](/guides/insights/badgerql/) strives to be minimalist, yet powerful. With it you can specify which fields you want to see, filter the kinds of events that should be returned, perform aggregations and calculations, and more. When you first load the Insights UI, you will see a query box that has a default query to help you get started:
```badgerql
fields @ts, @preview
| sort @ts
```
This query selects a couple of special fields — the timestamp and a preview of the fields that are available in the event — and sorts the results by time, with the most recent results first. Each row of the query is piped through the following row, which allows you to apply filters, formatting functions, and so on. Let’s do a quick walk-through to see how it works, and to see how it can be used to create visualizations of your data. ### Walk-through [Section titled “Walk-through”](#walk-through) Here’s an example of working with some Honeybadger data. First, filter the data to see only the results of [uptime checks](/guides/uptime/):
```badgerql
fields @ts, @preview
| filter event_type::str == "uptime_check"
| sort @ts
```
 You can see that we’ve piped the initial results through `filter`, which accepts a variety of conditions, such as the string comparison shown here. You’ll also notice that we specified the data type of the `event_type` field (`str`) so the query parser can validate the functions and comparisons that you use on the field data. Clicking on the disclosure arrow will show the all the fields that were stored for an event: 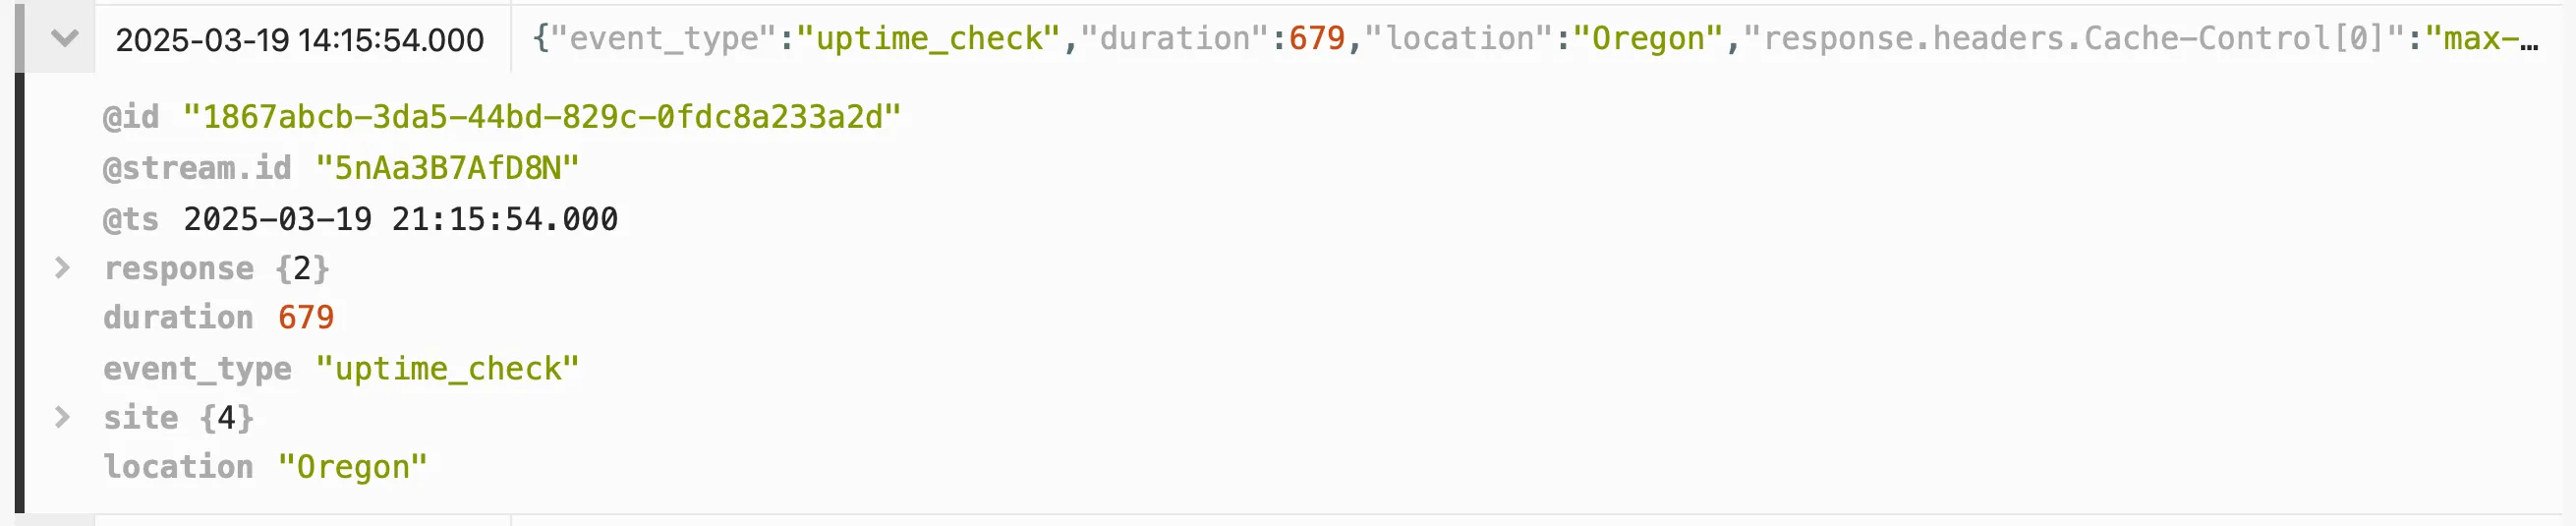 Additional disclosure controls appear inside the event detail view when the event has nested objects. Let’s filter on some additional data that is present in these events. We can limit the results to show only the uptime checks that originated from our Virginia location, and we can change the fields that we display so we can see some info about the results of each check:
```badgerql
fields @ts, location::str, response.status_code::int, duration::int
| filter event_type::str == "uptime_check"
| filter location::str == "Virginia"
| sort @ts
```
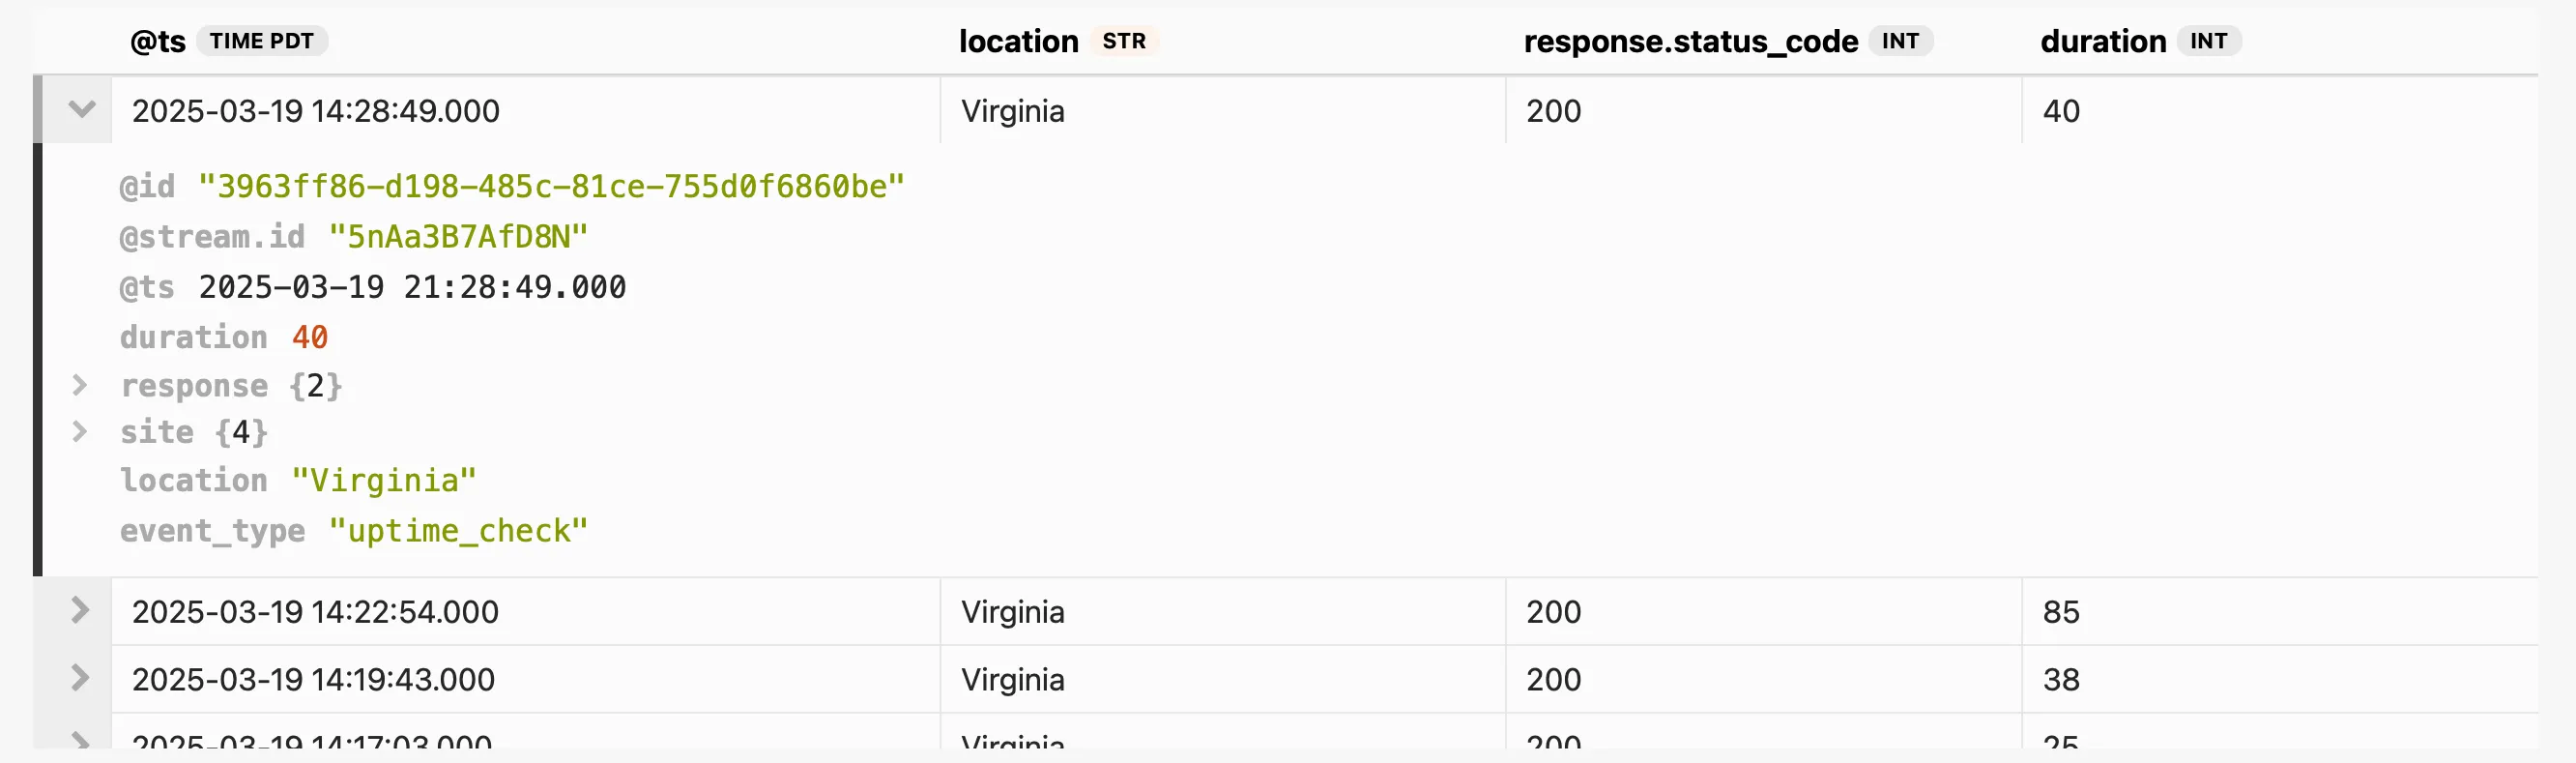 Now let’s summarize the data to find the average response duration for all successful checks:
```badgerql
fields duration::int
| filter event_type::str == "uptime_check"
| filter location::str == "Virginia"
| filter response.status_code::int == 200
| stats avg(duration) by bin(1h) as time
| sort time
```
 We use `stats` to perform all kinds of calculations, such as averages, and `by` allows us to specify the grouping for those calculations. Grouping by `bin` gives us time-series data, which makes it easy to create a chart by clicking the Line button. 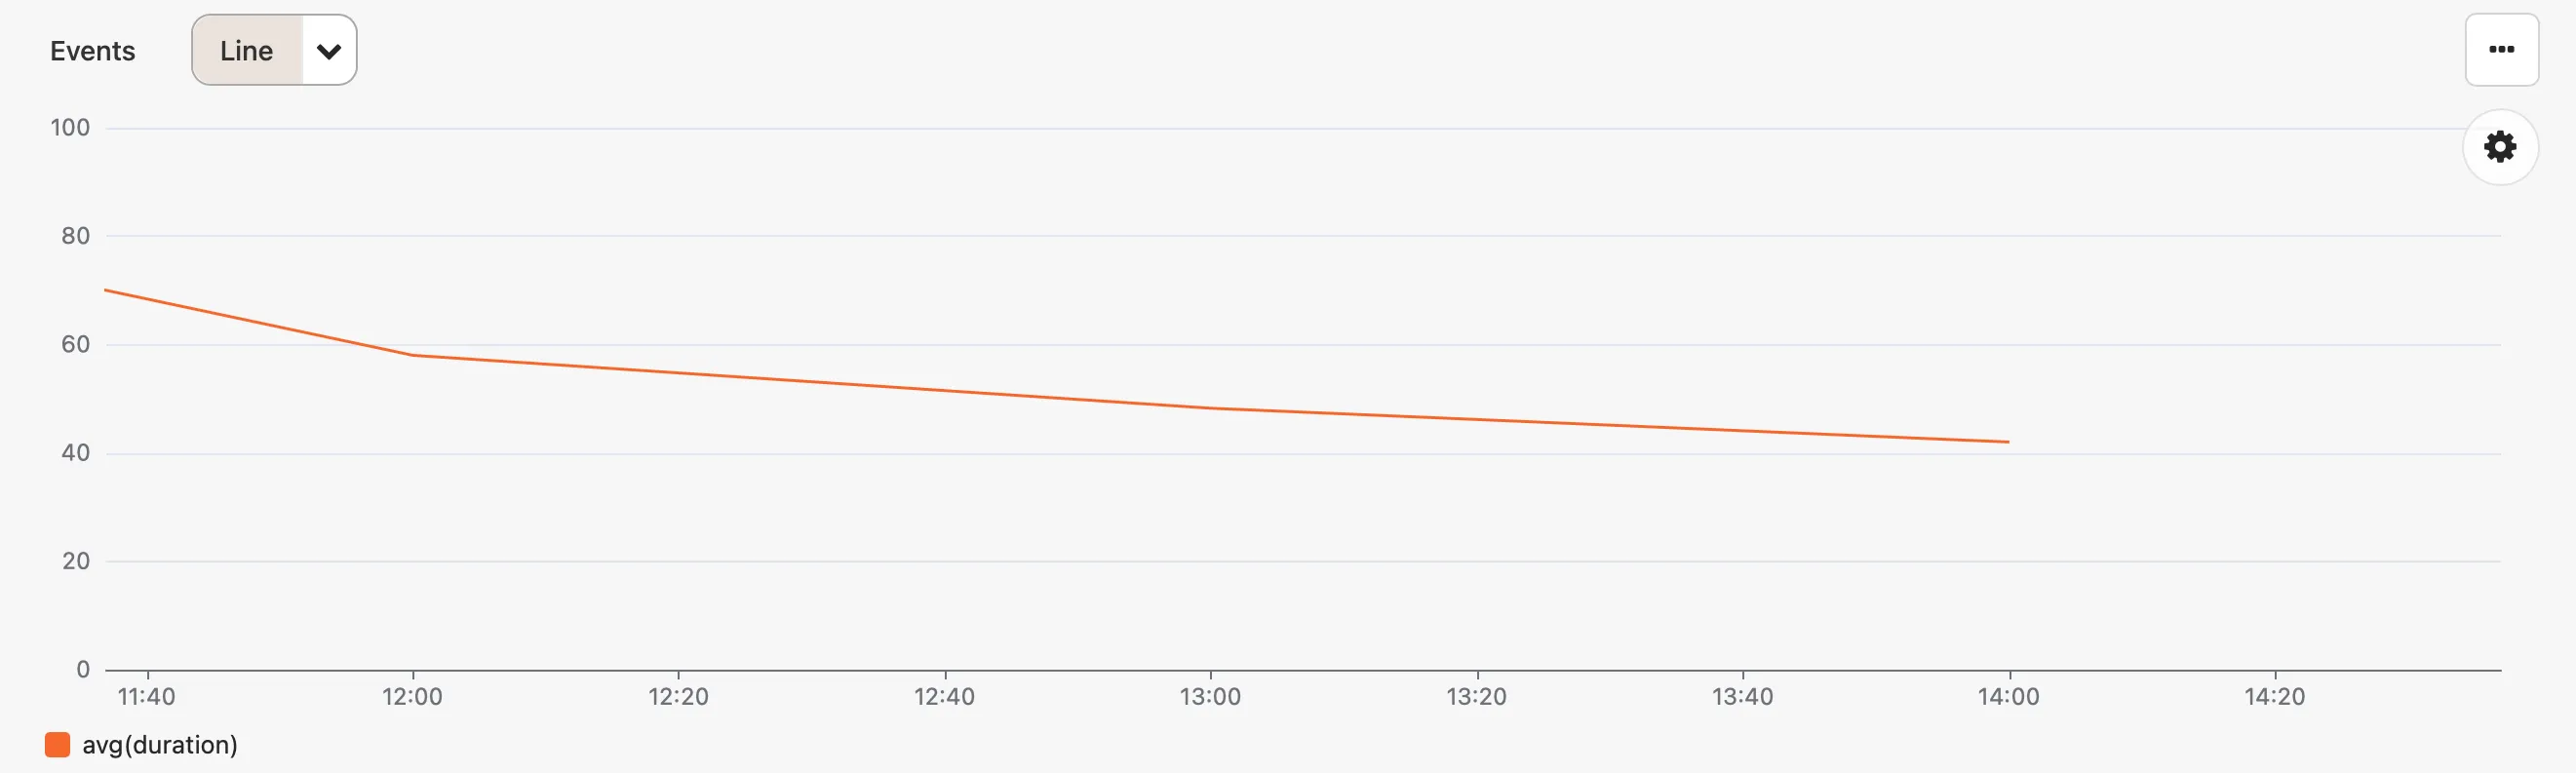 From there you can experiment with different visualizations, update the query to change the chart (try changing `1h` to `15m`), and add the chart to a custom dashboard. Of course, this functionality isn’t limited to only the data that is generated by Honeybadger. Your error data is also available for querying (`event_type::str == "notice"`), and you can send logs and events to our [API](/api/reporting-events/) to be able to query and chart your own data. ### Natural language queries [Section titled “Natural language queries”](#natural-language-queries) You don’t need to know [BadgerQL](/guides/insights/badgerql/) to query your data. Click the lightbulb icon to the right of the query editor to open the natural language translator panel. Describe what you want to see, then press `⌘+Enter` or click Translate and Honeybadger will write the query for you. 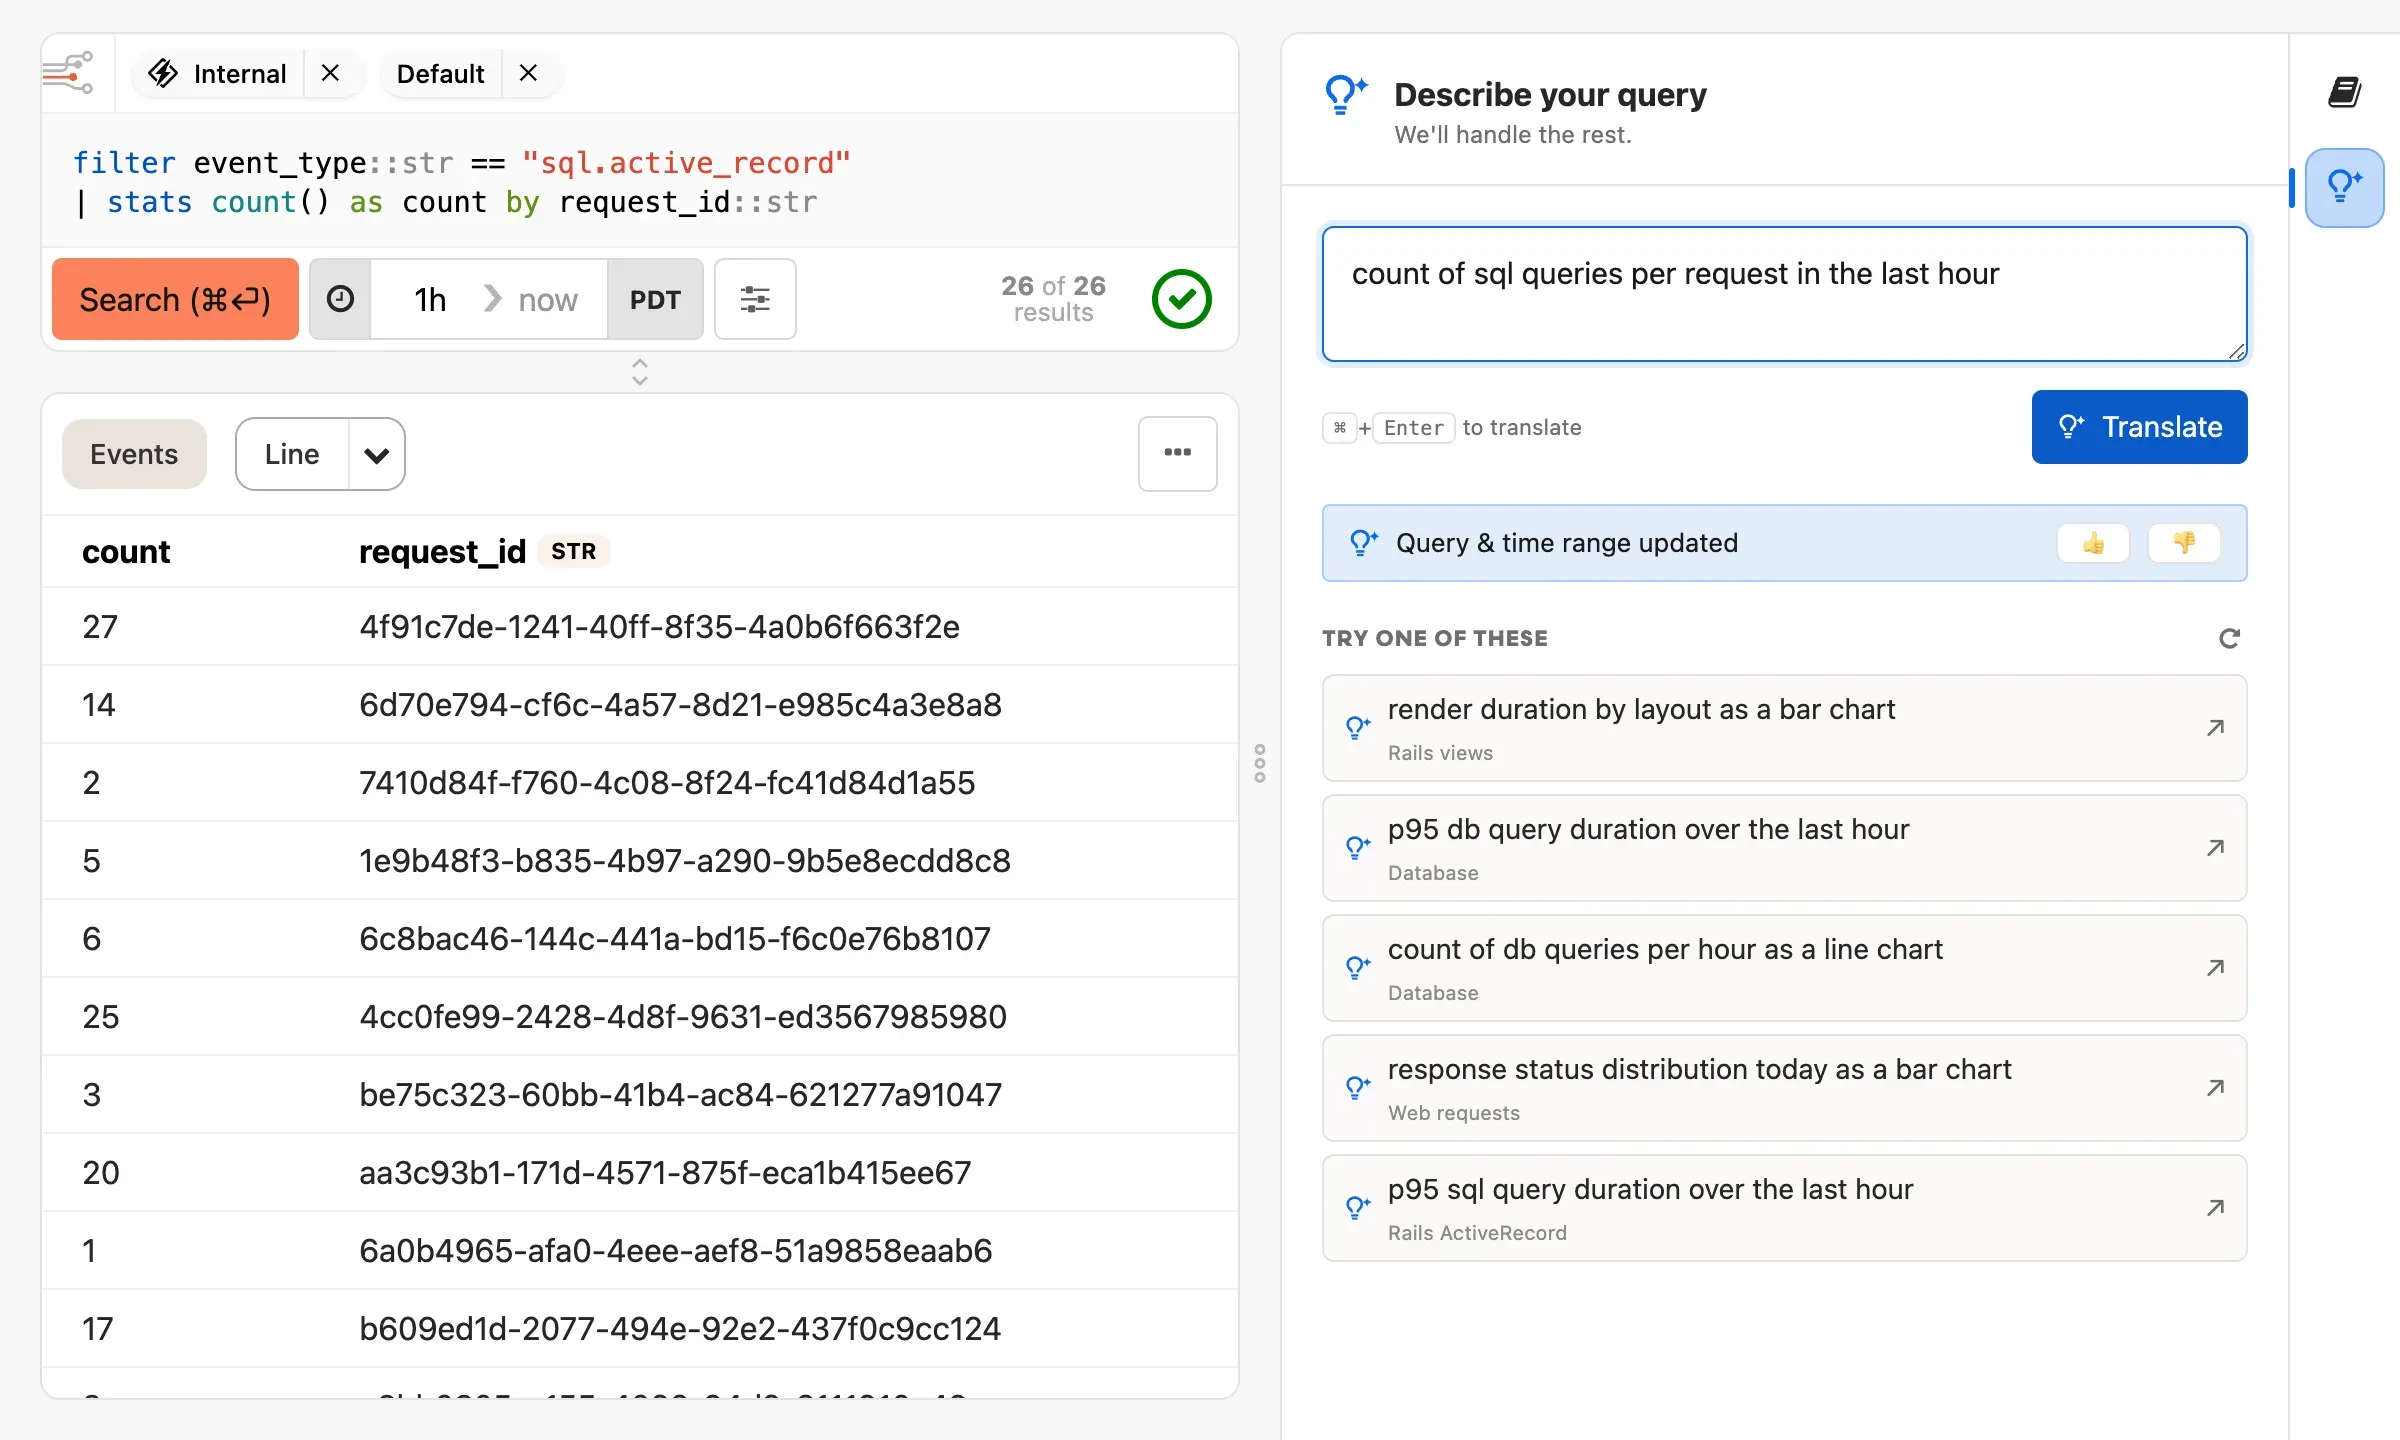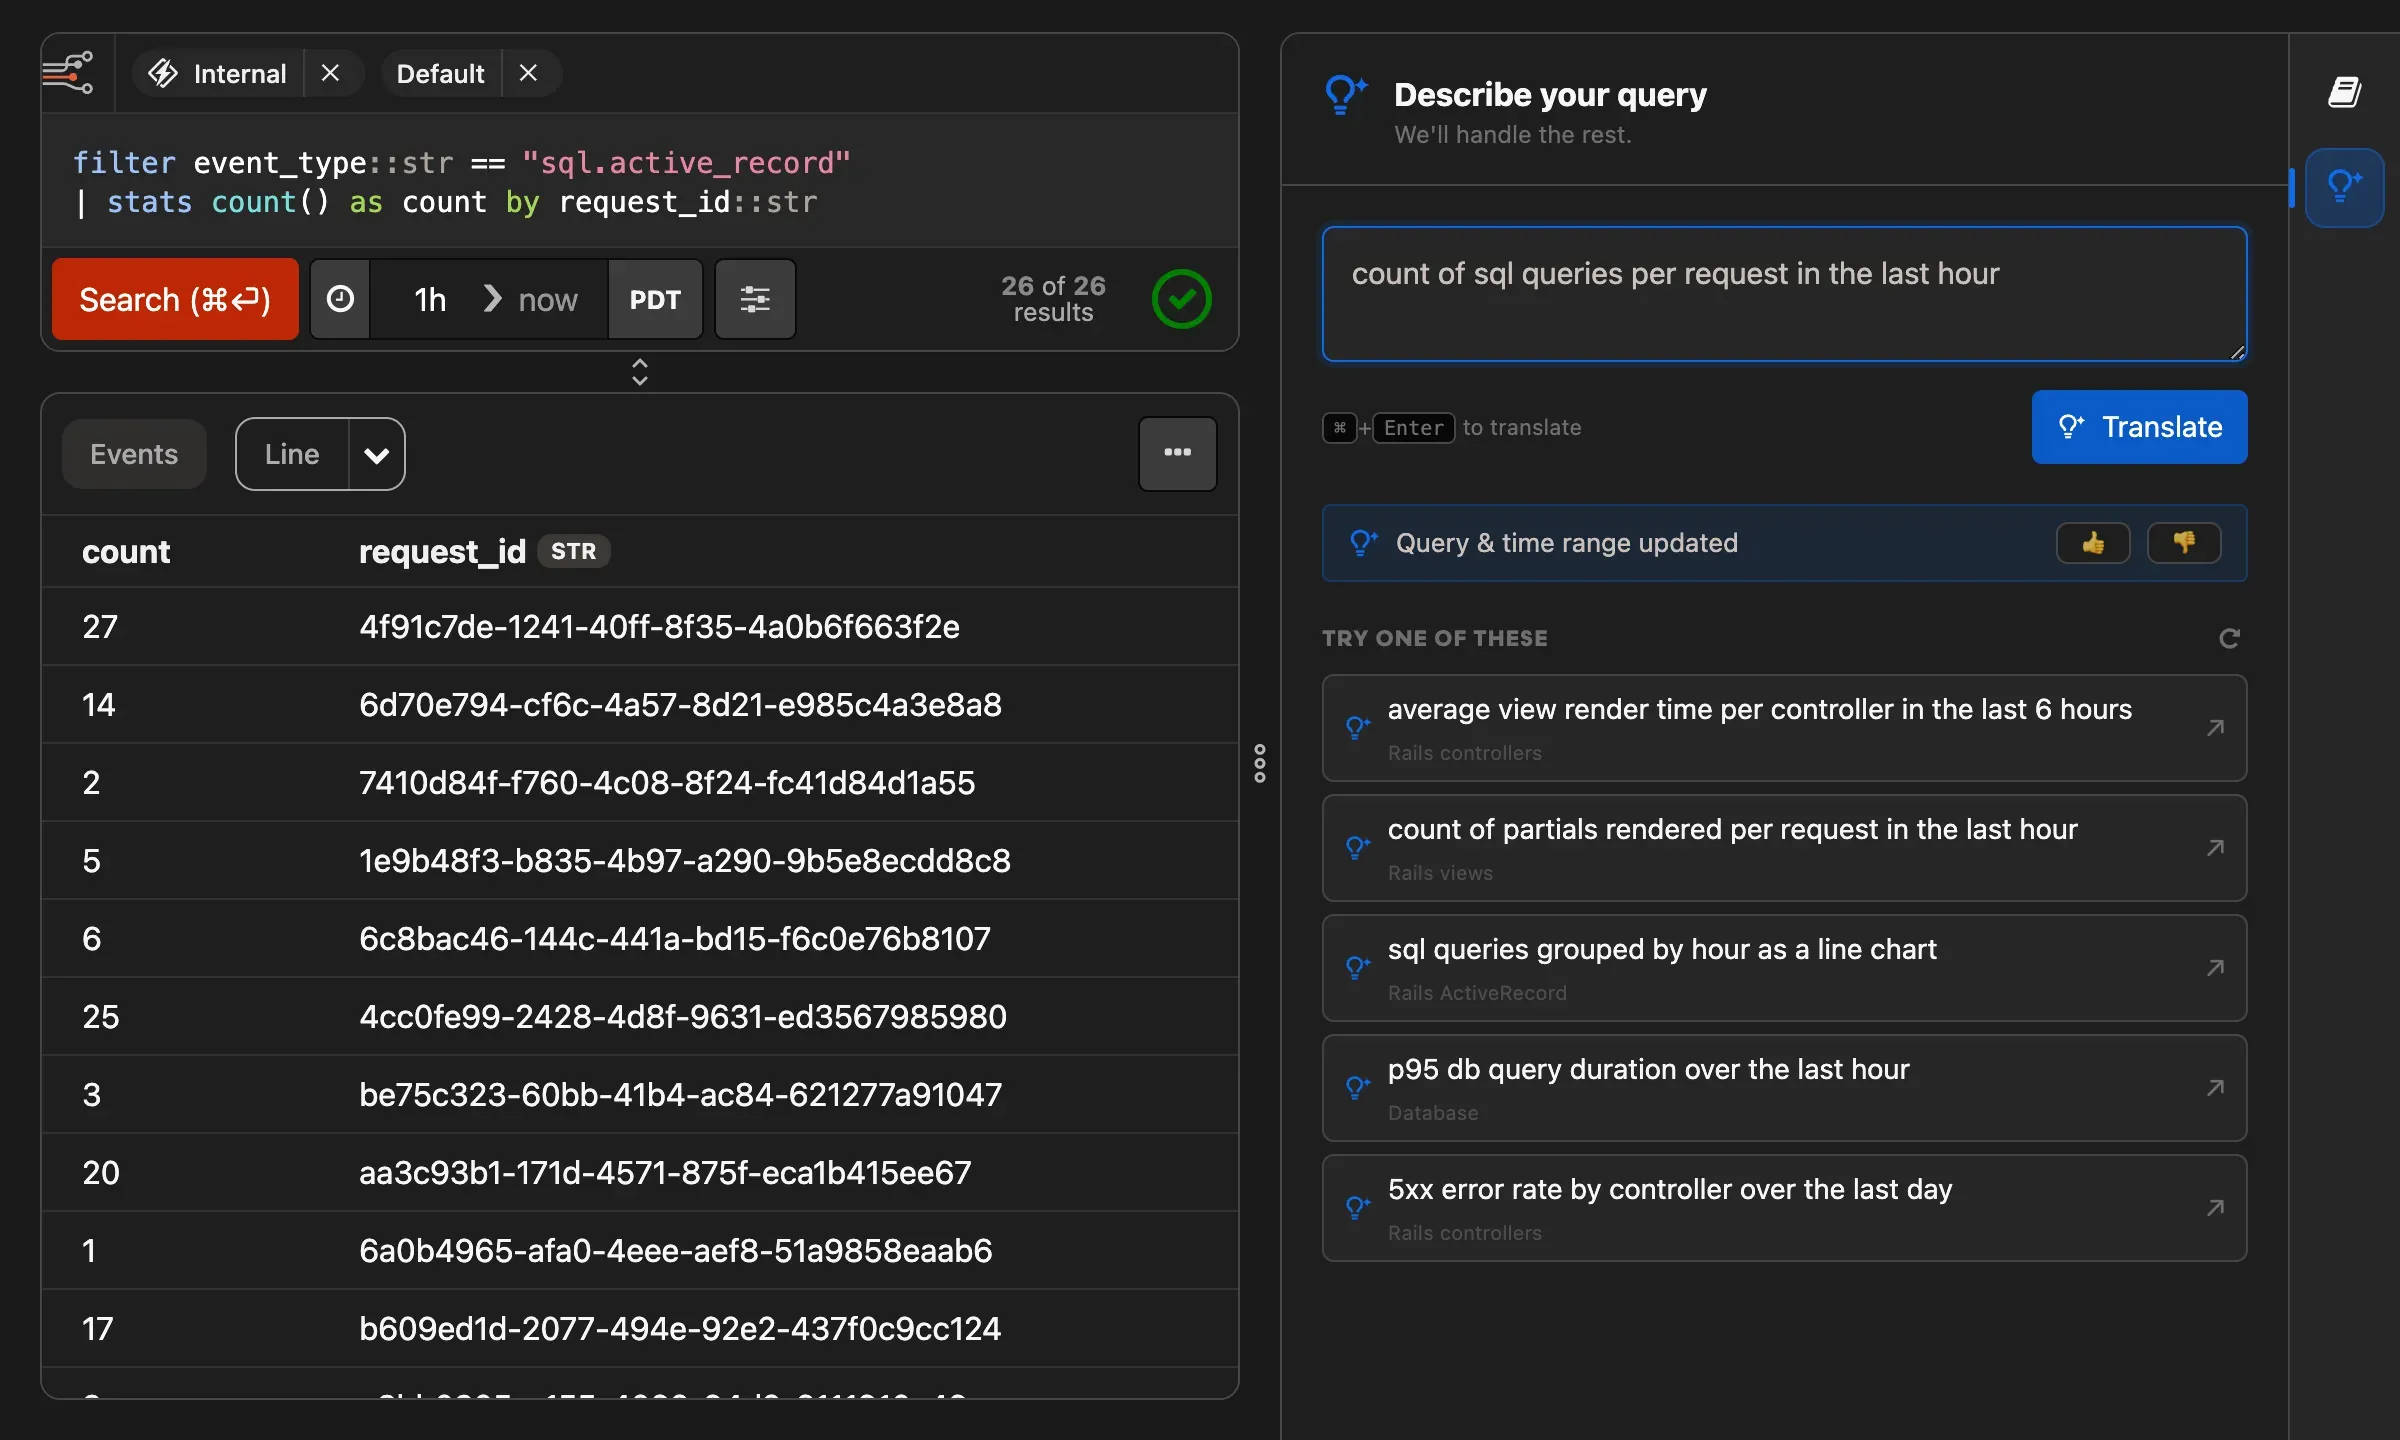 The translator uses your current query as context, so you can build up a query in steps. Start broad, then ask for changes like including the duration, grouping by controller, or narrowing to just 5xx status codes. You can also include other display options in your description. For example, ask for “the last hour” or “as a line chart” and Honeybadger will update the time range or visualization. **Note:** The NL translator uses an LLM, so it may not always get things right. If the translations are not what you expected, please record your feedback via the thumbs, or feel free to [reach out to support](mailto:support@honeybadger.io). ### Streams [Section titled “Streams”](#streams) Streams are the fundamental data sources in Honeybadger Insights. They serve as the starting point for your queries and represent the data you want to analyze. When you create a new Honeybadger project, we automatically set up two streams for you: **Internal stream** The Internal Stream is a dedicated stream that stores all Honeybadger-generated events related to your project. This includes errors, deployments, notifications, uptime checks, and other internal Honeybadger data. You cannot directly send custom events to the Internal Stream, as it is managed by Honeybadger itself. **Default stream** The Default Stream is the primary stream for storing custom events that you send using Honeybadger client libraries or the Honeybadger API. Any event data you explicitly send to Honeybadger will be stored in the Default Stream. #### The stream selector [Section titled “The stream selector”](#the-stream-selector) You can select the active streams from the stream selector at the top of the query editor. This affects the data that Insights returns for your queries.  Removing a stream you don’t need can improve your query response times, because then Insights doesn’t need to scan that data when executing your query. So for example, if you’re just querying your application logs, you can remove the *Internal* stream to get a faster response. ## Working with dashboards [Section titled “Working with dashboards”](#working-with-dashboards) [Dashboards](/guides/dashboards/) allow you to collect different types of charts and query results on a single page. Any query or chart that you generate can be added to a dashboard, which will then be shared with the rest of your team. Each widget on a dashboard includes a link to view the query and raw results behind the widget: 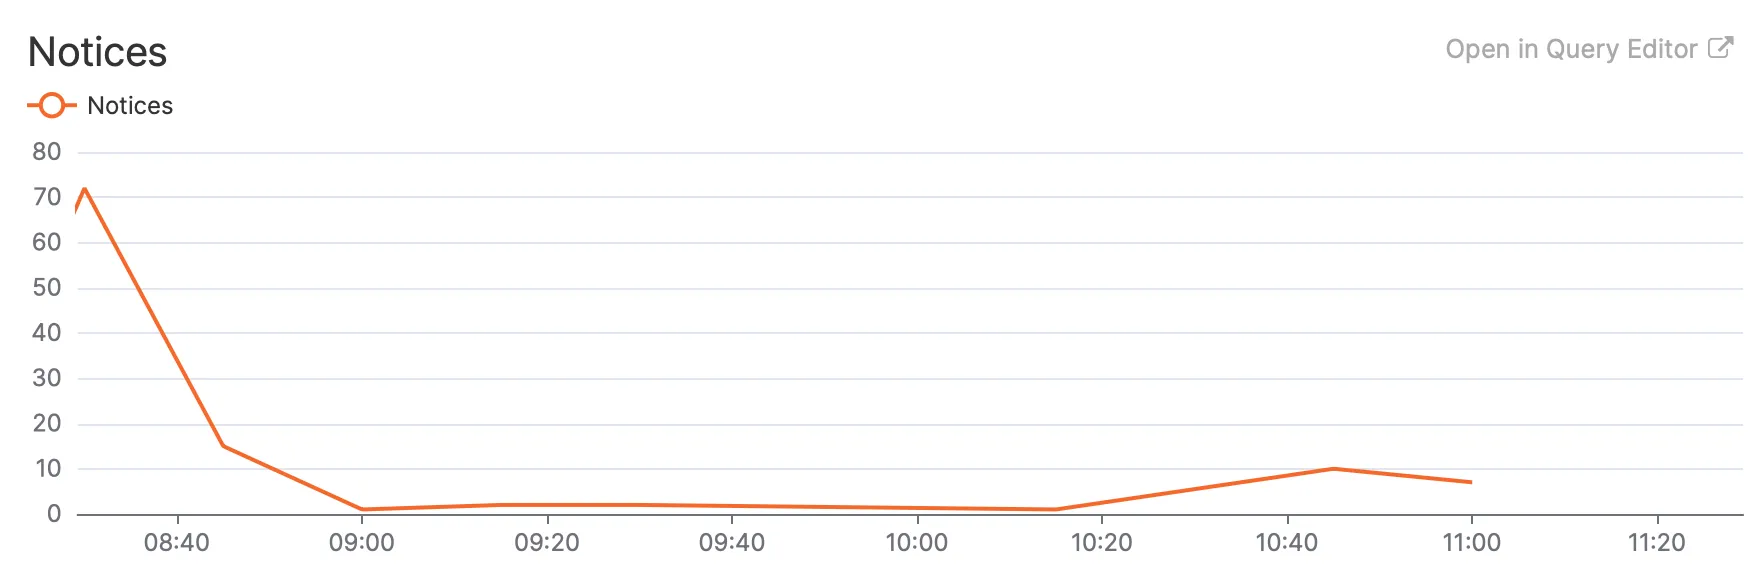 If you change the query or the visualization, you can save those changes back to your dashboard, or add them as a widget to a new dashboard. We provide some [automatic dashboards](/guides/dashboards/#automatic-dashboards) to get you started. For example, when you [add a Heroku drain](/guides/insights/integrations/heroku/) to your app, the [automatic Heroku dashboard](/guides/dashboards/heroku/) will show data like the number of requests grouped by response code that we automatically collect from [Logplex](https://devcenter.heroku.com/articles/logplex). To learn more about dashboards, see the [dashboards guide](/guides/dashboards/). ## Adding data from other sources [Section titled “Adding data from other sources”](#adding-data-from-other-sources) Insights includes all the events that Honeybadger collects, such as error notifications, uptime checks, and check-in reports, but you can send your own event data as well. Our [API](/api/reporting-events/) accepts newline-delimited JSON, where each line is a JSON object that describes an event that you care about. You can send user audit trail events, metrics, or any other data you’d like to query and analyze. The type of data most frequently sent to Insights is application log data. Sending structured logs in a JSON format (like [lograge](https://github.com/roidrage/lograge) produces) allows you to correlate what’s happening in your app with the error data that Honeybadger is already recording for you. See our integration guides to learn how you can easily send log events from sources such as Heroku apps and CloudWatch Logs. [Ruby and Rails apps](/guides/insights/integrations/ruby-and-rails/)Send metrics and events from Ruby and Rails apps to Honeybadger Insights [Elixir/Phoenix apps](/guides/insights/integrations/elixir-phoenix/)Send logs and events from Elixir/Phoenix apps to Honeybadger Insights [JavaScript apps](/guides/insights/integrations/javascript/)Send metrics and events from JavaScript apps to Honeybadger Insights [PHP/Laravel apps](/guides/insights/integrations/php-laravel/)Send metrics and events from PHP/Laravel apps to Honeybadger Insights [OpenTelemetry (Beta)](/guides/insights/integrations/opentelemetry/)Send traces, metrics, and logs via the OpenTelemetry Protocol (OTLP) [CloudWatch Logs](/guides/insights/integrations/cloudwatch-logs/)Stream AWS CloudWatch Logs to Honeybadger Insights [Crunchy Bridge](/guides/insights/integrations/crunchy-bridge/)Send Crunchy Bridge metrics to Honeybadger Insights [Fly.io](/guides/insights/integrations/fly-io/)Send Fly.io app metrics to Honeybadger Insights [Heroku](/guides/insights/integrations/heroku/)Send Heroku app metrics to Honeybadger Insights [Host metrics](/guides/insights/integrations/host-metrics/)Send host metrics to Honeybadger Insights [Log files](/guides/insights/integrations/log-files/)Use Vector to ship your log files to Honeybadger Insights [Netlify](/guides/insights/integrations/netlify/)Send Netlify function logs to Honeybadger Insights [Rsyslog](/guides/insights/integrations/rsyslog/)Forward rsyslog messages to Honeybadger Insights over syslog-TLS [Systemd (journald)](/guides/insights/integrations/systemd/)Ship systemd journal logs to Honeybadger Insights
# Alarms guide
> Learn how to create Honeybadger alarms to monitor your Insights data in real time.
Insights alarms allow you to monitor your data in real time and get notified under the conditions you set. Your Honeybadger data, such as errors, deployments, and uptime checks, are already available to query. To learn how to send your own custom data to Honeybadger, see the [Getting started guide](/guides/insights/). Then, you can create alarms for anything your business needs. 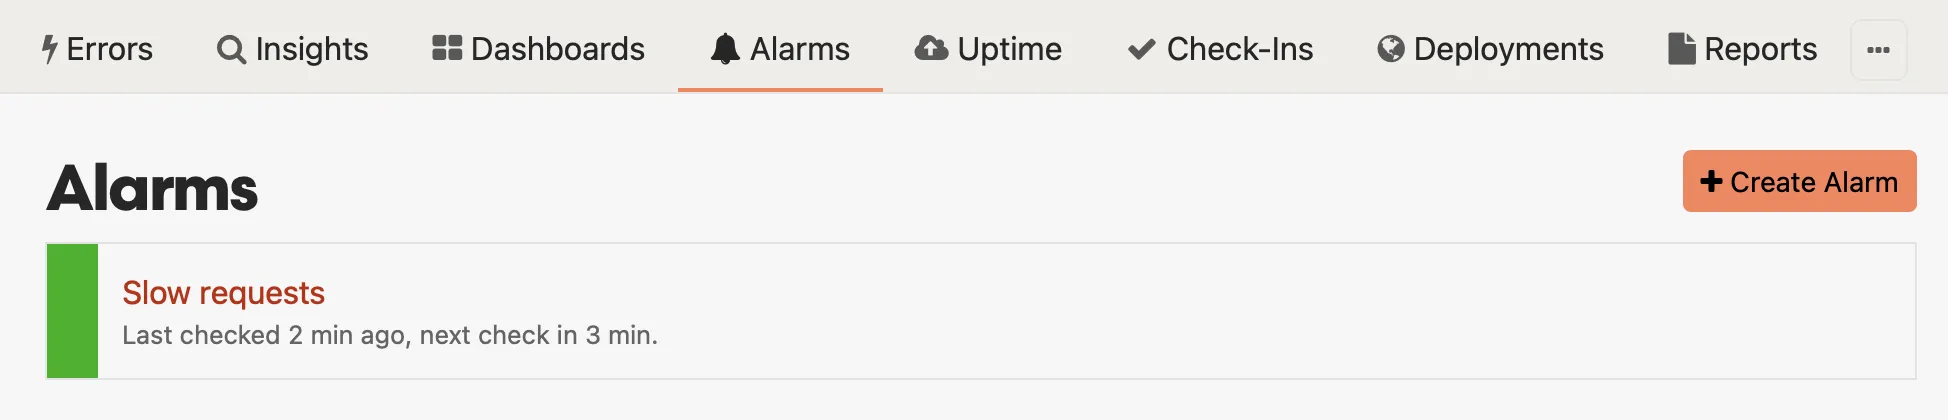 ## Viewing an alarm [Section titled “Viewing an alarm”](#viewing-an-alarm) Alarms combine a [BadgerQL](/guides/insights/badgerql/) query (“count all slow requests in the past five minutes”) with a threshold (“when count is > 2”) and trigger alerts when the query result exceeds the threshold. 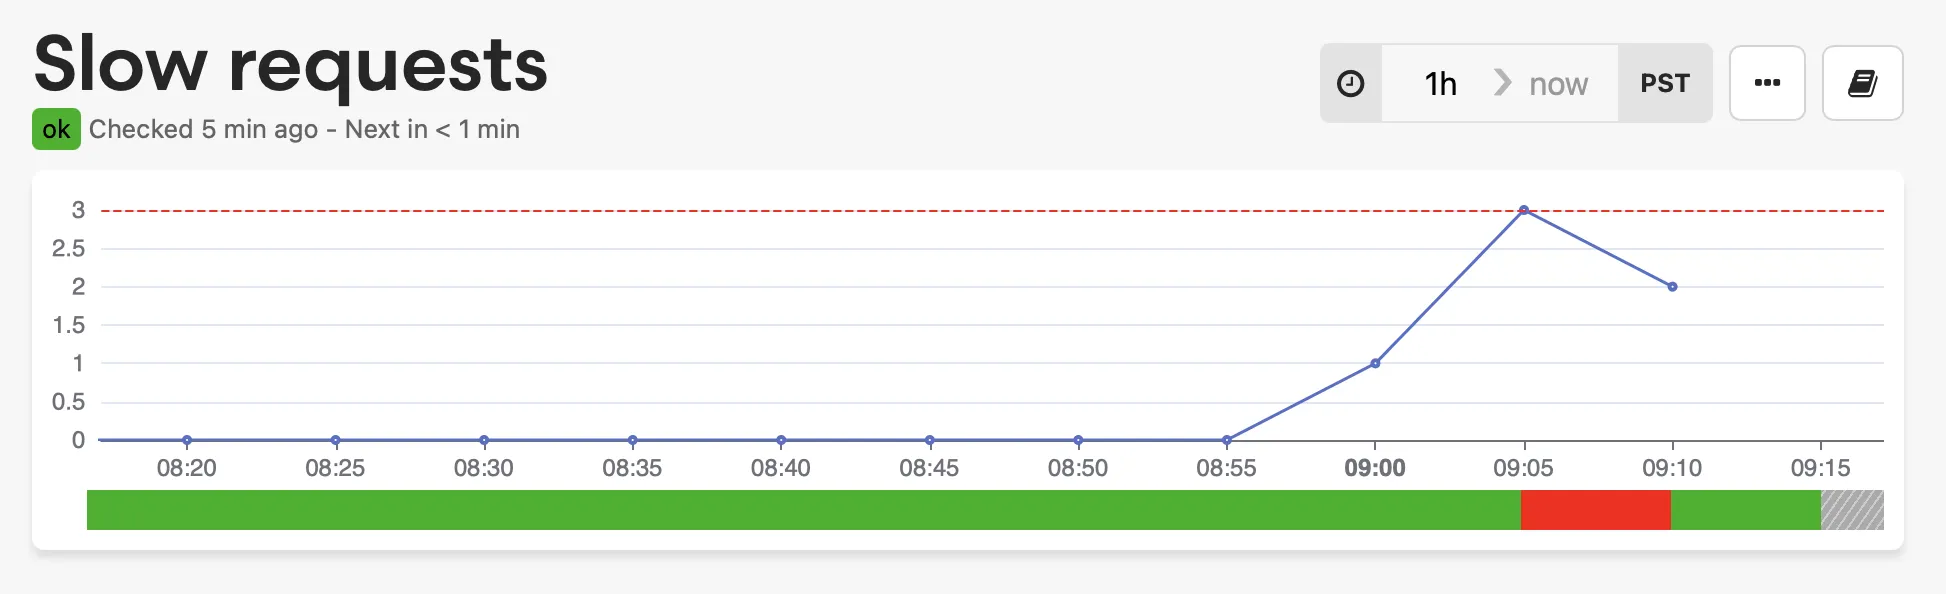 In the above chart, the red line is the threshold for the alarm state. This query was in an alarm state for one period in the last hour but recently recovered. ## Creating or updating an alarm [Section titled “Creating or updating an alarm”](#creating-or-updating-an-alarm) ### Query and timing [Section titled “Query and timing”](#query-and-timing) Construct a `query` using [BadgerQL](/guides/insights/badgerql/) to return data you wish to monitor. You may want to use a `filter` function to isolate the relevant data. 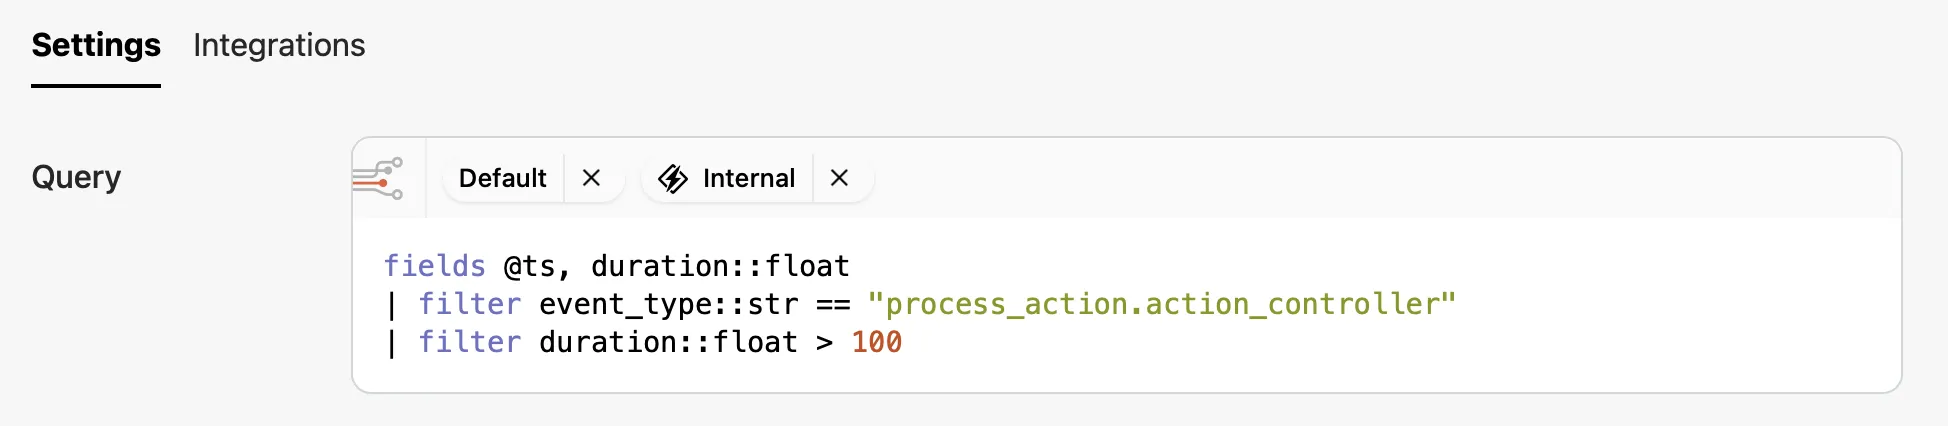 Use the `interval` field to specify the time window for the query. The `interval` field is a string that represents the time window for the query. The format is `1d`, `1h`, `1m`, etc. In other words, the `interval` is both the frequency and the time period over which the query is executed. The `lag` field can be used to delay the query execution by a specified time period. The `lag` field is also a string that represents the time delay for the query. The format is `1d`, `1h`, `1m`, etc. This is useful when you want to wait for slow or late data arriving.  ### Result count [Section titled “Result count”](#result-count) Alarms are triggered based on the number of results returned by the query. You can specify the logical comparison operator (`>`, `>=`, `<`, `<=`, `==`, `!=`) and a value count. The alarm will trigger when the number of results meets the condition.  ### Description [Section titled “Description”](#description) It may be helpful to provide a description of the alarm to help you remember its purpose. The description is also delivered as part of the notification when you have integrations setup. Some useful information would be what the alarm is monitoring, what to do when the alarm triggers, and who to contact. ## Integrations [Section titled “Integrations”](#integrations) Integrations is where you can configured how to be notified when an alarm changes state. There are two states per integration that can be configured: `ok` and `alert`. All users can update their personal notification integrations (email, etc.), while users with administrator access to the project can manage the alert settings for all of the project’s integrations. 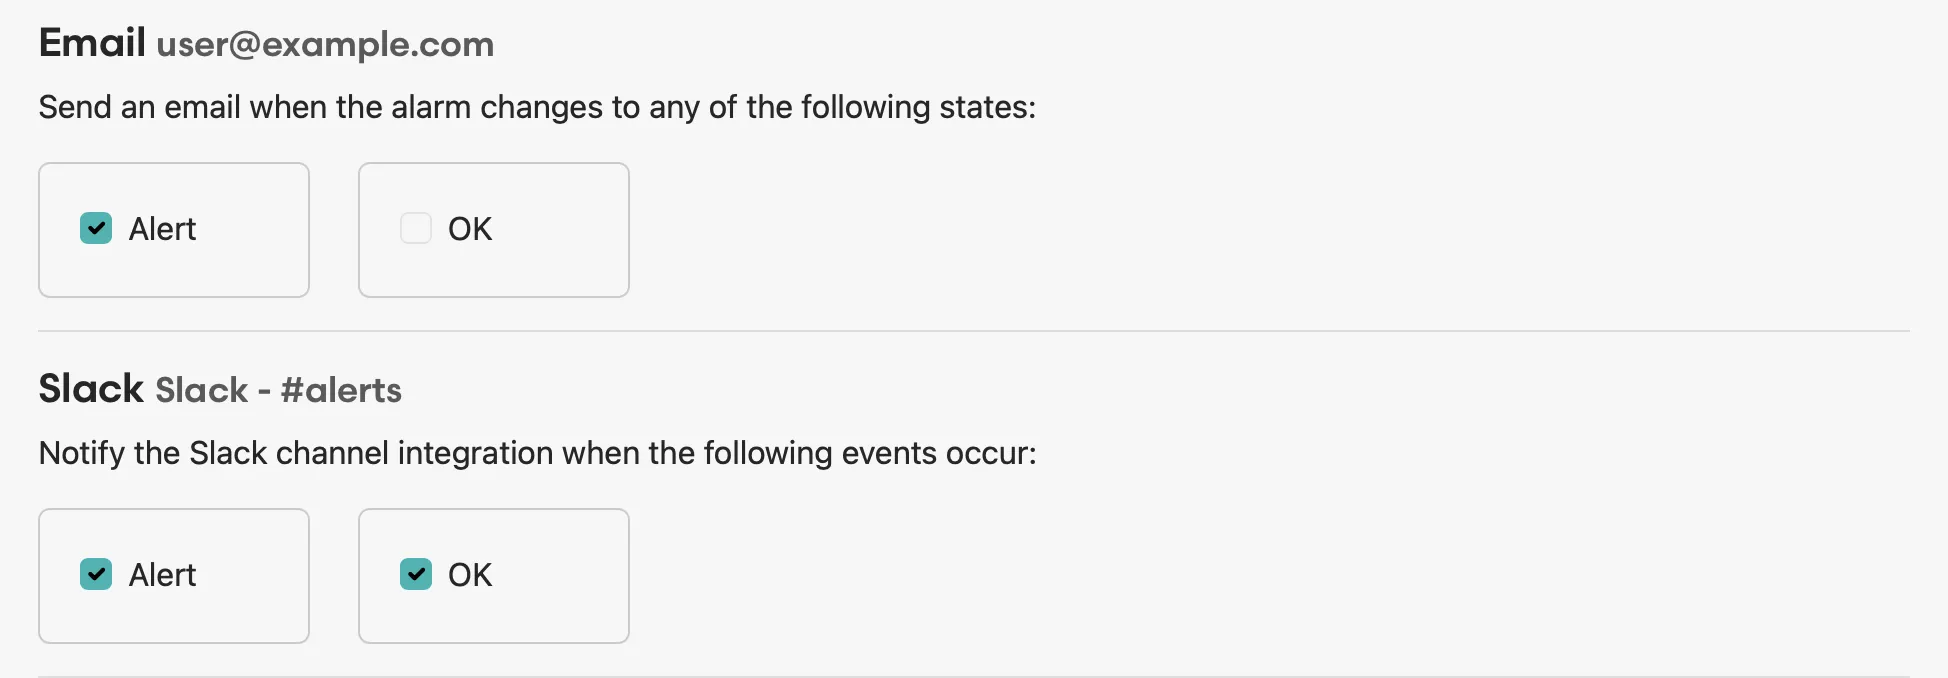
# Archive destinations
> Replicate Honeybadger Insights stream data to an S3-compatible bucket you own.
Archive destinations replicate the events flowing into your Honeybadger [Insights streams](/guides/insights/#streams) to an S3-compatible bucket that you own and control. Once a destination is configured and a stream is attached, Honeybadger writes a continuous archive of that stream’s events into your bucket. This is useful for long-term retention beyond your Insights data window or for feeding events into your own data warehouse or lake. 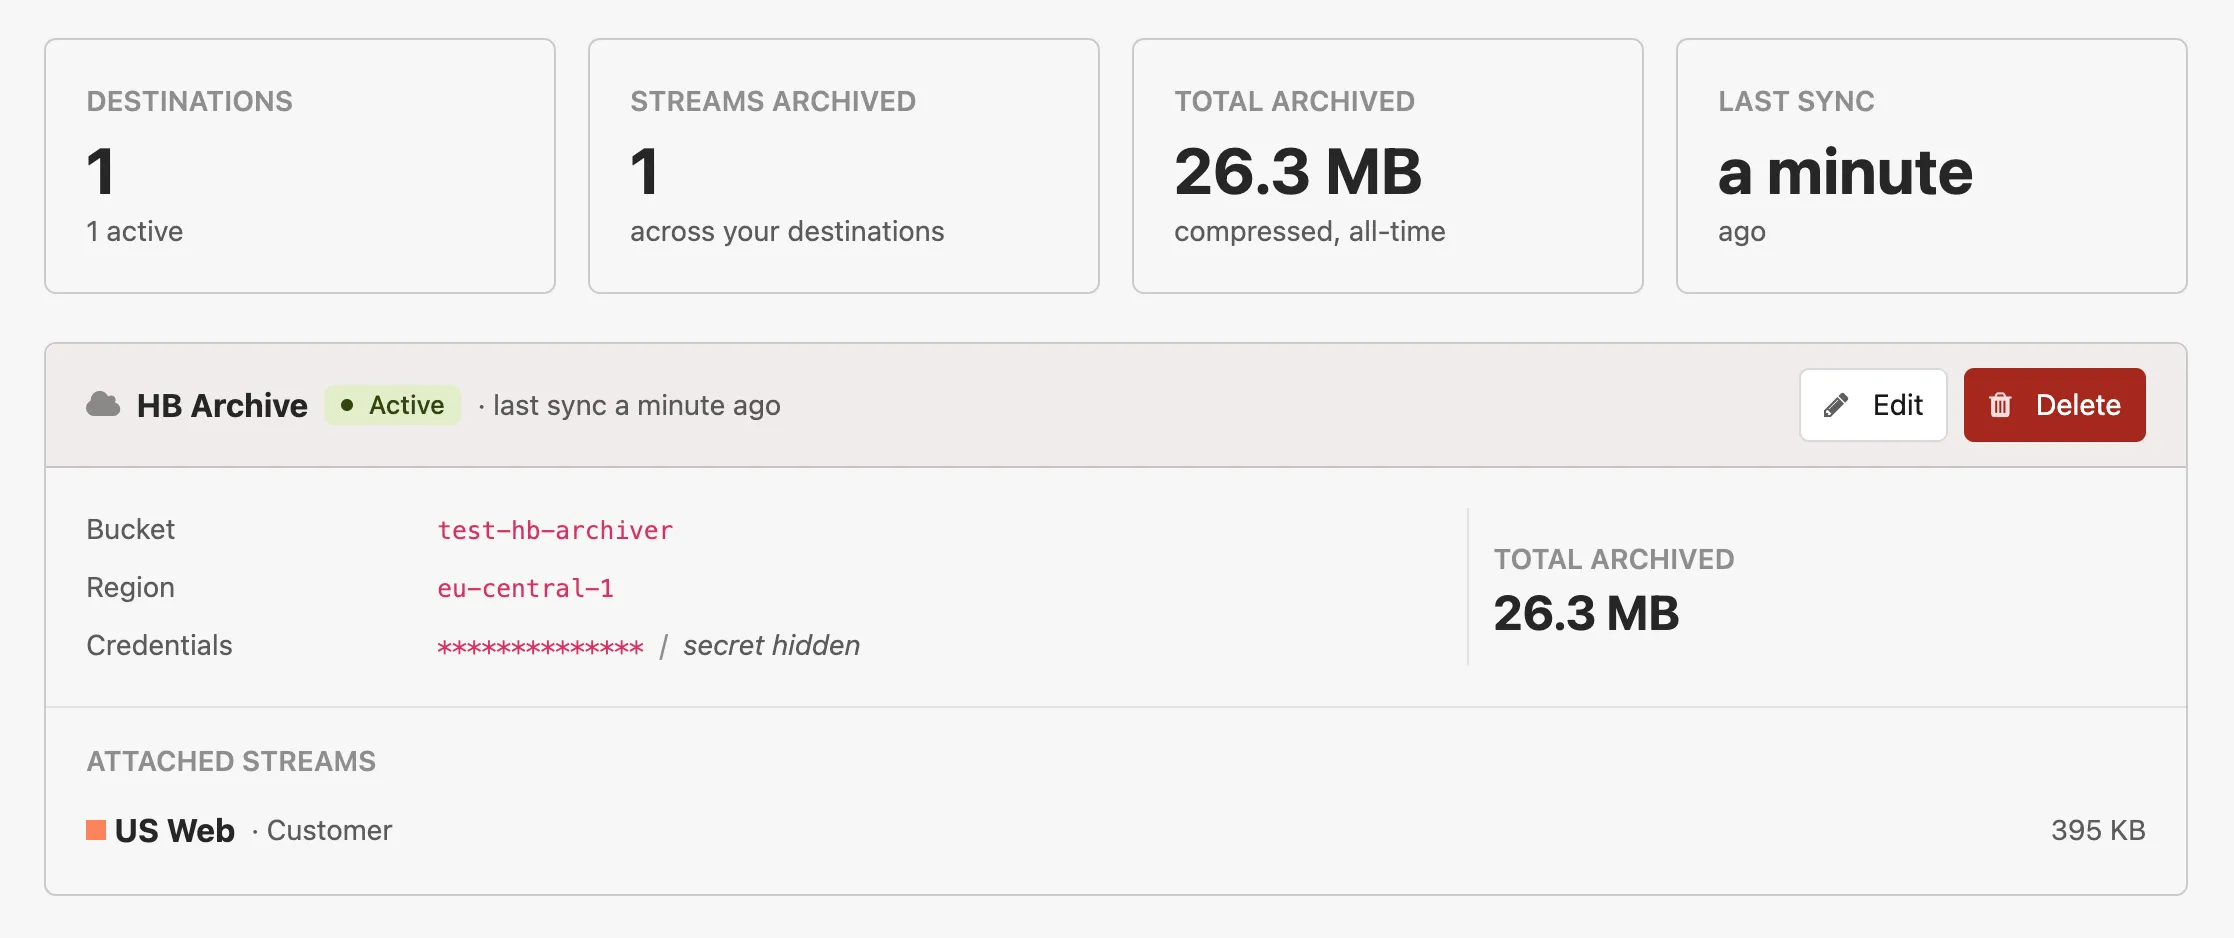 ## What gets archived [Section titled “What gets archived”](#what-gets-archived) Only the events that flow through your Insights streams are replicated: * The custom events your application sends to Insights via the [Events API](/api/reporting-events/) or a Honeybadger client library. * The internal events Honeybadger generates for your project — error notifications, deployments, uptime checks, check-in reports, and so on. Detailed error data such as backtraces, breadcrumbs, and environment variables is **not** included. Archive destinations replicate distilled stream events, not full error payloads. You choose which streams replicate to which destination, so you can archive just your application events, just the internal Honeybadger events, or both. ## Supported providers [Section titled “Supported providers”](#supported-providers) You can point a destination at any of these S3-compatible providers: * Amazon S3 * Cloudflare R2 * Google Cloud Storage (S3-compatible interop endpoint) * Wasabi * Backblaze B2 * DigitalOcean Spaces The endpoint must use HTTPS. AWS S3 buckets are detected from the bucket name and don’t require an endpoint URL — for the others, set the provider’s S3-compatible endpoint URL on the destination. ## Setting up a destination [Section titled “Setting up a destination”](#setting-up-a-destination) Archive destinations are managed at the account level under **Account Settings → Archive Destinations**. ### 1. Create the bucket [Section titled “1. Create the bucket”](#1-create-the-bucket) Create a bucket on your provider of choice. A fresh bucket dedicated to Honeybadger archives is the simplest setup, but you can also add archives to an existing bucket by configuring a prefix on the destination. ### 2. Create credentials [Section titled “2. Create credentials”](#2-create-credentials) Create an access key and secret with permission to write to that bucket. The archiver only needs to upload objects — at minimum: * `s3:PutObject` on the bucket (scoped to your prefix is fine) No read, list, or delete permissions are required. We recommend creating a dedicated IAM user (or equivalent on your provider) scoped to just the archive bucket so the credentials you give Honeybadger can’t reach anything else. For example, on AWS S3 a minimal policy looks like:
```json
{
"Version": "2012-10-17",
"Statement": [
{
"Effect": "Allow",
"Action": "s3:PutObject",
"Resource": "arn:aws:s3:::your-bucket-name/*"
}
]
}
```
If you scope to a prefix, change the resource to `arn:aws:s3:::your-bucket-name/your-prefix/*`. Objects are uploaded with AES-256 server-side encryption (SSE-S3) by default. If your bucket policy enforces a specific encryption type, make sure SSE-S3 is allowed. ### 3. Add the destination in Honeybadger [Section titled “3. Add the destination in Honeybadger”](#3-add-the-destination-in-honeybadger) In **Account Settings → Archive Destinations**, click **New destination** and fill in: * **Name** — a short label that’s unique within your account. * **S3 bucket** — the bucket name. * **Prefix** *(optional)* — a key prefix that all archived objects will be written under. Useful if the bucket is shared with other data. * **Region** *(optional, required for AWS S3)* — e.g. `us-west-2`. * **Endpoint URL** *(optional)* — leave blank for AWS S3. Set this to the provider’s S3-compatible endpoint for R2, GCS, Wasabi, Backblaze, or DigitalOcean Spaces. * **Access key ID** and **Secret access key** — the credentials from step 2. Credentials are encrypted at rest. When editing an existing destination, leave the credential fields blank to keep the stored values; fill them in to rotate. ### 4. Attach streams [Section titled “4. Attach streams”](#4-attach-streams) A destination with no streams attached is **paused** — nothing replicates until you select at least one stream. On the destination form, pick the streams you want to replicate. Each stream can only be attached to one destination at a time. Streams start replicating on the next archive cycle. There’s no backfill — only events ingested after a stream is attached will land in your bucket. ## File structure [Section titled “File structure”](#file-structure) Objects are gzip-compressed JSON Lines (one event per line, served with `Content-Type: application/jsonl`). The key layout is:
```plaintext
[prefix/]insights/{stream_id}/{YYYY}/{MM}/{DD}/{HH}/{unix_timestamp}_{random_hex}.jsonl.gz
```
For example, with prefix `honeybadger`:
```plaintext
honeybadger/insights/abc123/2026/04/30/14/1714485612_a3f80c1d4e2b9876.jsonl.gz
```
The path components: * `prefix/` — the optional prefix you configured on the destination. * `insights/{stream_id}/` — fixed prefix plus the stream ID. * `{YYYY}/{MM}/{DD}/{HH}/` — UTC ingestion hour the events fell into. This is based on when the events were received by Honeybadger, not when the file was written, so a delayed write still lands in the hour it logically belongs to. * `{unix_timestamp}_{random_hex}.jsonl.gz` — a unique object name within the hour. Each object decompresses to JSON Lines: one JSON object per line, one event per line. ## Object frequency [Section titled “Object frequency”](#object-frequency) Honeybadger periodically writes new objects into your bucket for each active stream. The exact cadence isn’t guaranteed and may vary over time, so the important model to keep in mind is: > Concatenating every object under a stream’s prefix gives you that stream’s full event history. No single object contains all of a stream’s events — each object is a fragment. To reconstruct events for a time range, list every object under `insights/{stream_id}/{YYYY}/{MM}/{DD}/{HH}/` for the hours you care about and concatenate their decompressed contents. Tools like AWS Athena, DuckDB, ClickHouse, and most data warehouses can read directories of gzipped JSON Lines files directly without needing to merge them yourself. ## Status, pauses, and errors [Section titled “Status, pauses, and errors”](#status-pauses-and-errors) Each destination is in one of three states: * **Active** — at least one stream is attached and writes are succeeding. * **Paused** — the destination is configured but no streams are attached. Attach a stream to start. * **Errored** — Honeybadger has stopped writing to the bucket. Events for attached streams are dropped until you fix the destination and reactivate it. Honeybadger transparently handles short-term failures on the bucket’s side — we retry and buffer events through network blips, timeouts, and brief outages, so most disruptions recover without you noticing. If a destination keeps failing or hits a problem we can’t recover from on our own (invalid credentials, a missing bucket, a permission change), we move it to the **errored** state and email the account owner with the details. The destination card shows the last error message and when it occurred. To recover, fix the underlying issue and either save the destination with corrected credentials — a successful save reactivates it automatically — or click **Reactivate** if only a transient issue needed clearing. If the underlying problem isn’t actually fixed, the next archive write will flip the destination back to errored. ## Deleting a destination [Section titled “Deleting a destination”](#deleting-a-destination) Deleting a destination immediately stops new writes for any attached streams. Objects that have already been written to your bucket are **not** deleted — they’re yours, and Honeybadger never reads or removes them after upload. If you want to fully clean up, delete the bucket (or the objects under your prefix) yourself once you no longer need the archived data.
# BadgerQL guide
> Learn how to use BadgerQL to query your log events and observability data in Honeybadger Insights.
BadgerQL is the language you use to interact with your data stored in Insights. It was designed to enable you to enrich, shape, and combine your events so you can craft any view of your data. Quick reference docs are also available in the application via the book icon in the top-right corner of the query box. 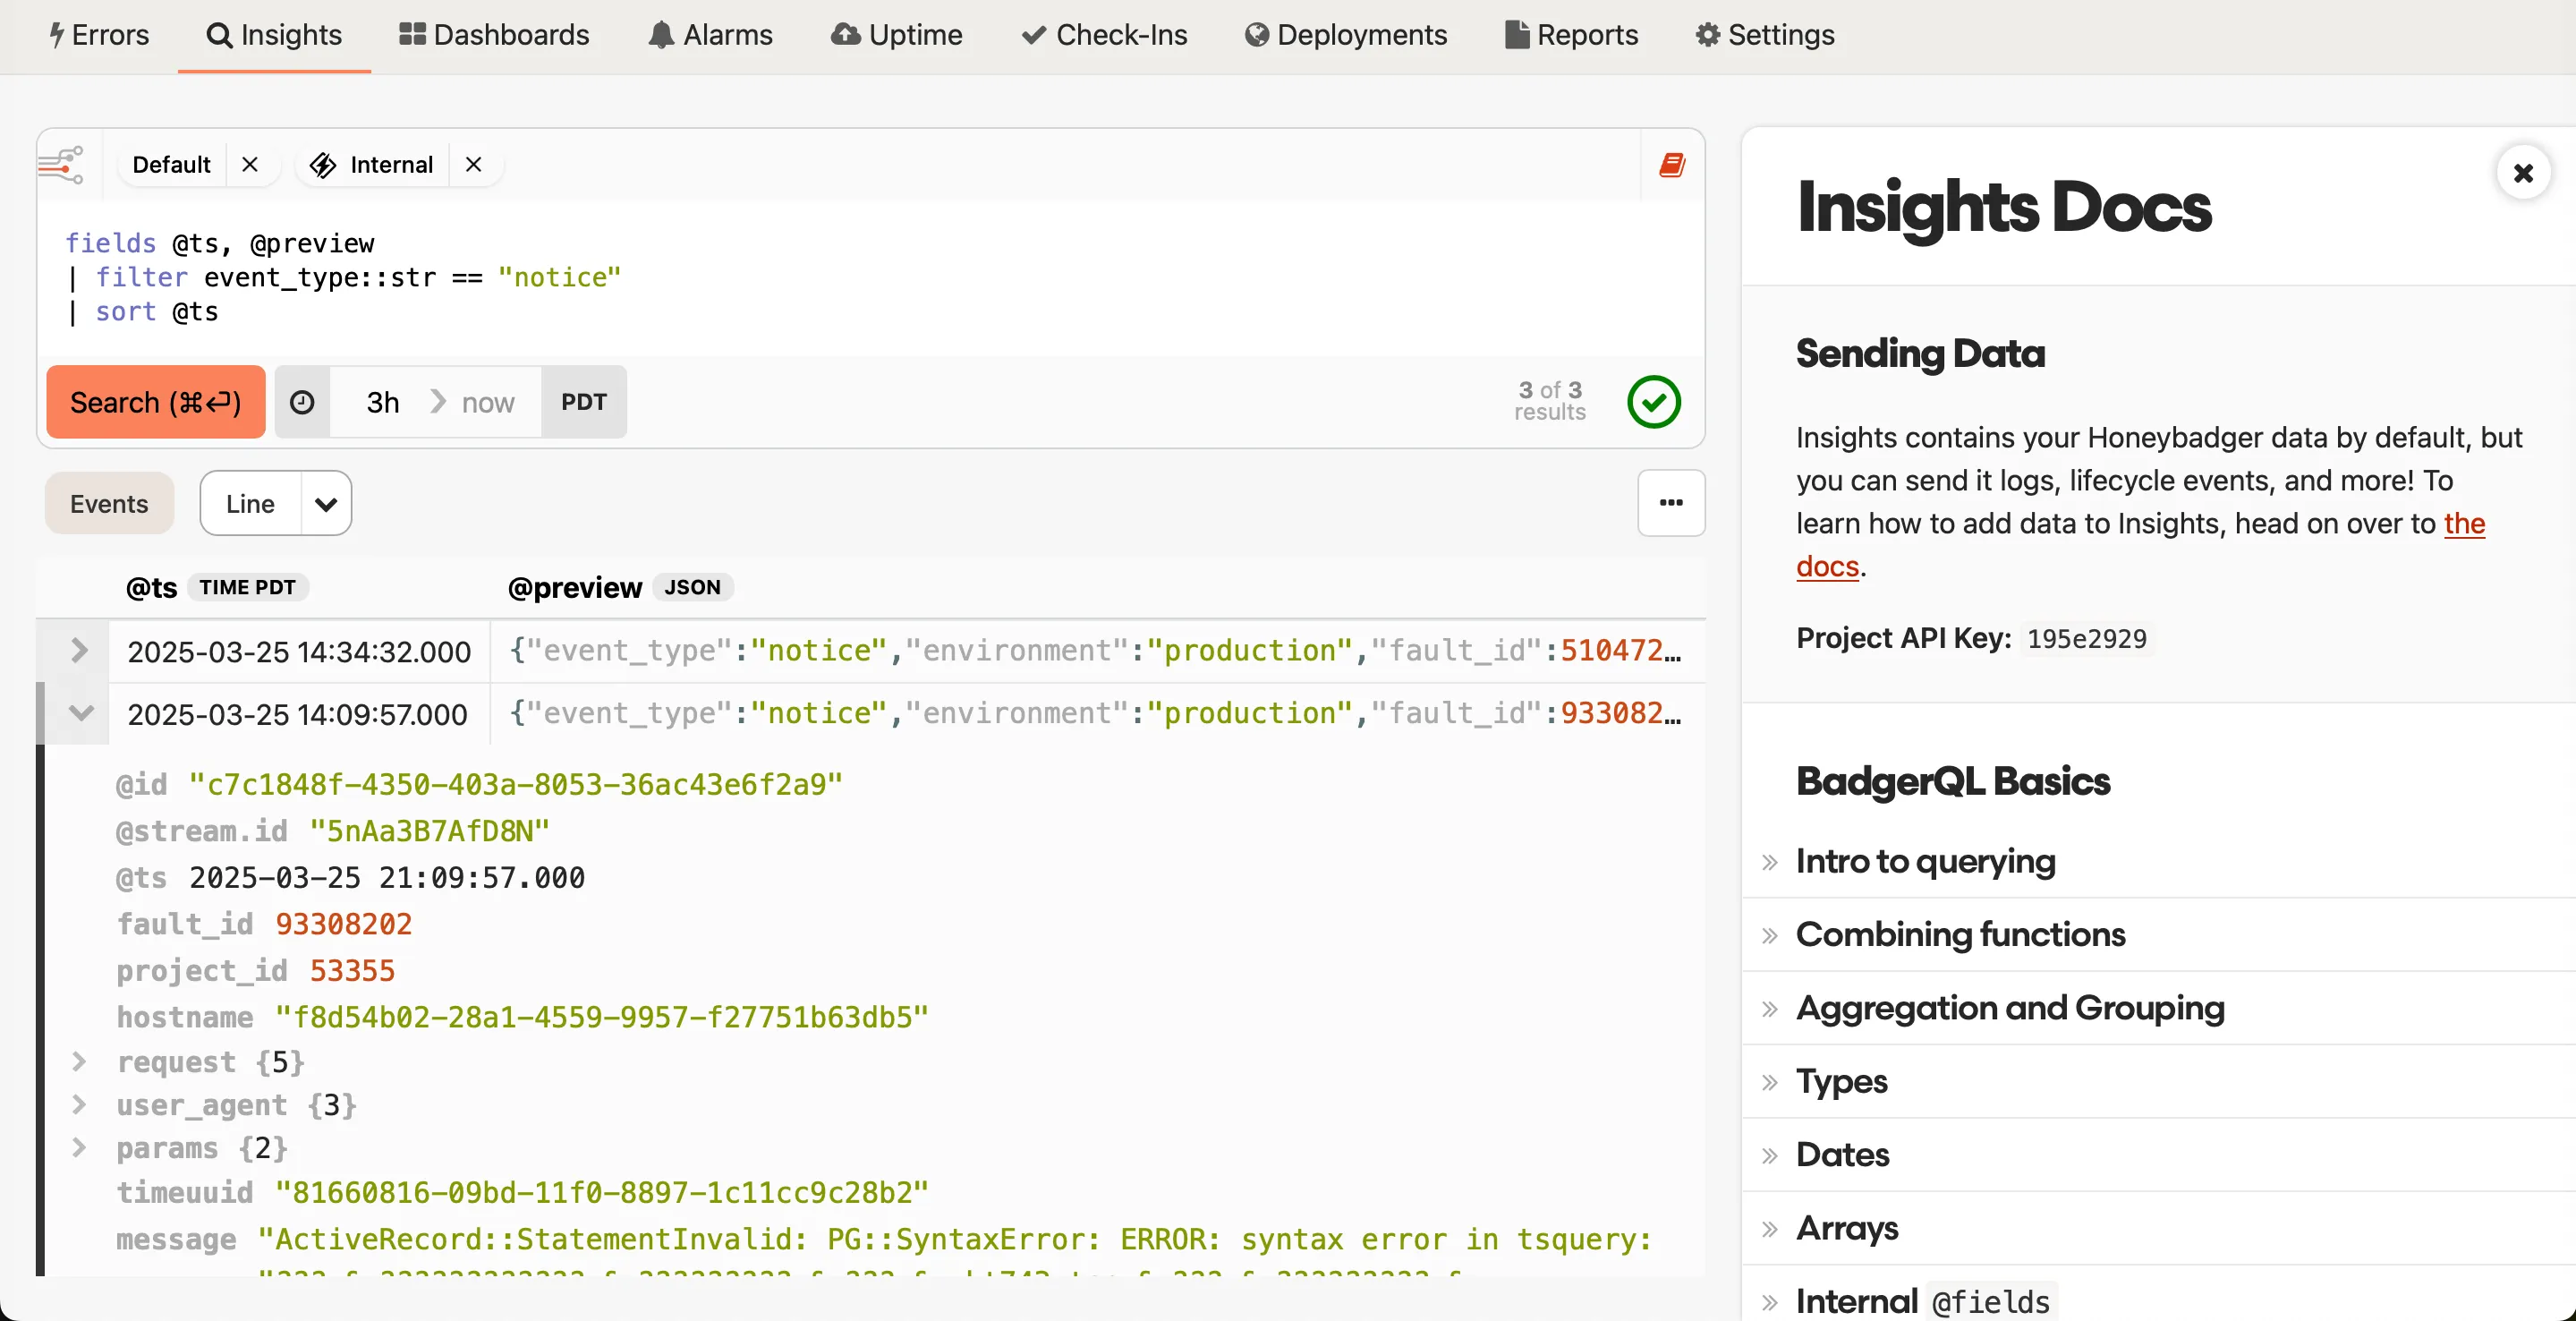 We also provide inline hints in the query editor that show info from the quick reference docs as you type: 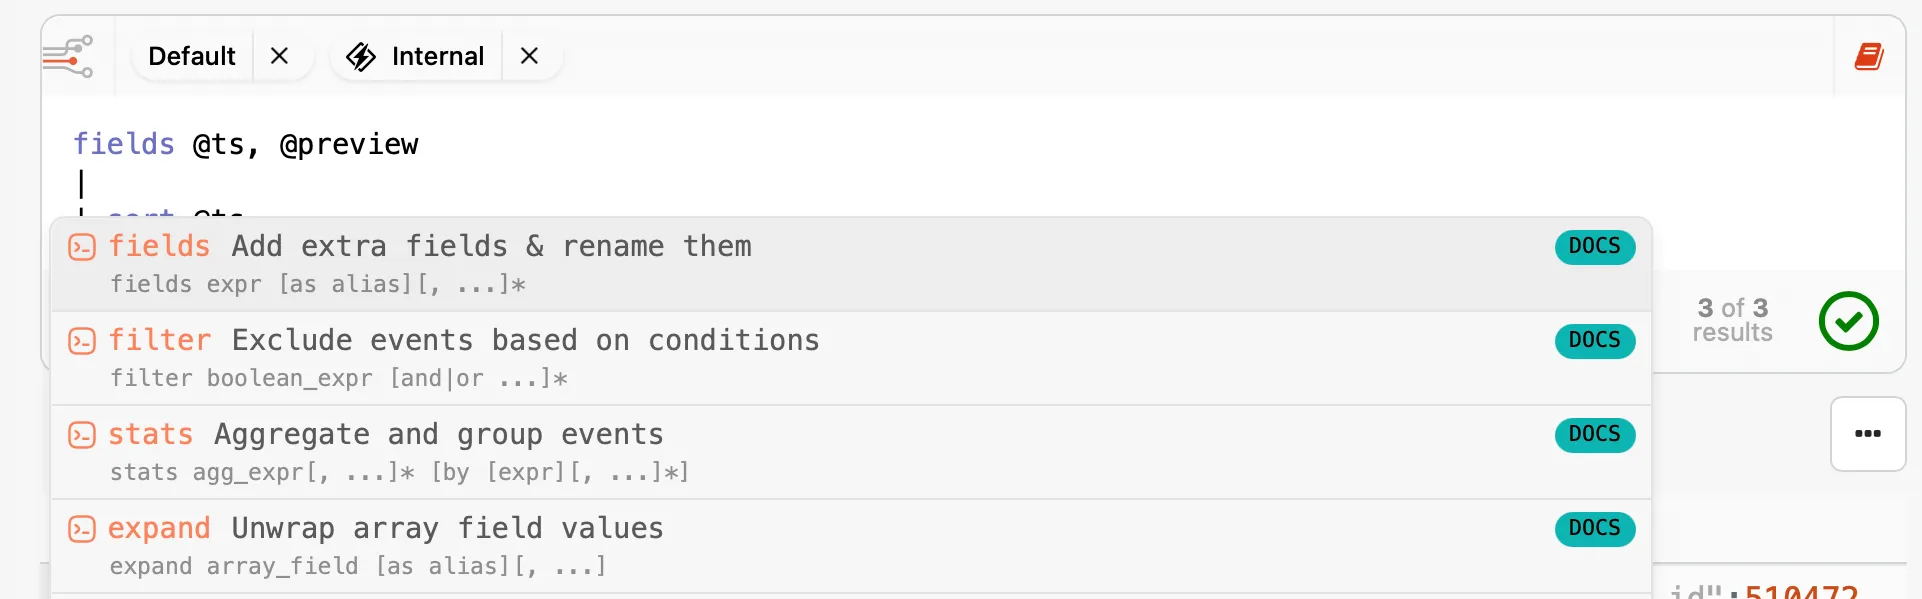 Need a hand crafting BadgerQL queries? The natural language query translator can [translate plain-English descriptions](/guides/insights/#natural-language-queries) into queries, visualizations, and time ranges. ## Example queries and use cases [Section titled “Example queries and use cases”](#example-queries-and-use-cases) Find N+1 queries in your Rails app:
```badgerql
filter event_type::str == "sql.active_record"
| stats count() as queryCt, sum(duration::float) by request_id::str, query::str
| sort queryCt desc
```
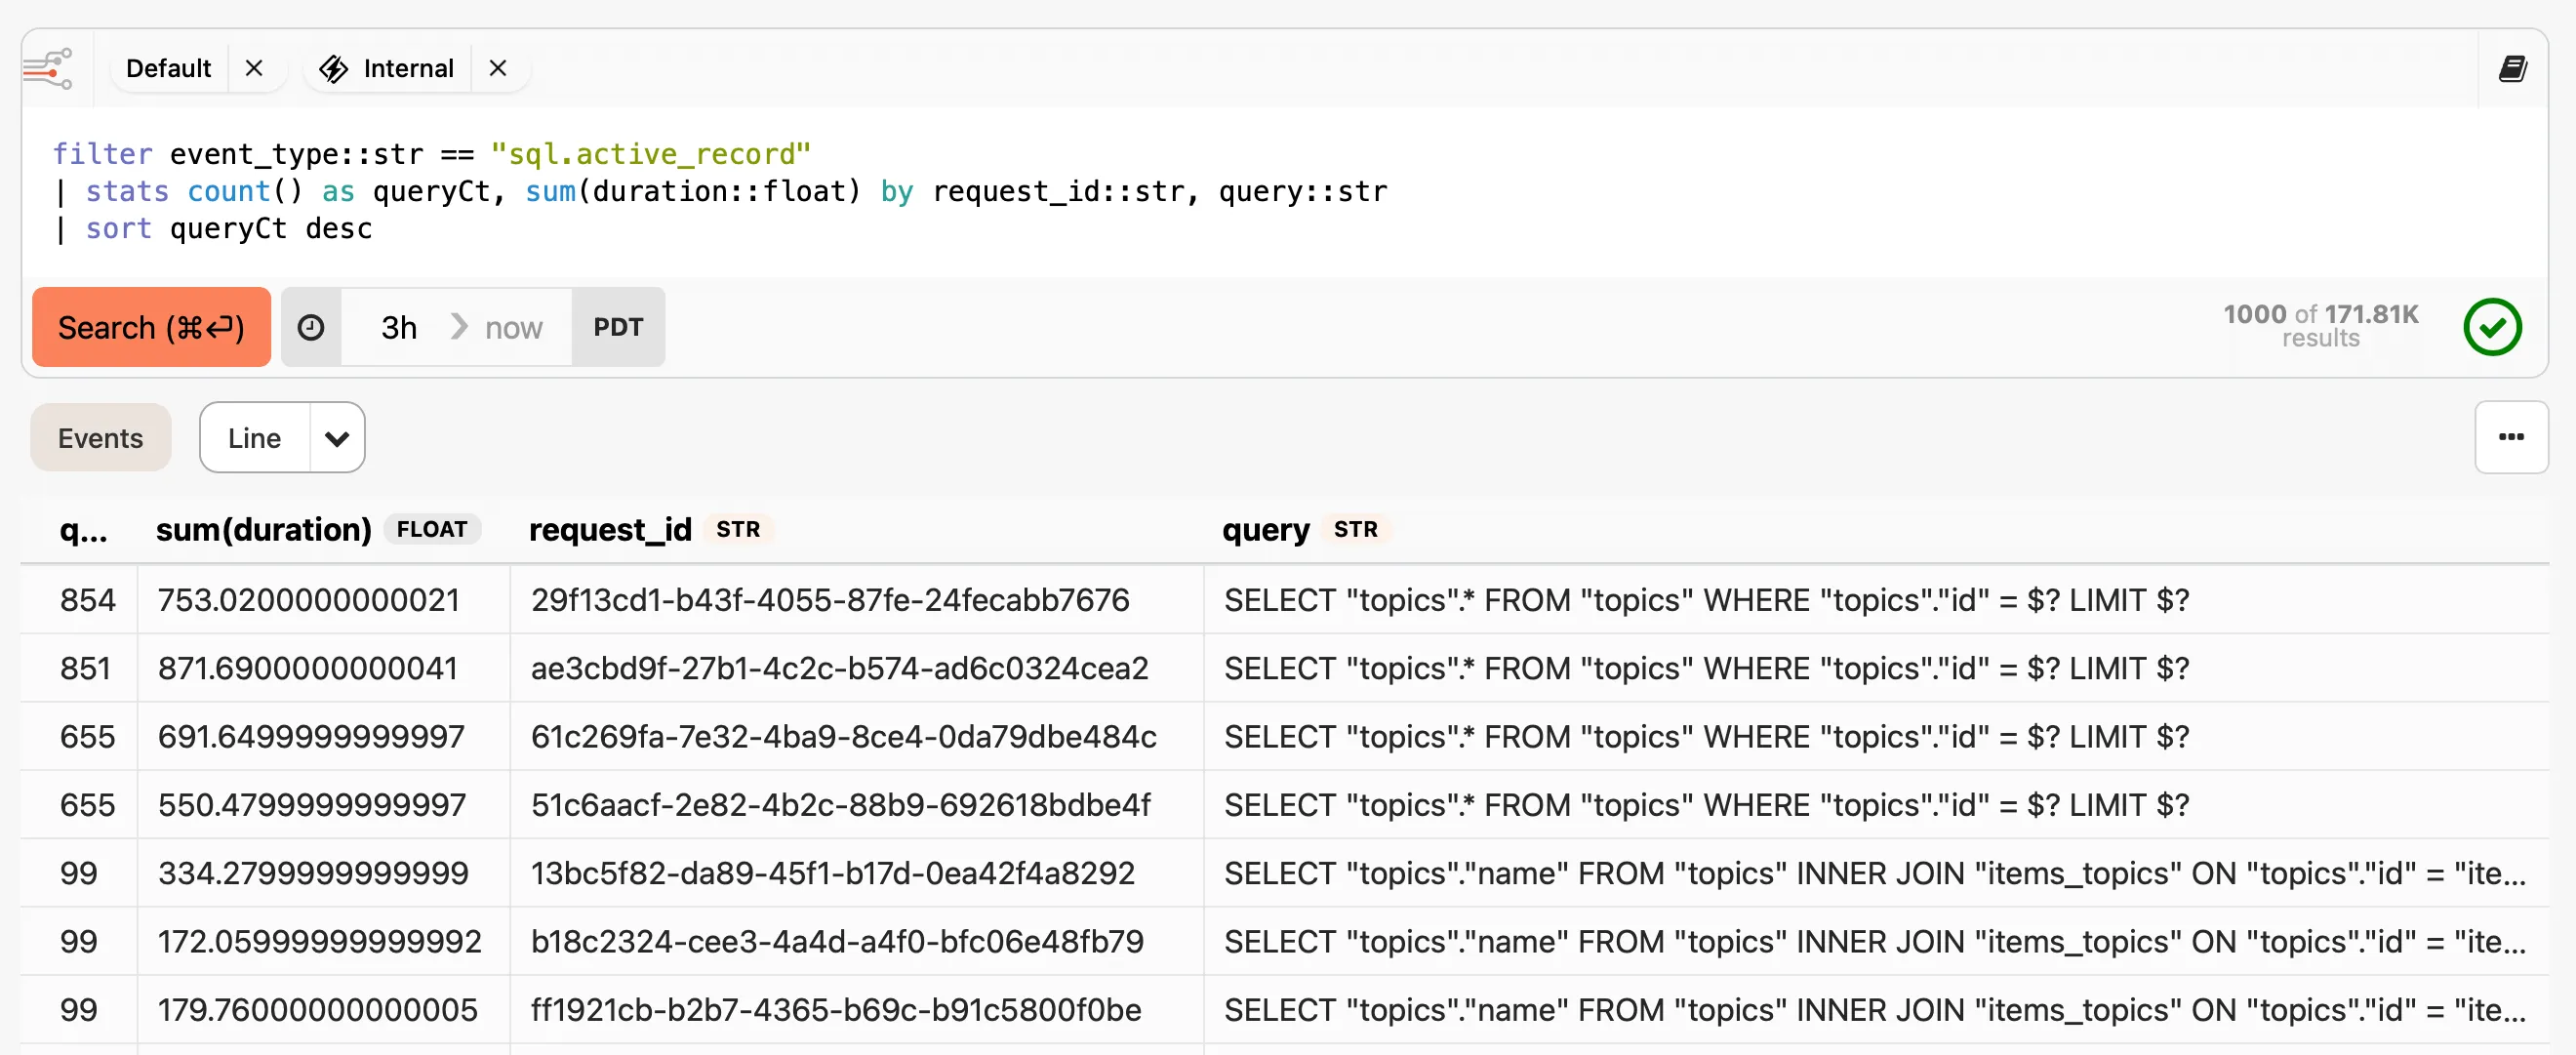 What events are consuming my Insights quota? Be sure to deselect the [Internal Stream](/guides/insights/#streams) so you only see the data you are sending:
```badgerql
stats sum(@size) as size by event_type::str
| sort size
| only toHumanString(size, "bytes"), event_type
```
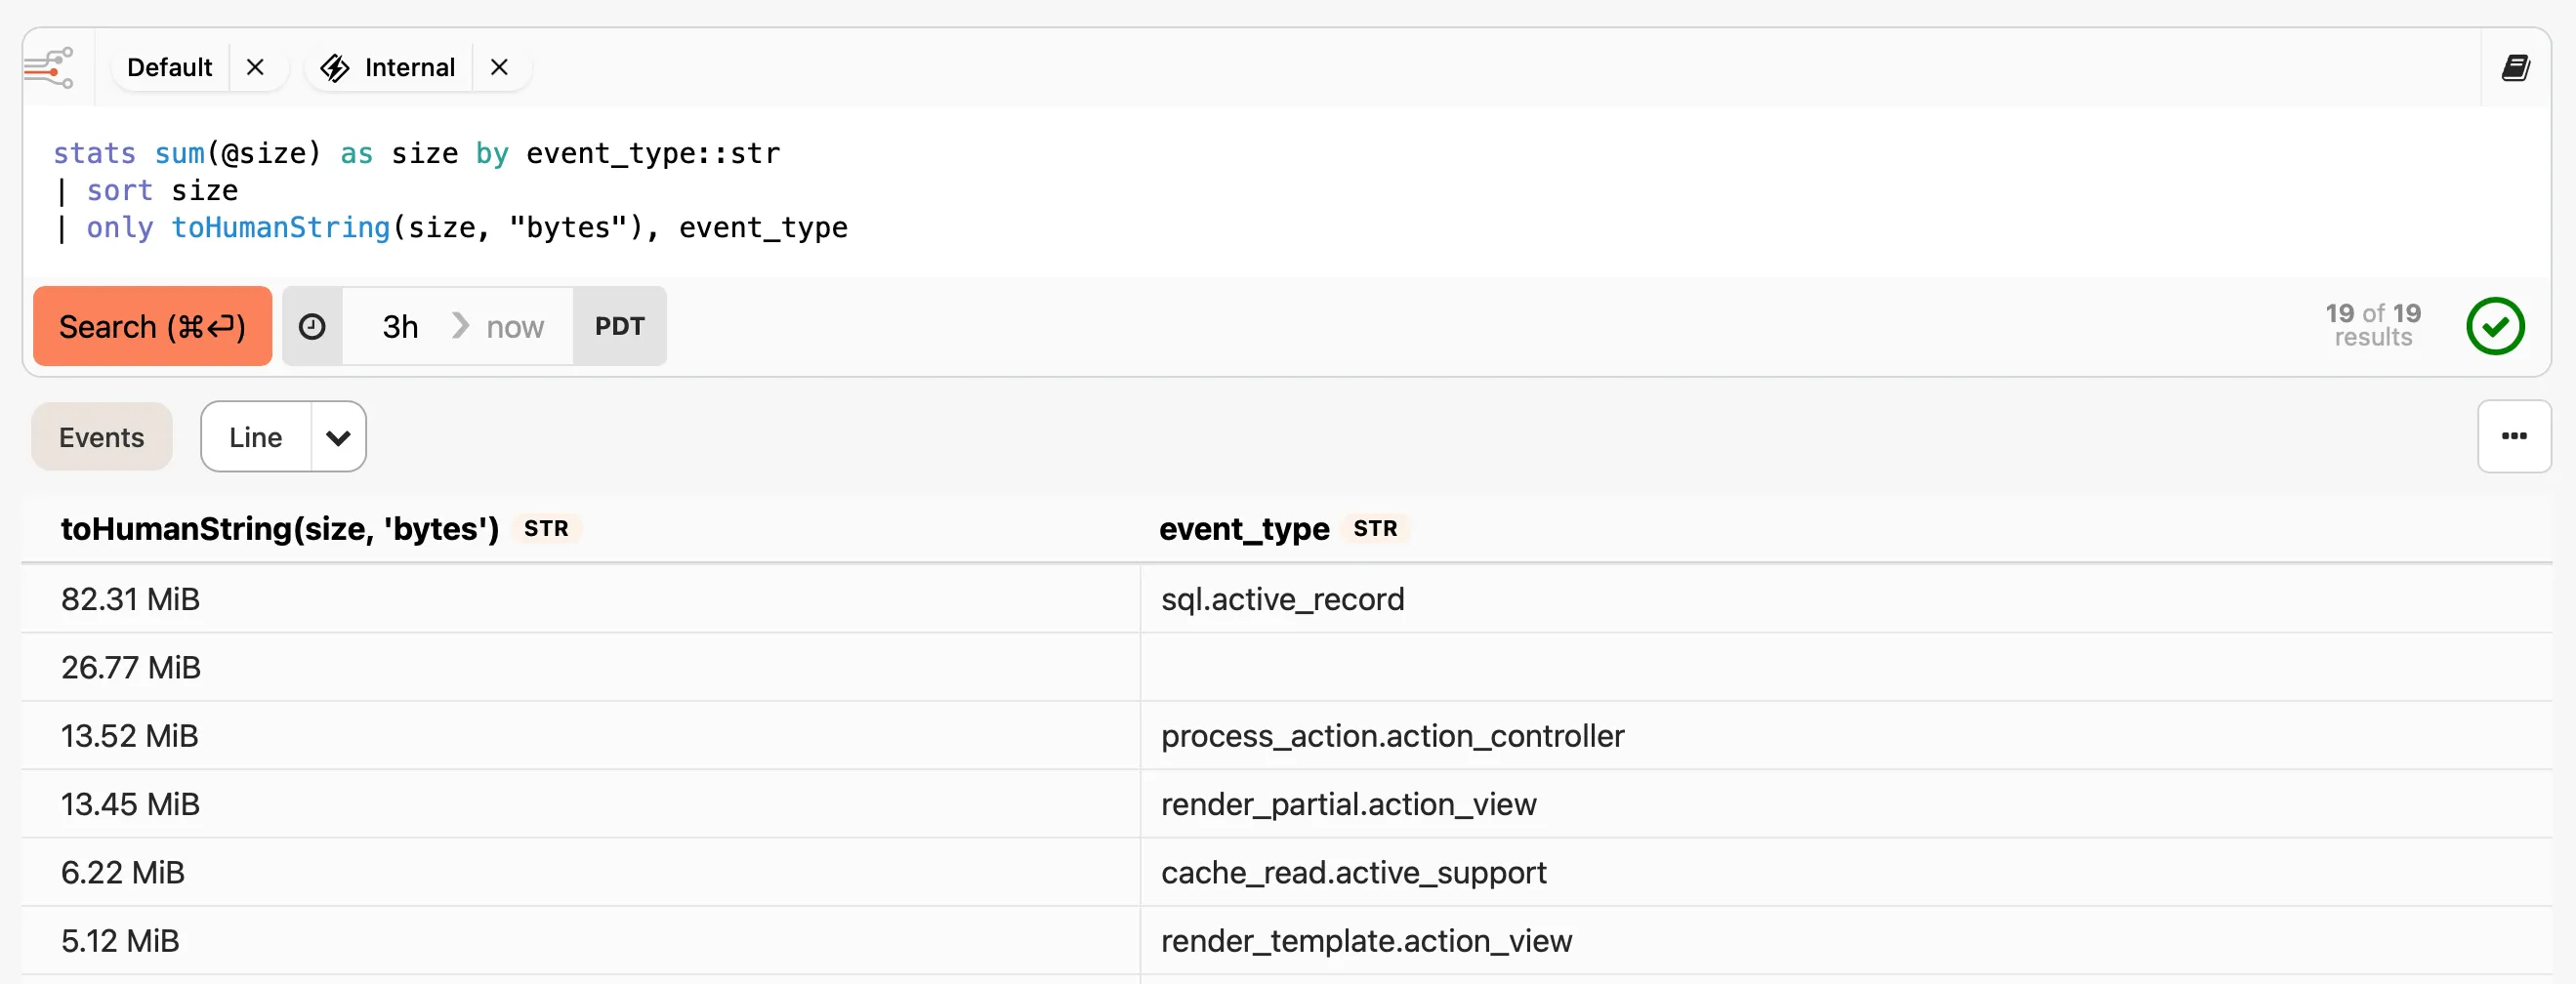 See more examples in the [walk-through](/guides/insights/#walk-through) or review the full BadgerQL reference below for more information. ## Parameterized queries [Section titled “Parameterized queries”](#parameterized-queries) Parameterized queries let you swap values into a query at runtime without editing the query itself. You can filter a dashboard to a single host, environment, or customer; share a prefilled URL with a teammate; or reuse the same widget across multiple contexts. Parameters work anywhere you write BadgerQL, including dashboard widgets and the Insights query editor. Use `${name}` to reference a parameter in a query:
```badgerql
filter hostname::str == "${hostname}"
```
Provide a default with `${name:-default}`:
```badgerql
filter env::str == "${env:-production}"
```
Parameter names must start with a letter or underscore, followed by letters, numbers, or underscores. Parameter values can be provided in the URL (e.g., `?hostname=web-01`), allowing you to share query URLs with prefilled values, or by clicking the parameters button (the slider icon in the dashboard toolbar, next to the date picker) to open a popover with a field for each parameter used in the query. ## Functions to enrich, shape, and combine data [Section titled “Functions to enrich, shape, and combine data”](#functions-to-enrich-shape-and-combine-data) Functions are the core of BadgerQL. You can think of your data falling or piping through each function that you specify, getting filtered, aggregated, and so on along the way. The most common functions you will use are [`fields`](#fields) to select fields to view, [`filter`](#filter) to restrict what data appears in the results, and [`stats`](#stats) to do counts, averages, and other analyses. Keep reading to learn about all the functions we offer. ### Combining functions [Section titled “Combining functions”](#combining-functions) While calling a BadgerQL function on its own can produce interesting results, the real power comes when piping functions together via the pipe (`|`) operator:
```badgerql
fields status_code::int, controller::str
| filter startsWith(controller, "Stripe")
| stats count() by status_code
```
Each function builds off the other to create a result showing the distribution of status codes just for Stripe controller requests. Note that BadgerQL does not work like SQL. Each successive function is applied to the result of the previous, so you can only reference fields down the pipeline. For example, if you want to convert a string to a number gathered from a `parse` function, you can pipe into another `fields` function:
```badgerql
parse url::str /id=(?\d+)/
| fields toInt(id) as id
```
### Expand [Section titled “Expand”](#expand) You can use `expand` to turn an event that has a field with array data into multiple events.
```badgerql
expand array_field [as alias][, ...]
```
With data that has a single event like `{"id": 1, "charges": [700, 430, 200]}`, the following query will return three events, with `id` and `charge` fields:
```badgerql
expand charges[*]::int as charge
```
See the [Arrays](#arrays) section for more detail on working with array data. ### Fill [Section titled “Fill”](#fill) Use `fill` to inject events for missing data points.
```badgerql
fill field_expression [as alias] [asc|desc|up|down] [from ...] [to ...] [step ...] [across field [bounded | including [...]]]* [with field[ = expression][, ...]*]
```
Unless specified with `from` or `to`, `fill` will determine the min and max values of the `field_expression`, sort, and produce new events with missing `field_expression` values replaced by the incremented or decremented step value. `field_expression` only allows for `number` or `temporal` types. The resulting optional clause types differ based on the resolved type:
```badgerql
fill number [from number] [to number] [step number]
fill temporal [from temporal] [to temporal] [step interval]
```
Fill works best when referencing an already existing field. Since fill inserts data at a regular interval, you will also get the best results if the field follows the step size of the fill. #### Typical usage [Section titled “Typical usage”](#typical-usage) Take a `stats` call that bins the count of events per hour:
```badgerql
stats count() as ct by bin(1h) as bin
```
You might get sparse results if there is not enough data to fill each bin: | ct | bin | | -- | ----------------------- | | 5 | 2023-04-05 02:00:00.000 | | 10 | 2023-04-05 04:00:00.000 | | 2 | 2023-04-05 06:00:00.000 | With the `fill` function (the step is inferred from `bin()`, so a bare `fill bin` is enough):
```badgerql
stats count() as ct by bin(1h) as bin
| fill bin
```
You can produce a full binned result set: | ct | bin | | -- | ----------------------- | | 5 | 2023-04-05 02:00:00.000 | | 0 | 2023-04-05 03:00:00.000 | | 10 | 2023-04-05 04:00:00.000 | | 0 | 2023-04-05 05:00:00.000 | | 2 | 2023-04-05 06:00:00.000 | #### Automatic step from `bin()` and `bucket()` [Section titled “Automatic step from bin() and bucket()”](#automatic-step-from-bin-and-bucket) If the fill field comes from a `bin()` or `bucket()`, you don’t need to repeat the step. `fill` picks it up automatically. `bin(1h)` gives you a 1-hour step, `bucket(x, 100)` gives you a 100-wide step, and the bounded form `bucket(x, 0, 1000, 20)` gives you from, to, and step all at once. You can still pass an explicit `step`, `from`, or `to` to override.
```badgerql
stats count() as ct by bucket(duration::int, 0, 2000, 20) as ms
| fill ms
| sort ms asc
```
The bucket width is `2000 / 20 = 100`, so `fill` inserts a row for every 100-wide slot that had no matching events: | ct | ms | | -- | --- | | 12 | 0 | | 0 | 100 | | 0 | 200 | | 45 | 300 | | 30 | 400 | | 0 | 500 | | … | … | #### Filling across dimensions [Section titled “Filling across dimensions”](#filling-across-dimensions) Add `across ` to fill every combination of the fill field and a grouping dimension. This is useful for stacked charts, heatmaps, or any per-category series where you want explicit zeros instead of missing rows.
```badgerql
stats count() as count by bin(1h) as t, status::str
| fill t across status
```
Every combination of time bin and status gets a row, with 0 for missing cells: | count | t | status | | ----- | ----------------------- | ------ | | 8 | 2023-04-05 02:00:00.000 | 200 | | 0 | 2023-04-05 02:00:00.000 | 500 | | 0 | 2023-04-05 03:00:00.000 | 200 | | 3 | 2023-04-05 03:00:00.000 | 500 | You can chain multiple `across` clauses:
```badgerql
stats count() as count by bin(1h) as t, status::str, region::str
| fill t across status across region
```
Counting aggregates (`count`, `sum`, `unique` and their `*If` variants) default to 0 on filled cells. Everything else defaults to null. Use `with field = value` to pick a different default. ##### `bounded` [Section titled “bounded”](#bounded) Without `bounded`, `across` fills every category across the entire range of the fill field. Say `temp` reported from 02:00–04:00 and `humidity` only reported at 05:00. Plain `across` would create rows for both sensors across the full 02:00–05:00 range. `across field bounded` limits each category to its own observed range instead:
```badgerql
stats count() as count by bin(1h) as t, sensor::str
| fill t across sensor bounded
```
| count | t | sensor | | ----- | ----------------------- | -------- | | 5 | 2023-04-05 02:00:00.000 | temp | | 0 | 2023-04-05 03:00:00.000 | temp | | 3 | 2023-04-05 04:00:00.000 | temp | | 7 | 2023-04-05 05:00:00.000 | humidity | No rows for `humidity` at 02:00–04:00, and no rows for `temp` at 05:00. You can’t combine `bounded` with `including` on the same dimension, or with explicit `from`/`to`. ##### `including` [Section titled “including”](#including) `across field including [...]` ensures specific values show up in the result even if they’re missing from the data. The pinned values are added on top of whatever the query discovers, so you won’t lose any existing categories. All values in the array must be the same type.
```badgerql
stats count() as count by bin(1h) as t, op::str
| fill t across op including ["create", "delete"]
```
The `"create"` and `"delete"` values appear even if the data only contains `"update"` events: | count | t | op | | ----- | ----------------------- | ------ | | 0 | 2023-04-05 02:00:00.000 | create | | 0 | 2023-04-05 02:00:00.000 | delete | | 4 | 2023-04-05 02:00:00.000 | update | | 1 | 2023-04-05 03:00:00.000 | create | | 0 | 2023-04-05 03:00:00.000 | delete | | 0 | 2023-04-05 03:00:00.000 | update | This is also useful for keeping chart legends stable. If a category has zero events across the entire query range, `across` alone won’t include it. `including` pins those categories into the result so they always appear. #### Fill order [Section titled “Fill order”](#fill-order) By default, the fill function sorts the `field_expression` in ascending order before injecting fill events. You can change this by providing an order direction after the `field_expression`:
```badgerql
fill @ts desc step -1h
```
When filling in descending order, `from` must be greater than `to` and `step` must be a negative value. #### `@fill` internal field [Section titled “@fill internal field”](#fill-internal-field) Filled events have an additional internal `@fill` field added to the results. You can use this field to determine when an event is filled:
```badgerql
fields @fill
| fill duration::int from 100 to 500 step 100
```
| @fill | duration | | ----- | -------- | | true | 200 | | true | 300 | | | 325 | | true | 400 | #### Filling other fields [Section titled “Filling other fields”](#filling-other-fields) Most fields other than `field_expression` will be filled with a null value for injected events. You can control what data is replaced using the `with` clause. Setting the `with` field to the `field_expression` will result in an error. If `with` is given only a field, it will carry over the field value from the previous event:
```badgerql
fields @fill, controller::str
| fill duration to 340 step 10 with controller
```
| @fill | duration | controller | | ----- | -------- | ---------- | | | 300 | login | | true | 310 | login | | | 320 | sign-up | | true | 330 | sign-up | `with` fields can also be set to specific values for filled events:
```badgerql
stats avg(temp::float) as avgTemp by bin(1d) as bin
| fill bin step 1d with avgTemp = 65.0
```
| avgTemp | bin | | ------- | ---------- | | 73.3 | 2023-04-08 | | 65.0 | 2023-04-09 | | 68.9 | 2023-04-10 | | 65.0 | 2023-04-11 | Referencing other fields from previous events is also possible, acting like a `LAST_VALUE()` window function. #### Notes [Section titled “Notes”](#notes) * Having multiple fills is possible by piping together `fill` functions, but take care to ensure you are not injecting too many events. * `from` and `to` values are not inclusive when producing injected results. ### Fields [Section titled “Fields”](#fields) The `fields` function enriches your results by adding extra fields. Any fields that you select or alias can be referenced in later functions, and they will be returned in the final dataset unless rewritten by later functions.
```badgerql
fields expr [as alias][, ...]*
```
Fields can be aliased with the `as` clause, and unsupported characters (like spaces) can be used by using backticks.
```badgerql
fields user_name::str as `User name`
```
Aliased fields can be used in later functions:
```badgerql
fields concat(first_name::str, " ", last_name::str) as full_name
| filter full_name match /^Bob.*/
```
#### Internal fields [Section titled “Internal fields”](#internal-fields) We set the following internal fields for you as the data is ingested: | Name | Type | Description | | ----------------- | ------------- | ------------------------------------------------------------------------------------------------------------------------------------------------------------------------------------------------------------------ | | `@id` | `String` | The event ID | | `@ts` | `DateTime` | The reported timestamp if provided as `ts` or `timestamp`; otherwise, the time when the event was received | | `@received_ts` | `DateTime` | The time when the event was received | | `@stream.id` | `String` | The ID of the stream that contains the event. Each project contains at least two streams: the internal Honeybadger stream used for notices, etc., and the stream used for storing events that you send to our API. | | `@stream.name` | `String` | The name of the stream | | `@query.start_at` | `DateTime` | The timestamp of start of the range queried. E.g., when searching back 3 hours (the default), this will be three hours ago | | `@query.end_at` | `DateTime` | The timestamp of end of the range queried. E.g., for the default query, this would be the time when the query was executed, since the default query searches for data up to the time the query was sent. | | `@size` | `Integer` | The size in bytes of the event | | `@fill` | `Boolean` | Whether the result has filled-in values | | `@preview` | `JSON Object` | A preview of the data stored for the event | ### Filter [Section titled “Filter”](#filter) Filter expects a body that results in a boolean expression, and it will exclude events where the expression returns false.
```badgerql
filter boolean_expr [and|or ...]*
```
Multiple piped filter functions will act as AND operations.
```badgerql
filter controller_name::str == "StripeController" and duration::float > 2000
| filter action_name::str == "hook"
```
### Limit [Section titled “Limit”](#limit) Limit the number of results returned by the query.
```badgerql
limit integer [by expr[, ...]*]
```
Caution Limiting can adversely affect piped function results. For example, adding a `limit` before a `stats` call will only gather stats on the limited events:
```badgerql
limit 10
| stats count() by controller::str
```
If you want to restrict the number of returned results, make sure `limit` is at the end of your pipeline:
```badgerql
stats count() by controller::str
| limit 10
```
Include a `by` clause to limit the number of results per group.
```badgerql
limit 10 by user_id::int
```
Pipe into `limit` to restrict the final number of results returned by the query.
```badgerql
limit 5 by user_id::int
| limit 100
```
### Only [Section titled “Only”](#only) Use `only` to restrict which fields are rendered in the results and in which order they will appear.
```badgerql
only expr [as alias][, ...]*
```
For example, if you want to filter on a particular field, but you don’t want that field to appear in the results, you can use `only` to select the fields you want to see:
```badgerql
fields a, b, c
| filter c > 2
| only b, a
```
### Parse [Section titled “Parse”](#parse) Extract fields using regular expressions
```badgerql
parse expr /regex/
```
If your events have data that can be extracted using regular expressions, you can create fields from that data. The following example will extract “redis” from an event that has a field named “addon” that contains the value “redis-fitted-71581” and place it in a new field called “service”. Both the “addon” and “service” fields will appear in the results.
```badgerql
fields addon::str
| parse addon /(?[[:alpha:]]+)/
```
### Sort [Section titled “Sort”](#sort) Order events based on fields.
```badgerql
sort expr [desc|asc][, ...]*
```
Queries without an explicit sort are unordered and non-deterministic. Sort direction can be either `desc` (descending) or `asc` (ascending). By default, fields are sorted in descending order if not specified.
```badgerql
sort day desc, duration asc
```
Sort is useful to order results by time, or when calculating stats:
```badgerql
fields email
| filter action::str == "Logged in"
| stats count() as count by email
| sort count
```
It can make sense to call `sort` multiple times, as sorting after rewriting functions might be necessary. ### Stats [Section titled “Stats”](#stats) Aggregate event fields
```badgerql
stats agg_expr[, ...]* by [expr][, ...]*
```
The workhorse of Insights, `stats` allows you to perform calculations on your data. You can count events, calculate averages, and more.
```badgerql
stats avg(response_time::float)
```
#### Aggregation [Section titled “Aggregation”](#aggregation) Available aggregate functions: | Function | Description | | ------------------------------- | ---------------------------------------------------------------------------------------- | | `count()` | Returns the total count of all results. Can contain an expression that filters the count | | `avg(field)` | Calculates the average (mean) value for a numeric field | | `min(field)`, `max(field)` | Returns the minimum/maximum value for the given field | | `sum(field)` | Calculates the sum of values for a numeric field | | `percentile(percentage, field)` | Returns the value at the specified percentile for the given numeric field | | `unique(field)` | Returns the number of unique values for the specified field | | `first(field)`, `last(field)` | Returns the first/last value of the specified field for the whole aggregate | | `apdex(field, threshold)` | Calculates an Apdex (Application Performance Index) score between 0 and 1 | Find the number of 500 errors over a time period:
```badgerql
filter status_code::int == 500
| stats count()
```
Find the average response time for a specific endpoint:
```badgerql
filter endpoint::str == "/api/v1/orders"
| stats avg(duration::float)
```
Combine multiple aggregate functions in a single query:
```badgerql
filter environment::str in ["production", "staging"]
| stats count(), percentile(95, duration::float)
```
#### Grouping [Section titled “Grouping”](#grouping) The `by` clause allows you to group the results by one or more fields.
```badgerql
stats avg(response_time::float) by location::str
```
One of the most common use cases for grouping is to create a time series by grouping with `bin()`. #### The `bin()` function [Section titled “The bin() function”](#the-bin-function) `bin()` rounds a datetime down to the nearest interval boundary, which lets you group events into time buckets (e.g., “all events in this 1-hour window”).
```plaintext
bin([interval[, datetime]])
```
Both arguments are optional: * **`interval`** — the bucket size, written using interval syntax (e.g. `1h`, `30m`, `2d`). If omitted, `bin()` automatically picks a reasonable size based on your selected time range. * **`datetime`** — the field to bin. Defaults to `@ts`. Use this when you want to bin on a field other than the event timestamp.
```badgerql
stats count() by bin(1h) as time
```
```badgerql
stats count() by bin(1h, toDateTime(user.created_at::str)) as time
```
When no alias is given, the result column is named after the call itself (e.g. `bin(1h)`). Always alias `bin()` when you need to reference it in a later function like `sort` or `fill`. **Interval syntax** — an integer followed by a unit abbreviation: | Unit | Abbreviation | Example | | ------- | ------------ | ------- | | Seconds | `s` | `30s` | | Minutes | `m` | `15m` | | Hours | `h` | `1h` | | Days | `d` | `7d` | | Weeks | `w` | `1w` | | Months | `mon` | `1mon` | **Auto-sizing** — when `bin()` is called with no interval argument, the bin size is automatically chosen to produce a reasonable number of buckets for your selected time range.
```badgerql
stats count() by bin() as time, status_code::int
```
You can use any field or expression in the `by` clause:
```badgerql
stats avg(duration::float), max(duration::float)
by bin() as time, concat(controller::str, "#", action::str) as controllerAction
```
### Unique [Section titled “Unique”](#unique) The `unique` function filters out duplicate events based on the field(s) you specify.
```badgerql
unique field[, ...]
```
### Toggling functions [Section titled “Toggling functions”](#toggling-functions) **Hotkey: `CTRL + /`** When exploring data in BadgerQL, you might find it useful to temporarily ignore certain functions while keeping them in the query. To do this, add a bang (`!`) at the beginning of the BadgerQL function. This comments out the function, effectively ignoring it without removing it from the query. This is particularly useful for toggling conditions in statistical analyses. For example, you might want to alternate between including and excluding certain filters:
```badgerql
fields event_type::str, duration::int
| filter event_type == "page_view"
| !filter duration > 100
| stats count() by bin(1d)
```
Note that if a function spans multiple lines, placing a bang (`!`) at the beginning will toggle the entire function, not just the first line:
```badgerql
fields event_type::str, duration::int
| filter event_type == "page_view"
| !filter
duration > 100 and
duration < 200
| stats count() by bin(1d)
```
## Types [Section titled “Types”](#types) In Insights, data is stored and accessed in its typed format. BadgerQL is a strongly typed language, which means it is particular about type consistency. We currently support storing data with these types: | Short | Long | | ------- | ------- | | `str` | String | | `bool` | Boolean | | `float` | Float | | `int` | Integer | ### Type hinting [Section titled “Type hinting”](#type-hinting) Type hinting is key in BadgerQL. You indicate the expected field type using `::` and the short type name. For example, if you know you are sending status codes as integers, you must augment your query to point to the field like:
```badgerql
fields status_code::int
```
This only gives the system a hint for where to look for the event field. It does not coerce the value into another type. If you want to convert types, use one of the [conversion expression functions](#conversion). It’s not required to repeat type hints. If you use a field with a type hint earlier, it carries over:
```badgerql
fields status_code::int
| stats count() by status_code
```
Conflicting type hints or inaccurate hints can result in null values or errors. We also support using these types (either through conversion or as a function result) in queries: | Short | Long | | ------------ | ----------------------------------- | | `datetime` | Datetime | | `date` | Date | | `tzdatetime` | Datetime with timezone | | `interval` | Relative time intervals (e.g. `1h`) | **Note:** you can’t hint these types, as we don’t store data in these formats. ### Union types [Section titled “Union types”](#union-types) You may see `number` and `temporal` appear in function signatures throughout the docs. These are not types you can use directly in queries; they are shorthand for describing which concrete types a function accepts. `number` means the function works with either `int` or `float`, and `temporal` means it works with either `date` or `datetime`. ### Literal values [Section titled “Literal values”](#literal-values) Some function arguments don’t accept field references, only literals (e.g., `1.5`, `"hi"`). This is denoted in the type signature. For instance, `round(duration::float, 0)` is valid with the second argument as a literal integer. `round(duration::float, precision::int)` would produce an error. ## Dates [Section titled “Dates”](#dates) ### Creating dates [Section titled “Creating dates”](#creating-dates) We provide a shorthand for creating datetime literal values by wrapping the date in curly brackets `{}`:
```badgerql
fields {2023-01-01} as baseDate
```
### Casting dates [Section titled “Casting dates”](#casting-dates) There is no way to store native dates in Insights, so if you want to interact with a native `date` or `datetime`, you will need to cast a string column to one of the temporal types:
```badgerql
fields toDateTime(created_at::str) as created_at
| filter created_at > {2023-04-08 12:00:00}
```
### Timezones [Section titled “Timezones”](#timezones) All datetimes are returned in your selected timezone by default. This means that if you input a datetime, it will be automatically converted to match your preferred timezone setting. To adjust datetimes to a specific timezone for a query, use the `toTimezone` function:
```badgerql
fields toTimezone(@ts, "America/Los_Angeles")
```
This will show the timestamp in PST, which will be denoted in the timezone information contained within the field type (`tzdatetime.PST` for this example). ## Arrays [Section titled “Arrays”](#arrays) Insights is primarily designed to work with simple key/value data mappings, however, it does support ingesting and querying array data in your events. To access fields within an array, use bracket notation to specify an index. For example, `user.scopes[0].name::str` is a valid path into your event data. ### Expand function [Section titled “Expand function”](#expand-function) The most flexible tool for working with arrays is the `expand` BadgerQL function. `expand` unwraps array data into individual events, which you can then pipe into any other function. For example, given events containing this data:
```json
{"id": 1, "charges": [700, 430, 200]}
{"id": 2, "charges": [100]}
```
You can expand the charges field using wildcard notation:
```badgerql
expand charges[*]::int as charge
```
This will expand each result to: | id | charge | | -- | ------ | | 1 | 700 | | 1 | 430 | | 1 | 200 | | 2 | 100 | **Note:** Just like looking up a field, the path must reference a set of values. You can’t expand into an object or another array. You can then use `stats` to group events back together after processing:
```badgerql
expand charges[*]::int as charge
| filter charge > 200
| stats sum(charge) as total_cost by id
```
Which will combine the filtered events back with summed charges: | id | total\_cost | | -- | ----------- | | 1 | 1130 | ### Conditional array matching [Section titled “Conditional array matching”](#conditional-array-matching) Sometimes you want to know if a value within an array passes some condition. We have [special expression functions](#arrays) just for this case. For example, to find events with a specific tag:
```badgerql
filter any(tags[*]::str == "funky")
```
The `any` function also works with nested object data within an array:
```badgerql
filter any(events[*].user.email::str like "kwebster%")
```
### Performance implications [Section titled “Performance implications”](#performance-implications) Array support is limited in terms of performance optimizations. Where possible, consider flattening array data into separate events before sending them to Honeybadger. ## Expression functions [Section titled “Expression functions”](#expression-functions) Expression functions can be used in a variety of places, such as filtering data, creating fields, calculating aggregates, etc. They are used to compare fields, perform arithmetic, reformat data, and more. ### Comparison [Section titled “Comparison”](#comparison) The comparison operators work across `number`, `string`, `boolean`, and `datetime` types. `!=` and `<>` are equivalent operators. `between` and `not between` are inclusive on both ends:
```badgerql
filter status_code::int between 200 and 299
```
`either` returns the first non-null value from its arguments — useful as a fallback when a field may be stored under different names:
```badgerql
fields either(name::str, full_name::str, username::str) as name
```
* `!=` Inequality comparison. Also written `<>`. Signature`t = number | string | boolean | datetime``t != t -> boolean` Example
```sql
fields status_code::int != 200
```
* `<` Signature`t = number | string | boolean | datetime``t < t -> boolean` Example
```sql
fields status_code::int < 500
```
* `<=` Signature`t = number | string | boolean | datetime``t <= t -> boolean` Example
```sql
fields status_code::int <= 200
```
* `<>` Inequality comparison. Also written `!=`. Signature`t = number | string | boolean | datetime``t <> t -> boolean` Example
```sql
fields status_code::int <> 200
```
* `==` Signature`t = number | number[] | string | string[] | boolean | boolean[] | datetime | datetime[]``t == t -> boolean` Example
```sql
fields status_code::int == 200
```
* `>` Signature`t = number | string | boolean | datetime``t > t -> boolean` Example
```sql
fields status_code::int > 500
```
* `>=` Signature`t = number | string | boolean | datetime``t >= t -> boolean` Example
```sql
fields status_code::int >= 200
```
* `between` Signature`t = number | string | datetime``t between t and t -> boolean` Example
```sql
filter status_code::int between 200 and 300
```
* `coalesce` Returns the first non-null value. Synonym of `either`. Signature`t = integer | float | string | boolean | datetime``coalesce(t, ...t) -> t` Example
```sql
fields coalesce(name::str, full_name::str, username::str) as name
```
* `either` Returns the first non-null value. Also accepts `coalesce`. Signature`t = integer | float | string | boolean | datetime``either(t, ...t) -> t` Example
```sql
fields either(name::str, full_name::str, username::str) as name
```
* `ilike` Returns true when the search string matches Can use these metacharacters: `%` - Matches an arbitrary amount of characters `_` - Matches single arbitrary character The matcher is case insensitive Signature`string ilike string -> boolean` Example
```sql
filter email::str ilike "%compuserve%"
```
* `in` Return true if field value is contained within the array of literal values. The field type must match value type in the array. Signature`t = number | string | datetime``t in t[] -> boolean` Example
```sql
filter status_code::int in [300, 301, 404]
```
* `isNotNull` Signature`t = number | string | boolean | datetime``isNotNull(t) -> boolean` Example
```sql
filter isNotNull(status_code::int)
```
* `isNull` Signature`t = number | string | boolean | datetime``isNull(t) -> boolean` * `like` Returns true when the search string matches Can use these metacharacters: `%` - Matches an arbitrary amount of characters `_` - Matches single arbitrary character The string matcher is case sensitive Signature`string like string -> boolean` Example
```sql
filter email::str like "%compuserve%"
```
* `match` Returns true when the regex matches The regex uses [re2 regex syntax](https://github.com/google/re2/wiki/Syntax) Signature`string match regex -> boolean` Example
```sql
filter email::str match /.*compuserve.*/
```
* `not between` Signature`t = number | string | datetime``t not between t and t -> boolean` Example
```sql
filter status_code::int not between 300 and 400
```
* `not ilike` Returns true when the search string does not match Can use these metacharacters: `%` - Matches an arbitrary amount of characters `_` - Matches single arbitrary character The matcher is case insensitive Signature`string not ilike string -> boolean` Example
```sql
filter email::str not ilike "%compuserve%"
```
* `not in` Return true if field value is not contained within the array of literal values. The field type must match value type in the array. Signature`t = number | string | datetime``t not in t[] -> boolean` Example
```sql
filter status_code::int not in [300, 301, 404]
```
* `not like` Returns true when the search string does not match Can use these metacharacters: `%` - Matches an arbitrary amount of characters `_` - Matches single arbitrary character The string matcher is case sensitive Signature`string not like string -> boolean` Example
```sql
filter email::str not like "%compuserve%"
```
* `not match` Returns true when the regex does not match The regex uses [re2 regex syntax](https://github.com/google/re2/wiki/Syntax) Signature`string not match regex -> boolean` Example
```sql
filter email::str not match /.*compuserve.*/
```
### Arrays [Section titled “Arrays”](#arrays-1) * `all` Return true if the predicate is true for every element of an expanded array. Returns true on empty arrays (vacuous truth). Signature`all(boolean) -> boolean` Example
```sql
filter all(tags[*]::str != "severe")
```
```sql
filter all(coupon_ids[*]::int not in [123, 456])
```
The predicate must reference at least one expanded array (a field with `[*]`). That tells `all()` which array to iterate over.
```sql
filter all(tags[*]::str != "severe")
```
### Empty arrays `all()` returns `true` on an empty array — there are no elements to violate the predicate. This is mathematically consistent (vacuous truth) but bites people who expect "all" to imply "at least one." If you need both "non-empty" and "all match," combine `all()` with a separate `any()` check. ### Nested object data `[*]` works inside object paths, so you can require a property on every element of an array of objects:
```sql
filter all(events[*].status::str == "ok")
```
### Performance Array operations don't benefit from the same indexing that scalar fields do. If you find yourself querying array data heavily, consider sending the events with the array already unrolled. * `any` Return true if the predicate is true for at least one element of an expanded array. Returns false on empty arrays. Signature`any(boolean) -> boolean` Example
```sql
filter any(tags[*]::str == "severe")
```
```sql
filter any(coupon_ids[*]::int in [123, 456])
```
The predicate must reference at least one expanded array (a field with `[*]`). That tells `any()` which array to iterate over.
```sql
filter any(tags[*]::str == "severe")
```
### Nested object data `[*]` works inside object paths, so you can check fields on each element of an array of objects:
```sql
filter any(events[*].user.email::str like "kwebster%")
```
### Empty arrays `any()` returns `false` on an empty array — there's nothing to match. ### Comparison vs membership predicates The predicate inside `any()` can be anything that returns a boolean — equality, `in`/`not in`, `like`, range checks, or expressions on nested fields:
```sql
filter any(coupon_ids[*]::int in [123, 456])
filter any(prices[*]::float > 100.0)
```
You can't drop the `any()` and write `tags[*]::str in ["severe"]` directly — `in` needs a scalar on its left, and `tags[*]::str` is an array. `any()` is what unrolls the array and feeds each element into the predicate one at a time. ### Performance Array operations don't benefit from the same indexing that scalar fields do. If you find yourself querying array data heavily, consider sending the events with the array already unrolled. ### Array [Section titled “Array”](#array) * `contains` Returns true when the array contains the value. Use for simple array membership without writing `any(arr[*] == value)`. Signature`contains(string[], string) -> boolean``contains(number[], number) -> boolean` Example
```sql
filter contains(tags[*]::str, "severe")
```
* `dedupe` Removes duplicate elements from an array, keeping one copy of each value. Compose with `collect` to gather distinct values per group. Signature`t = string[] | number[] | boolean[] | datetime[]``dedupe(t) -> t` Example
```sql
fields dedupe(tags[*]::str) as tags
```
```sql
stats dedupe(collect(user_id::str)) as users by error_class::str
```
* `reverse` Returns the array with its element order reversed. Signature`t = string[] | number[] | boolean[] | datetime[]``reverse(t) -> t` Example
```sql
fields reverse(sort(scores[*]::int)) as descending_scores
```
* `sort` Returns the array sorted ascending. This is the array function `sort(...)`, not the pipeline stage `| sort ...`; compose with `reverse` for descending order. Signature`t = string[] | number[] | boolean[] | datetime[]``sort(t) -> t` Example
```sql
fields sort(scores[*]::int) as sorted_scores
```
* `subarray` Returns `length` elements of the array starting at `start`; array positions are 1-based, so `1` is the first element. Signature`t = string[] | number[] | boolean[] | datetime[]``subarray(t, integer, integer) -> t` Example
```sql
fields subarray(tags[*]::str, 1, 3) as first_three
```
### Logic [Section titled “Logic”](#logic) `if` is single-branch conditional: if the condition is true it returns the `then` value, otherwise it returns the `else` value. The `else` arm also fires when the condition evaluates to `null`.
```badgerql
fields if(status_code::int >= 500, "error", "ok") as result
```
`cond` is multi-branch: condition/value pairs are evaluated in order and the value from the first matching pair is returned. A final bare value (no preceding condition) acts as the fallback:
```badgerql
fields cond(
status_code::int >= 500, "red",
status_code::int >= 300, "yellow",
"green"
) as severity
```
* `and` Signature`boolean and boolean -> boolean` * `cond` Multiple path conditional branching The `cond()` function allows for evaluating branches (ala. `if` and `else if`) through positional arguments. Each successive pair of arguments acts as an else if, with the first true boolean passing it's result as a return." Signature`t = string | boolean | number | datetime | date``cond(boolean, t, boolean, t, ..., t) -> t` Example
```sql
fields cond(
status_code >= 300, "yellow",
status_code >= 500, "red",
"green"
) as status_code_color
```
* `if` Single path conditional branching Signature`t = string | number | boolean | temporal | interval``if(boolean, t, t) -> t` Example
```sql
fields if(toDayOfWeek(ts) == 2, "taco", "slop") as food_day
```
* `not` Signature`not(boolean) -> boolean` * `or` Signature`boolean or boolean -> boolean` ### Arithmetic [Section titled “Arithmetic”](#arithmetic) The standard operators (`+`, `-`, `*`, `/`, `%`) work on numbers. A few noteworthy behaviors: * Subtracting two `datetime` values returns the difference in **seconds** as an integer: `end_ts::datetime - start_ts::datetime` * Adding an interval to a datetime shifts it forward: `@ts + 1h` * The second argument to `round`, `floor`, and `ceil` is the number of decimal places and must be a **literal integer** — you cannot pass a field reference. `round(duration::float, 2)` is valid; `round(duration::float, precision::int)` is not. - `-` Signature`number - number -> number``datetime - number -> datetime``datetime - interval -> datetime``datetime - datetime -> integer` - `*` Signature`number * number -> number` - `/` Division. Dividing by an interval converts a number of seconds — such as a datetime difference — into that unit: `(finished - started) / 1h` is hours. Signature`t = number | interval``number / t -> float` Example
```sql
fields (toDateTime(finished_at::str) - toDateTime(started_at::str)) / 1h as hours
```
- `%` Signature`number % number -> number` - `+` Signature`number + number -> number``datetime + number -> datetime``datetime + interval -> datetime` - `abs` Signature`abs(number) -> number` - `bucket` Assign a numeric value to a bucket and return that bucket's start value. `bucket(value, width)` uses `width`-sized steps anchored at zero. `bucket(value, min, max, n)` divides `[min, max]` into `n` equal bucket slots; values outside that range return null. Signature`bucket(number, literal number) -> number``bucket(number, literal number, literal number, literal integer) -> number` Example
```sql
stats count() as ct by bucket(duration::int, 250) as ms
```
```sql
stats count() as ct by bucket(duration::int, 0, 5000, 16) as ms
```
The width form is the numeric counterpart of `bin()` for time: `bucket(duration::int, 100)` maps `250` to `200`, the start of its 100-wide bucket. Negative values land on the same grid (`-50` maps to `-100`). The bounded form fixes the range and bucket count instead: the width is `(max - min) / n`, so `bucket(duration::int, 0, 1000, 4)` creates starts at `0`, `250`, `500`, and `750`. `100` maps to `0`, `999` maps to `750`, and a value exactly equal to `max` also maps to the last bucket. Anything outside `[min, max]` returns null; filter the range first if you do not want an out-of-range null group. ### Histograms `bucket()` only assigns rows that already exist. Group by the bucket and count, then `fill` to make empty buckets explicit. The fill grid is inferred from the bucket — its width becomes the step, and the bounded form's min/max become from/to:
```sql
stats count() as ct by bucket(duration::int, 0, 2000, 20) as ms
| fill ms
| sort ms asc
```
### Why explicit parameters The width (or bounds and count) are part of the query, so the bucket grid is stable — the same query yesterday and today produces comparable buckets, and outliers can't warp the ranges. - `ceil` Signature`ceil(number, literal integer) -> float` - `exp` Signature`exp(number) -> float` - `floor` Signature`floor(number, literal integer) -> float` - `intDiv` Divide two numbers and return the integer quotient. Use `/` when you want a floating-point result. Signature`intDiv(number, number) -> integer` - `log` Signature`log(number) -> float` - `log10` Signature`log10(number) -> float` - `log2` Signature`log2(number) -> float` - `pow` Signature`pow(number, number) -> float` - `round` Signature`round(number, literal integer) -> float` - `sign` Returns -1 for negative numbers, 0 for zero, and 1 for positive numbers. Signature`sign(number) -> integer` - `sqrt` Signature`sqrt(number) -> float` - `truncate` Drop digits past the given number of decimal places without rounding. This is different from `floor`, which always rounds down. Signature`truncate(number, literal integer) -> float` ### Conversion [Section titled “Conversion”](#conversion) A few things worth knowing: * `toDateTime` from a string uses best-effort parsing, so it handles a wide variety of date formats (ISO 8601, RFC 2822, etc.) without needing an exact format string. * `toUnix` returns **milliseconds** since the Unix epoch, not seconds. * `toDate` strips the time component from a datetime and returns a date-only value. - `toDate` Signature`t = string | datetime``toDate(t) -> date` - `toDateTime` Signature`t = number | date | string | temporal``toDateTime(t) -> datetime` - `toFloat` Signature`toFloat(any) -> float` - `toInt` Signature`toInt(any) -> integer` - `toString` Signature`toString(any) -> string` - `toUnix` Signature`toUnix(datetime) -> integer` ### Dates [Section titled “Dates”](#dates-1) `now()` returns the current datetime in the query’s configured timezone. `toStartOf` and `toEndOf` are lower-level alternatives to `bin()` when you need the start or end of an interval boundary rather than grouping:
```badgerql
fields toStartOf(1w) as week_start
```
```badgerql
fields toEndOf(1d) as end_of_day
```
`toDayOfWeek` returns 1–7 where 1 = Monday and 7 = Sunday. See also the [Dates](#dates) section above for creating and casting date literals. * `bin` Round a datetime down to the nearest interval boundary. Most often used in `stats ... by bin(...)` to bucket events into a time series. Signature``bin(datetime = `@ts`) -> datetime````bin(interval, datetime = `@ts`) -> datetime`` Example
```sql
fields bin(1w) as beginning_of_week
```
```sql
stats count() by bin(1h, toDateTime(user.created_at::str))
```
### Choosing the interval If you pass an interval, that's the bin size:
```sql
stats count() by bin(1h)
```
If you omit the interval, `bin()` picks a size based on the query's time range — small bins for short ranges, larger bins for longer ones. The exact thresholds aren't fixed, so pass an explicit interval if you need a specific size. ### Choosing the field By default `bin()` operates on the event timestamp (`@ts`). Pass a datetime field as the second argument to bin against something else:
```sql
stats count() by bin(1d, toDateTime(user.created_at::str))
```
### Filling gaps Bins with no matching events don't appear in the result. To produce a continuous series, pipe through `fill` — the step is inferred from the bin:
```sql
stats count() by bin(1h) as t
| fill t
```
* `formatDate` Render a datetime as a string using a format pattern. Defaults to the event timestamp (`@ts`) if no datetime is given. Signature``formatDate(literal string, datetime = `@ts`) -> string`` Example
```sql
fields formatDate("%Y-%m-%d") as day
```
```sql
stats count() by formatDate("%a", @ts) as weekday
```
### Date tokens | | | | | ---- | ---------------------------------------------------------------------------------------------------------------------------------------------- | ---------- | | `%j` | day of the year (001-366) | 002 | | `%d` | day of the month, zero-padded (01-31) | 02 | | `%e` | day of the month, space-padded (1-31) | 2 | | | | | | `%V` | ISO 8601 week number (01-53) | 01 | | `%w` | weekday as a integer number with Sunday as 0 (0-6) | 2 | | `%u` | ISO 8601 weekday as number with Monday as 1 (1-7) | 2 | | `%a` | abbreviated weekday name (Mon-Sun) | Mon | | `%W` | full weekday name (Monday-Sunday) | Monday | | | | | | `%m` | month as an integer number (01-12) | 01 | | `%M` | full month name (January-December) | January | | `%b` | abbreviated month name (Jan-Dec) | Jan | | `%Q` | Quarter (1-4) | 1 | | | | | | `%y` | Year, last two digits (00-99) | 18 | | `%Y` | Year | 2018 | | `%C` | year divided by 100 and truncated to integer (00-99) | 20 | | `%g` | two-digit year format, aligned to ISO 8601, abbreviated from four-digit notation | 18 | | `%G` | four-digit year format for ISO week number, calculated from the week-based year defined by the ISO 8601 standard, normally useful only with %V | 2018 | | | | | | `%D` | Short MM/DD/YY date, equivalent to %m/%d/%y | 01/02/18 | | `%F` | short YYYY-MM-DD date, equivalent to %Y-%m-%d | 2018-01-02 | ### Time tokens | | | | | ---- | ------------------------------------------------------- | -------- | | `%s` | second (00-59) | 44 | | `%S` | second (00-59) | 44 | | `%f` | fractional second | 1234560 | | | | | | `%i` | minute (00-59) | 33 | | | | | | `%h` | hour in 12h format (01-12) | 09 | | `%I` | hour in 12h format (01-12) | 10 | | `%H` | hour in 24h format (00-23) | 22 | | `%l` | hour in 12h format (01-12) | 09 | | `%k` | hour in 24h format (00-23) | 22 | | `%r` | 12-hour HH:MM AM/PM time, equivalent to %H:%i %p | 10:30 PM | | `%R` | 24-hour HH:MM time, equivalent to %H:%i | 22:33 | | | | | | `%p` | AM or PM designation | PM | | `%T` | ISO 8601 time format (HH:MM:SS), equivalent to %H:%i:%S | 22:33:44 | | `%z` | Time offset from UTC as +HHMM or -HHMM | -0500 | ### Other tokens | | | | | ---- | ------------------------ | - | | `%n` | new-line character | | | `%t` | horizontal-tab character | | | `%%` | a % sign | % | * `now` Signature`now() -> datetime` * `toDay` Returns the day of month (1-31) for the supplied datetime. Signature`toDay(datetime) -> integer` * `toDayOfWeek` Returns the number of the day in a week (1-7, 1 = monday) for the supplied datetime. Signature`toDayOfWeek(datetime) -> integer` * `toDayOfYear` Returns the day of the year (1-366) from a datetime. Signature`toDayOfYear(datetime) -> integer` * `toEndOf` Signature``toEndOf(interval, datetime = `@ts`) -> datetime`` * `toHour` Returns the 24-hour number (0-23) for the supplied datetime. Signature`toHour(datetime) -> integer` * `toMinute` Returns the minute of the hour (0-59) from a datetime. Signature`toMinute(datetime) -> integer` * `toMonth` Returns the month number (1-12) from a datetime. Signature`toMonth(datetime) -> integer` * `toSecond` Returns the second of the minute (0-59) from a datetime. Signature`toSecond(datetime) -> integer` * `toStartOf` Signature``toStartOf(interval, datetime = `@ts`) -> datetime`` * `toTimezone` Convert datetimes to a specific timezone. **Note:** This does not explicitly embed the timezone into the datetime, but updates the type to reflect the selected timezone (tzdatetime). Signature`toTimezone(datetime, literal string) -> datetime` * `toYear` Signature`toYear(datetime) -> integer` ### URL [Section titled “URL”](#url) * `urlBaseDomain` Extracts the registrable/base domain from a URL's hostname, so subdomains can be grouped together. Signature`urlBaseDomain(string) -> string` * `urlDomain` Extracts the hostname from a URL. Signature`urlDomain(string) -> string` * `urlParameter` Parse out value from valid URL query string Signature`urlParameter(string, literal string) -> string` Example
```sql
fields urlParameter(url::str, "user_id") as user_id_param
```
* `urlPath` Extracts the path from a URL. Example: `/hot/goss.html` The path does not include the query string. Signature`urlPath(string) -> string` * `urlPort` Extracts the explicit port from a URL, or returns 0 when the URL does not include one. Signature`urlPort(string) -> integer` * `urlProtocol` Extracts the URL protocol without `://`, for example `https`. Signature`urlProtocol(string) -> string` * `urlQueryString` Extracts the query string from a URL without the leading `?`, for example `page=2&sort=desc`. Signature`urlQueryString(string) -> string` ### Network [Section titled “Network”](#network) * `inCIDR` Returns true when the IP address falls within the CIDR range. Works for IPv4 and IPv6. The address must be a valid IP string. Malformed strings cause a query error. Signature`inCIDR(string, literal string) -> boolean` Example
```sql
filter inCIDR(client_ip::str, "10.0.0.0/8")
```
### Hashing [Section titled “Hashing”](#hashing) `cityHash64` and `xxHash64` are fast, non-cryptographic hashes for bucketing, sampling, or stable grouping. `MD5` and `SHA256` return hex strings for comparing against pre-hashed identifiers. * `cityHash64` Returns a fast, deterministic 64-bit hash of the value. Not cryptographic; use for bucketing, sampling, or stable grouping. Signature`cityHash64(any) -> integer` * `MD5` Returns the MD5 hash of a string as lowercase hexadecimal text. Useful for comparing against pre-hashed identifiers. Signature`MD5(string) -> string` * `SHA256` Returns the SHA-256 hash of a string as lowercase hexadecimal text. Useful for comparing against pre-hashed identifiers. Signature`SHA256(string) -> string` * `xxHash64` Returns a fast, deterministic 64-bit hash of the value. Not cryptographic; use for bucketing, sampling, or stable grouping. Signature`xxHash64(any) -> integer` ### JSON [Section titled “JSON”](#json) * `isValidJSON` Returns true when the string parses as JSON. Signature`isValidJSON(string) -> boolean` Example
```sql
filter isValidJSON(payload::str)
```
* `json` Extract a scalar value from a JSON string using a JSONPath expression. Returns null if the path doesn't resolve to a scalar — arrays and objects are not valid targets. Signature`json(string, literal string) -> string` Example
```sql
fields json(user_config::str, "$.login_info.last_login") as last_logged_in
```
### Path syntax Paths follow [JSONPath](https://www.ietf.org/archive/id/draft-goessner-dispatch-jsonpath-00.html). Common patterns: | Path | Selects | | ---------------------- | ------------------------------------ | | `$.foo` | the value at key `foo` | | `$.foo.bar` | nested key `bar` under `foo` | | `$.items[0]` | the first element of an array | | `$.items[-1]` | the last element of an array | | `$['key with spaces']` | a key with non-identifier characters | ### Type handling `json()` returns the value as a string. To use it as a number or datetime, cast it with the appropriate conversion function:
```sql
fields toInt(json(payload::str, "$.user.id")) as user_id
```
### When it returns null * The path doesn't resolve (key missing, index out of range) * The path resolves to an object or array — only scalar values come back * The input isn't valid JSON ### Recommendation We support `json()` for ad-hoc digging into payloads, but querying it at scale is slower than querying real fields. If you find yourself reaching for it often on the same paths, send those values as top-level event fields instead. ### String [Section titled “String”](#string) `toHumanString` supports five format types: `"number"` (default), `"bytes"`, `"short"`, `"milliseconds"`, and `"microseconds"` for microsecond-precision duration fields. `startsWith` is a convenience wrapper around `like` — it is case-sensitive and does not accept wildcards in the match string. * `concat` Signature`concat(string, string...) -> string` * `editDistance` Returns the number of single-character edits (insertions, deletions, substitutions) needed to transform one string into the other. Lower values are more similar. Signature`editDistance(string, string) -> integer` Example
```sql
filter editDistance(error_message::str, "connection timed out") < 5
```
* `endsWith` Returns true when the first string ends with the second string. Signature`endsWith(string, string) -> boolean` Example
```sql
filter endsWith(file::str, ".rb")
```
* `length` Returns the number of characters in a string, or the number of elements in an array. Signature`t = string | string[] | number[] | boolean[] | datetime[]``length(t) -> integer` * `lowercase` Signature`lowercase(string) -> string` * `position` Returns the 1-based position of the first occurrence of the search string, or 0 when it is not found. Signature`position(string, string) -> integer` Example
```sql
fields position(message::str, "timeout") as timeout_at
```
* `replace` Replace all matches of a substring or regex pattern with another string. Signature`t = string | regex``replace(string, t, string) -> string` Example
```sql
fields replace(controller::str, /Controller/, "") as controller
```
* `replaceFirst` Replace the first match of a substring or regex pattern with another string. Signature`t = string | regex``replaceFirst(string, t, string) -> string` Example
```sql
fields replaceFirst(controller::str, /Controller/, "") as controller
```
* `similarity` Returns a 0-1 similarity score for two strings: 1 means identical, 0 means no similarity. Easier to threshold than `editDistance` when string lengths vary. Signature`similarity(string, string) -> float` Example
```sql
filter similarity(error_message::str, "connection timed out") > 0.9
```
* `split` Splits a string into an array of substrings around a literal separator. Null input returns an empty array. Signature`split(string, literal string) -> string[]` Example
```sql
fields split(tags::str, ",") as tag_list
```
* `startsWith` Signature`startsWith(string, string) -> boolean` * `substring` Signature`substring(string, integer, integer) -> string` Example
```sql
fields substring(token::str, 1, 3) as token_type
```
* `toHumanString` Transform a number into a human-readable string. Picks units, separators, and rounding based on the format type. Defaults to `"number"` (comma-separated) if no type is given. Signature`toHumanString(number, string = "number") -> string` Example
```sql
fields toHumanString(duration::int, "milliseconds")
```
```sql
fields toHumanString(@size, "bytes")
```
### Format types | Type | Output | Example input → output | | ---------------- | ------------------------- | ---------------------------- | | `"number"` | comma-separated digits | `1234567` → `"1,234,567"` | | `"short"` | rounded shorthand | `1234567` → `"1.23 million"` | | `"bytes"` | rounded binary size | `105906176` → `"101.0 MiB"` | | `"milliseconds"` | duration starting from ms | `1500` → `"1.5s"` | | `"microseconds"` | duration starting from µs | `1500` → `"1.5ms"` | ### Common usage
```sql
stats avg(duration::int) as avg_ms
| fields toHumanString(avg_ms, "milliseconds") as avg
```
```sql
stats sum(@size) as total
| fields toHumanString(total, "bytes") as total_size
```
Mostly useful for charting and table output. For computation, keep the raw number and only format at the end. * `trim` Signature`trim(string) -> string` * `uppercase` Signature`uppercase(string) -> string` ### Aggregate [Section titled “Aggregate”](#aggregate) Aggregate functions are only valid inside a `stats` call. `count()` with no argument counts all events. Passing a boolean expression counts only events where the expression is true. Passing a field name counts only non-null occurrences of that field:
```badgerql
stats count() -- all events
stats count(status_code::int >= 500) -- events with 5xx status
stats count(user_id::str) -- events where user_id is not null
```
`first` and `last` return the first or last value seen within the group. If the data is not sorted before `stats`, the result is non-deterministic. Pipe through `sort` first if order matters. `percentile` is an approximated result. * `apdex` Returns the Application Performance Index (Apdex) score, which measures user satisfaction with response time. Signature`apdex(number, number) -> float` Example
```sql
stats apdex(duration::int, 500) as apdex_score
```
Apdex scores a sample of response times against a target threshold `T`. Each request counts as: * **Satisfied** (1.0) if it completed in `T` or less * **Tolerating** (0.5) if it completed between `T` and `4T` * **Frustrated** (0) if it took longer than `4T` The score is the average — so 1.0 means every request was satisfied, 0 means every request was frustrated.
```sql
stats apdex(duration::int, 500) as score
```
### Picking a threshold `T` should be the response time at which a typical user starts to notice latency. Common starting points: * User-facing web requests: 200–500ms * API endpoints: 100–300ms * Background jobs: depends on the job — pick something tied to user expectations ### Reading the score Rough rule of thumb: | Score | Reading | | ----------- | ------------ | | ≥ 0.94 | Excellent | | 0.85 – 0.94 | Good | | 0.70 – 0.85 | Fair | | 0.50 – 0.70 | Poor | | < 0.50 | Unacceptable | These bands aren't a Honeybadger-specific standard — they come from the Apdex specification. * `apdexIf` Returns the Apdex score computed only over events where the predicate is true. The predicate restricts the whole calculation — satisfied and tolerating counts as well as the total — so the score reads as "the apdex of this slice of events." See `apdex` for how the score itself works. Signature`apdexIf(number, number, boolean) -> float` Example
```sql
stats apdexIf(duration::int, 500, route::str == "/checkout") as checkout_apdex
```
* `avg` Signature`avg(number) -> number` * `avgIf` Average a numeric value across events where the predicate is true. Signature`avgIf(number, boolean) -> number` Example
```sql
stats avgIf(duration::int, route::str == "/checkout") as checkout_avg
```
* `avgWeighted` Returns a weighted average. Values with larger weights count more, which is useful when averaging pre-aggregated rows such as per-route latency weighted by request count. Signature`avgWeighted(number, number) -> float` Example
```sql
stats avgWeighted(avg_latency::float, request_count::int) as typical_latency
```
* `collect` Collects the values from each group into an array. Compose with `dedupe` when you want distinct values. Signature`t = string | integer | float | boolean | datetime``collect(t) -> t[]` Example
```sql
stats dedupe(collect(user_id::str)) as users by error_class::str
```
* `corr` Returns the correlation coefficient between two numeric expressions: -1 is inverse correlation, 0 is no linear correlation, and 1 is direct correlation. Signature`corr(number, number) -> float` Example
```sql
stats corr(memory::float, response_time::float) as memory_vs_latency
```
* `count` Return the total counts of all results. The count can be affected by supplying a boolean expression argument. If given a field, it will implicitly count non-null occurrences. Signature`count() -> integer``count(boolean) -> integer``count(number) -> integer``count(string) -> integer` Example
```sql
stats count()
```
```sql
stats count(status_code::int < 500)
```
* `countIf` Count events where the predicate is true. Signature`countIf(boolean) -> integer` Example
```sql
stats countIf(status_code::int >= 500) as errors
```
* `first` Returns the first encountered value. Results could be random if the source is not sorted. Signature`t = string | number | boolean | datetime``first(t) -> t` Example
```sql
stats first(user_name::str) by error_class::str
```
* `firstIf` Returns the first encountered value among events where the predicate is true. Use `pickMin(value, @ts)` when you need deterministic earliest-by-time semantics. Signature`t = string | number | boolean | datetime``firstIf(t, boolean) -> t` Example
```sql
sort @ts asc | stats firstIf(message::str, level::str == "error") as first_error by host::str
```
* `last` Returns the last encountered value. Results could be random if the source is not sorted. Signature`t = string | number | boolean | datetime``last(t) -> t` Example
```sql
stats last(severity::str) by error_class::str
```
* `lastIf` Returns the last encountered value among events where the predicate is true. Use `pickMax(value, @ts)` when you need deterministic latest-by-time semantics. Signature`t = string | number | boolean | datetime``lastIf(t, boolean) -> t` Example
```sql
sort @ts asc | stats lastIf(message::str, level::str == "error") as last_error by host::str
```
* `max` Signature`t = string | number | datetime``max(t) -> t` * `maxIf` Return the maximum value across events where the predicate is true. Signature`t = string | number | datetime``maxIf(t, boolean) -> t` Example
```sql
stats maxIf(duration::int, status_code::int >= 500) as slowest_error
```
* `median` Returns the median value. Equivalent to `percentile(50, value)` and approximated the same way. Signature`median(number) -> number` * `min` Signature`t = string | number | datetime``min(t) -> t` * `minIf` Return the minimum value across events where the predicate is true. Signature`t = string | number | datetime``minIf(t, boolean) -> t` Example
```sql
stats minIf(duration::int, status_code::int >= 500) as fastest_error
```
* `percentile` Calculate the percentile. This is an approximated result. Signature`percentile(literal number, number) -> number` Example
```sql
stats percentile(90, duration::int)
```
* `percentileIf` Calculate a percentile across events where the predicate is true. This is an approximated result. Signature`percentileIf(literal number, number, boolean) -> number` Example
```sql
stats percentileIf(95, duration::int, status_code::int < 500) as p95_ok
```
* `pickMax` Returns the first argument from the row where the second argument is largest. `pickMax(error_message::str, @ts)` returns the most recent error message in each group. Signature`t = string | integer | float | boolean | datetime``pickMax(t, any) -> t` Example
```sql
stats pickMax(error_message::str, @ts) as latest_error by error_class::str
```
* `pickMin` Returns the first argument from the row where the second argument is smallest. `pickMin(user_id::str, duration::int)` returns the user from the fastest request in each group. Signature`t = string | integer | float | boolean | datetime``pickMin(t, any) -> t` Example
```sql
stats pickMin(user_id::str, duration::int) as fastest_user by controller::str
```
* `rate` Convert an aggregate into a rate by dividing it by the width of the query's `bin()` group. Defaults to a per-second rate; pass an interval to get a rate per minute, per hour, etc. Signature`rate(number) -> float``rate(number, interval) -> float` Example
```sql
stats rate(count()) as rps by bin(1m) as t
```
```sql
stats rate(sum(bytes::int)) as bps by bin() as t
```
```sql
stats rate(count(), 1m) as rpm by bin(1h) as t
```
### Following the bin The divisor is the width of the query's `bin()`. That includes auto-sized `bin()` — when the bin width changes with the query window, the divisor changes with it, and the result keeps the same unit:
```sql
stats rate(count()) as rps by bin() as t
```
### Choosing the interval The default is per second — the universal observability idiom (RPS, BPS, errors/sec). Pass an interval as the second argument for other units; the bin size doesn't have to match:
```sql
stats rate(count(), 1m) as rpm by bin(1h) as t
```
### Composing Rates are plain numbers, so they compose with arithmetic — two rates over the same bin make a unitless ratio:
```sql
stats (rate(countIf(status::int >= 500)) / rate(count())) as error_rate by bin(1m) as t
```
### Restrictions * Requires exactly one `bin()` group in the same stats stage (directly or via a renamed field). * The argument must be an aggregate. Rates are most natural over `count`/`sum`-style aggregates; `rate(min(x))` is computable but rarely what you want. * Month and year bins or intervals are rejected — they have no fixed second count, so use a fixed-period interval like `30d`. * `stddev` Returns the sample standard deviation of the numeric values. Pair with `avg` to see how spread out a metric is. Signature`stddev(number) -> float` * `sum` Signature`sum(number) -> number` * `sumIf` Sum a numeric value across events where the predicate is true. Signature`sumIf(number, boolean) -> number` Example
```sql
stats sumIf(amount::float, status::str == "paid") as paid_total
```
* `unique` Count all unique values Signature`t = string | number | datetime``unique(t) -> integer` Example
```sql
stats unique(concat(controller::str, action::str))
```
* `uniqueIf` Count distinct values among events where the predicate is true. Signature`t = string | number | datetime``uniqueIf(t, boolean) -> integer` Example
```sql
stats uniqueIf(user_id::str, event_type::str == "purchase") as purchasers
```
* `variance` Returns the sample variance of the numeric values. Variance is the square of standard deviation. Signature`variance(number) -> float` ### Grouping [Section titled “Grouping”](#grouping-1) * `top` Select the top N values of a field. By default, values are ranked by frequency. An optional third argument ranks values by an aggregate instead, such as `max`, `sum`, or `avg`. `top()` is context-aware: it caps groups, filters by membership, or returns an array depending on where it appears. Useful for high-cardinality fields like controllers, endpoints, queues, or workers. Signature`t = string | number``top(literal integer, t, any = null) -> t[] | t` Example
```sql
stats count() by top(10, controller::str)
```
```sql
filter controller::str in top(5, controller::str)
```
```sql
stats top(10, controller::str) by env::str
```
### In a stats group Caps the group to the top N values, dropping the rest. By default, "top" means most frequent. The default ranking is approximate.
```sql
stats count() by top(10, controller::str)
```
Pass an `order_by` aggregate as the third argument to rank by something other than frequency. This switches to an exact ranking — slower than the default, but deterministic.
```sql
stats count() by top(10, controller::str, max(duration::float))
```
Combine with `bin()` to chart the top N series over time:
```sql
stats avg(duration::float) by top(10, controller::str), bin()
```
Group-position `top()` may be wrapped in another expression (e.g. `lower(top(5, controller::str))`). The ranking matches the wrapped value so the result lines up with the group key. ### In a filter Tests membership against the top N values. Use `in` to keep matching events or `not in` to exclude them.
```sql
filter controller::str in top(5, controller::str)
```
The check runs against raw events when used in a pre-stats filter, and against grouped results when used in a post-stats filter. In practice, `filter controller::str in top(5, controller::str) | stats count() by bin()` selects the top 5 controllers from the source events first, then charts only those events over time. ### As a stats aggregate Returns the top N values as an array.
```sql
stats top(10, controller::str) by env::str
```
Aggregate-position `top()` does not accept an `order_by` argument. Given an expanded array field, it ranks the array's elements and still returns a flat array. This counts every element across all events, so it does not multiply rows the way `expand` does.
```sql
stats top(3, tags[*]::str) as top_tags by fault_id::int
```
### Restrictions * `n` must be a positive integer literal — not a field reference. * `top()` is not allowed inside an `or` condition. * In a filter, `top()` must be the right-hand side of `in` or `not in`. Other filter shapes (e.g. equality) are rejected.
# Ship your CloudWatch Logs to Honeybadger Insights
> Here's how to ship your logs from CloudWatch Logs to Honeybadger Insights.
Ingesting logs from CloudWatch Logs requires setting up a [Data Firehose](https://aws.amazon.com/firehose/) stream with a [HTTP Endpoint destination](https://docs.aws.amazon.com/firehose/latest/dev/create-destination.html#create-destination-http) that sends events to our API. Once you create [subscription filters](https://docs.aws.amazon.com/AmazonCloudWatch/latest/logs/SubscriptionFilters.html#FirehoseExample) for the desired log groups, log data from those groups will start flowing into Insights. The easiest way to set this up is to use our [CloudFormation template](https://honeybadger-docs-assets.s3.amazonaws.com/insights-cloudformation-stack.yml) to create a CloudFormation stack in your AWS account. It will prompt you to enter your Honeybadger API key and the name of a log group that you want to connect to Data Firehose. You can quickly [launch this template in your AWS account](https://console.aws.amazon.com/cloudformation/home#/stacks/new?stackName=honeybadger-insights\&templateURL=https://honeybadger-docs-assets.s3.amazonaws.com/insights-cloudformation-stack.yml) and then create additional log group subscriptions for other log groups you wish to monitor. If you set up the Data Firehose stream manually, choose HTTP Endpoint as the destination and use the following URL as the HTTP Endpoint URL in the destination settings:
```plaintext
https://api.honeybadger.io/v1/data-firehose-events?api_key=PROJECT_API_KEY
```
## Setting default fields with a query parameter [Section titled “Setting default fields with a query parameter”](#setting-default-fields-with-a-query-parameter) Events from this endpoint are built from the CloudWatch Logs record, so they always have the same shape: a `ts`, a `message`, and the `logGroup` and `logStream` the record came from. If you want more than that — the environment, the region, the name of the app — you can add a `defaults` query parameter to the HTTP Endpoint URL containing a URL-encoded JSON object, and its fields will be merged into every event the stream delivers:
```plaintext
https://api.honeybadger.io/v1/data-firehose-events?api_key=PROJECT_API_KEY&defaults={"environment":"production","region":"us-east-1"}
```
With that URL, an event that would otherwise be stored as:
```json
{"ts": "2023-08-31T09:19:30.000Z", "logGroup": "/aws/lambda/checkout", "logStream": "2023/08/31/[$LATEST]abc123", "message": "This is a log line"}
```
…is stored as:
```json
{"ts": "2023-08-31T09:19:30.000Z", "logGroup": "/aws/lambda/checkout", "logStream": "2023/08/31/[$LATEST]abc123", "message": "This is a log line", "environment": "production", "region": "us-east-1"}
```
Because the parameter lives on the destination URL, each Data Firehose stream can carry its own metadata — a useful way to tag events by environment or account when you’re shipping logs from more than one place, without running a transformation Lambda to rewrite the payloads. The `defaults` parameter has a few restrictions: * It must be a flat JSON object; values must be strings, numbers, or booleans. * The keys `event_type` and `ts` are reserved and will be ignored. * It’s limited to 16 keys and 2kB (URL-decoded). * Fields we build from the log record always win — a default named `message` or `logGroup` won’t overwrite the real one. An invalid `defaults` parameter never causes the delivery to fail: entries that break the rules above are dropped (an unparseable or oversized parameter is ignored entirely), and the events are ingested without them. Likewise, if merging the defaults would push an event past the 100kB per-event size limit, we drop the defaults for that event rather than the event itself.
# Ship your Crunchy Bridge logs to Honeybadger Insights
> Ship Postgres logs from Crunchy Bridge to Honeybadger Insights.
You can have Crunchy Bridge ship the logs from your Postgres clusters by following their [setup instructions](https://docs.crunchybridge.com/how-to/logging). Use the following values for the logging destination: | Field | Value | | -------- | --------------------------------------------------------------------------------------------------------- | | Host | in.honeybadger.io | | Port | 6514 | | Template | `<$PRI>1 $ISODATE $HOST $PROGRAM $PID ${MSGID:--} [honeybadger@61642 api_key=\"PROJECT_API_KEY\"] $MSG\n` | You can choose to add additional key/value data to the structured data section of the template. E.g., if you want to add an environment field to the payload, you can specify it after the API key in the template:
```plaintext
<$PRI>1 $ISODATE $HOST $PROGRAM $PID ${MSGID:--} [honeybadger@61642 api_key=\"PROJECT_API_KEY\" environment=\"production\"] $MSG\n
```
# Ship your Docker container logs to Honeybadger Insights
> Here's how to use Vector to collect Docker container logs and send them to Honeybadger Insights.
You can use [Vector](https://vector.dev) with its `docker_logs` source to collect logs from your Docker containers and send them to Honeybadger Insights. This example collects logs from all running containers:
```yaml
# Put this in vector.yaml
sources:
docker:
type: "docker_logs"
transforms:
enrich_docker:
type: "remap"
inputs: ["docker"]
source: |
# Try to parse JSON log messages
payload, err = parse_json(string!(.message))
if err == null {
.payload = payload
del(.message)
}
sinks:
honeybadger_events:
type: "http"
inputs: ["enrich_docker"]
uri: "https://api.honeybadger.io/v1/events"
request:
headers:
X-API-Key: "PROJECT_API_KEY"
encoding:
codec: "json"
framing:
method: "newline_delimited"
```
To run Vector with Docker and collect logs from other containers, you need to mount the Docker socket. Here’s a Docker Compose configuration:
```yaml
services:
vector:
image: timberio/vector:latest-alpine
volumes:
- "./vector.yaml:/etc/vector/vector.yaml:ro"
- "/var/run/docker.sock:/var/run/docker.sock:ro"
# Example app container whose logs will be collected
app:
image: your-app:latest
labels:
vector.enable: "true"
```
You can filter which containers Vector collects logs from using labels. Update the source configuration to only collect logs from containers with a specific label:
```yaml
sources:
docker:
type: "docker_logs"
include_labels:
- "vector.enable=true"
```
# Send logs and events from Elixir apps to Honeybadger Insights
> Here's how to integrate your Elixir apps with Honeybadger Insights.
When enabled, Honeybadger [automatically instruments your Elixir/Phoenix application](/lib/elixir/insights/automatic-instrumentation/) to send application events to Honeybadger Insights. This is the easiest way to get started with Insights and logging. To get started, enable Insights in your app configuration:
```elixir
config :honeybadger,
insights_enabled: true
```
See our [automatic instrumentation](/lib/elixir/insights/automatic-instrumentation/) guide to learn more. You can also [add extra context data](/lib/elixir/insights/event-context/) to events, [filter events](/lib/elixir/insights/filtering-events/) to remove PII, and [sample events](/lib/elixir/insights/sampling-events/) to reduce the amount of data sent to Honeybadger. ## Sending custom events [Section titled “Sending custom events”](#sending-custom-events) You can send custom events to Honeybadger Insights with the `Honeybadger.event/1` and `Honeybadger.event/2` functions. For example:
```elixir
Honeybadger.event(%{
event_type: "user_created",
user: user.id
})
Honeybadger.event("project_deleted", %{
project: project.name
})
```
## Sending logs from your infrastructure [Section titled “Sending logs from your infrastructure”](#sending-logs-from-your-infrastructure) Honeybadger isn’t just for errors and application data! You can use our [syslog](/guides/insights/integrations/systemd/), [Vector](/guides/insights/integrations/log-files/), or [PaaS integrations](/guides/insights/#adding-data-from-other-sources) to send additional data from your infrastructure to [Honeybadger Insights](/guides/insights/), where you can query, visualize, and analyze all of your production data in one place.
# Ship your Fly.io logs to Honeybadger Insights
> Here's how to ship your logs from Fly.io to Honeybadger Insights.
Use [Fly.io’s log shipper app](https://github.com/superfly/fly-log-shipper) to ship logs from your apps hosted by Fly.io. First, create a new app config:
```shell
# Make a directory for your log shipper app
mkdir logshipper
cd logshipper
# Create the app but don't deploy just yet
fly launch --no-deploy --image ghcr.io/superfly/fly-log-shipper:latest
# Set some secrets. Setting HONEYBADGER_API_KEY enables the shipping of logs to your Honeybadger project.
fly secrets set ORG=personal # The org you chose when running "fly launch"
fly secrets set ACCESS_TOKEN=$(fly auth token)
fly secrets set HONEYBADGER_API_KEY=PROJECT_API_KEY
```
Edit the generated `fly.toml` file, replacing the `[http_service]` section with this:
```toml
[[services]]
http_checks = []
internal_port = 8686
```
Then deploy the app:
```shell
fly deploy
```
Once that’s done, you should see logs from your apps flowing into Insights. See the [Fly.io docs](https://fly.io/docs/going-to-production/monitoring/exporting-logs/) for more information about using the log shipper app.
# Ship your Heroku logs to Honeybadger Insights
> Here's how to ship your logs from Heroku to Honeybadger Insights.
To get your Heroku logs into Insights, create a new log drain for your Heroku app using an API key displayed on the API keys tab of the project settings page:
```bash
heroku drains:add "https://logplex.honeybadger.io/v1/events?api_key=PROJECT_API_KEY"
```
You can optionally add the `env` parameter to the log drain endpoint. If you do so, each payload recorded from Logplex will have a field named `environment` added to it. You can then add a filter for the desired environment to your queries, like `filter environment::str == 'production'`.
```bash
heroku drains:add https://logplex.honeybadger.io/v1/events?api_key=PROJECT_API_KEY&env=production
```
# Host metrics
> Monitor CPU, memory, and disk usage on your servers with Honeybadger Insights.
Track your infrastructure’s health by sending host metrics to [Honeybadger Insights](/guides/insights/). Monitor CPU usage, memory consumption, and disk space alongside your application errors and logs. ## Using the Honeybadger CLI [Section titled “Using the Honeybadger CLI”](#using-the-honeybadger-cli) The easiest way to collect host metrics is with the [Honeybadger CLI](/resources/cli/). Download a prebuilt binary from the [GitHub releases page](https://github.com/honeybadger-io/cli/releases), or install with Go:
```shell
go install github.com/honeybadger-io/cli@latest
```
See the [CLI installation guide](/resources/cli/#installation) for other options, including Homebrew. Start the metrics agent with your project API key:
```shell
hb agent --api-key PROJECT_API_KEY
```
The agent collects CPU, memory, and disk metrics every 60 seconds and sends them to Insights. You can customize the interval with the `-i, --interval` flag (see the [CLI reference](/resources/cli/#agent) for details). ### Tagging metrics [Section titled “Tagging metrics”](#tagging-metrics) If you’re running the agent on multiple hosts, add tags to identify and group them:
```shell
hb agent --api-key PROJECT_API_KEY \
--tag environment=production \
--tag role=web-1
```
Tags appear as top-level fields on every metric event. You can also override the default hostname with `--tag host=custom-name`, which is useful when hostnames are auto-generated (e.g. IP-based names from cloud providers). Tags can also be set in the configuration file (`~/.honeybadger-cli.yaml`):
```yaml
api_key: PROJECT_API_KEY
agent:
tags:
environment: production
role: web-1
```
CLI flags take precedence over configuration file tags. See the [CLI reference](/resources/cli/#agent) for details and examples of reserved field names that cannot be used as tag keys. Once tagged, you can filter and group metrics in Insights:
```badgerql
fields @ts, host::str, used_percent::float
| filter event_type::str == "report.system.cpu"
| filter environment::str == "production"
| filter role::str == "web-1"
```
## Querying agent metrics in Insights [Section titled “Querying agent metrics in Insights”](#querying-agent-metrics-in-insights) Once metrics are flowing, you can query them in Insights. Each metric type sends a separate event:
```json
{"@id": "ca4dee56-bede-453d-a41e-a6fd93d30eaf", "@stream.id": "3XepYQVyo5to", "@ts": "2026-01-12 22:22:11.000", "total_bytes": 994662584320, "used_bytes": 544694333440, "free_bytes": 449968250880, "used_percent": 54.76, "device": "/dev/disk3s1s1", "event_type": "report.system.disk", "host": "vonnegut.lan", "mountpoint": "/", "fstype": "apfs"}
{"@id": "d76ca037-3bab-4c1c-beb1-a18b9e6ff765", "@stream.id": "3XepYQVyo5to", "@ts": "2026-01-12 22:22:11.000", "total_bytes": 51539607552, "used_bytes": 38632865792, "free_bytes": 164954112, "available_bytes": 12906741760, "used_percent": 74.96, "event_type": "report.system.memory", "host": "vonnegut.lan"}
{"@id": "5b7c4060-1ff3-4d52-90d8-a9d3af17174a", "@stream.id": "3XepYQVyo5to", "@ts": "2026-01-12 22:22:11.000", "num_cpus": 14, "used_percent": 32.85, "load_avg_1": 3.35009765625, "load_avg_5": 3.73046875, "load_avg_15": 3.86083984375, "event_type": "report.system.cpu", "host": "vonnegut.lan"}
```
Here’s an example [BadgerQL](/guides/insights/badgerql/) query to get a snapshot of disk usage:
```badgerql
fields @ts, mountpoint::str, used_percent::float
| filter event_type::str == "report.system.disk"
| sort used_percent desc
| limit 1 by mountpoint::str
```
| @ts `TIME EDT` | mountpoint `STR` | used\_percent `FLOAT` | | ----------------------- | ---------------- | --------------------- | | 2026-01-12 16:15:06.000 | / | 55.01 | | 2026-01-12 16:14:21.000 | /data | 11.91 | ## Using Vector [Section titled “Using Vector”](#using-vector) If you need more flexibility or are already using [Vector](https://vector.dev) in your infrastructure, you can use it to send host metrics to Insights instead. Here’s a sample configuration:
```yaml
# Put this in /etc/vector/vector.yaml
sources:
host:
type: "host_metrics"
sinks:
honeybadger_events:
type: "http"
inputs: ["host"]
uri: "https://api.honeybadger.io/v1/events"
request:
headers:
X-API-Key: "PROJECT_API_KEY"
encoding:
codec: "json"
framing:
method: "newline_delimited"
```
The easiest way to run Vector is via Docker. Here’s a sample [Docker Compose](https://docs.docker.com/compose/) configuration, assuming your Vector configuration is in a file named `vector.yaml`:
```yaml
version: "3.2"
services:
vector:
image: timberio/vector:latest-alpine
volumes:
- "vector.yaml:/etc/vector/vector.yaml:ro"
```
See the [Vector documentation](https://vector.dev/docs/reference/configuration/sources/host_metrics/) for more configuration options. ## Querying Vector’s metrics [Section titled “Querying Vector’s metrics”](#querying-vectors-metrics) Vector’s [metrics](https://vector.dev/docs/reference/configuration/sources/host_metrics/#output-metrics) are structured like this:
```json
{
"@id": "01922983-149f-7a69-b5e1-ddca928d815e",
"@stream.id": "cEhUcrZrnny0",
"@ts": "2025-09-25 14:08:26.048",
"gauge": {
"value": 1.25
},
"tags": {
"collector": "load",
"host": "api-10-0-11-252"
},
"kind": "absolute",
"name": "load15",
"namespace": "host"
}
```
Here’s an example [BadgerQL](/guides/insights/badgerql/) query to get a snapshot of disk usage:
```badgerql
fields @ts, tags.mountpoint::str, round(gauge.value::float * 100, 2) as used_percentage
| filter namespace::str == "host"
| filter name::str == "filesystem_used_ratio"
| filter gauge.value::float > 0.0
| filter tags.filesystem::str not in ["tmpfs", "devtmpfs", "squashfs"]
| sort @ts
| limit 1 by tags.mountpoint
```
| @ts `TIME EDT` | tags.mountpoint `STR` | used\_percentage `FLOAT` | | ----------------------- | --------------------- | ------------------------ | | 2025-09-25 10:45:11.047 | / | 29.77 | | 2025-09-25 10:45:11.047 | /efs | 0 |
# Send logs and events from JavaScript apps to Honeybadger Insights
> Here's how to integrate your JavaScript apps with Honeybadger Insights.
#### Automatic instrumentation [Section titled “Automatic instrumentation”](#automatic-instrumentation) Capture inbound HTTP requests from Express, Fastify, AWS Lambda, and Next.js as `request.handled` events. See [Automatic instrumentation](/lib/javascript/insights/automatic-instrumentation/) for configuration and framework setup. #### Logs [Section titled “Logs”](#logs) Instrument your JavaScript application, either backend or frontend, to send your logs automatically to Honeybadger Insights. More information can be found [here](/lib/javascript/insights/capturing-logs/). #### Events [Section titled “Events”](#events) If you have custom events you’d like to track, use `Honeybadger.event()` to report them to Insights:
```javascript
Honeybadger.event("button_click", {
action: "buy_now",
user_id: 123,
product_id: 456,
});
```
More information about sending events to Insights from your JavaScript apps can be found [here](/lib/javascript/insights/sending-events-to-insights/).
# Use Vector to ship your log files to Honeybadger Insights
> Here's how to use Vector to watch your log files and send the events they record to Honeybadger.
You can use [Vector](https://vector.dev) to watch your existing log files and send the events they record. Here’s a sample configuration that will encode the log lines into the newline-delimited JSON format that our API expects:
```yaml
# Put this in /etc/vector/vector.yaml
sources:
app:
type: "file"
include: ["/home/app/shared/log/*.log"]
sinks:
honeybadger_events:
type: "http"
inputs: ["app"]
uri: "https://api.honeybadger.io/v1/events"
request:
headers:
X-API-Key: "PROJECT_API_KEY"
encoding:
codec: "json"
framing:
method: "newline_delimited"
```
If you are using something like [Lograge](https://github.com/roidrage/lograge) to emit JSON-formatted logs (and you should — it’s awesome), you can have Vector replace the message field with a JSON payload:
```yaml
# Put this in /etc/vector/vector.yaml
sources:
app:
type: "file"
include: ["/home/app/shared/log/*.log"]
transforms:
parse_logs:
type: "remap"
inputs: ["app"]
source: |
payload, err = parse_json(string!(.message))
if err == null {
.payload = payload
del(.message)
}
sinks:
honeybadger_events:
type: "http"
inputs: ["parse_logs"]
uri: "https://api.honeybadger.io/v1/events"
request:
headers:
X-API-Key: "PROJECT_API_KEY"
encoding:
codec: "json"
framing:
method: "newline_delimited"
```
Or if you are using logfmt-style logs, like “controller=pages action=index”, then you can add a transform that parses that into JSON:
```yaml
---
transforms:
parse_logs:
type: "remap"
inputs: ["app"]
source: |
payload, err = parse_key_value(string!(.message))
if err == null {
.payload = payload
del(.message)
}
```
Again, we **highly** recommend structured logging. 😉 By the way, Vector supports a variety of [input sources](https://vector.dev/docs/reference/configuration/sources/), such as Docker logs, Redis metrics, etc., in addition to log files. You can define whatever `sources` and `transforms` make sense for what you want to capture, then use the `sinks` section provided in the examples above to send everything to Insights. The easiest way to run Vector is via Docker. Here’s a sample [Docker Compose](https://docs.docker.com/compose/) configuration you can use, assuming your Vector configuration is in a file named `vector.yaml`:
```yaml
version: "3.2"
services:
vector:
image: timberio/vector:latest-alpine
volumes:
- "vector.yaml:/etc/vector/vector.yaml:ro"
```
## Additional Vector configuration examples [Section titled “Additional Vector configuration examples”](#additional-vector-configuration-examples) ### Nginx logs [Section titled “Nginx logs”](#nginx-logs) You can use regular expressions to extract the fields of an Nginx log to create a JSON structure in a transform:
```yaml
sources:
nginx_logs:
type: "file"
ignore_older: 86400
include:
- "/var/log/nginx/access.log"
read_from: "end"
transforms:
parse_nginx:
type: "remap"
inputs:
- "nginx_logs"
source: |
match, err = parse_regex(.message, r'(?P[^ ]*) - (?P[^ ]*) \[(?P[^\]]*)\] "(?P[^ ]*) ?(?P[^ ]*) ?(?P[^"]*)" (?P[^ ]*) (?P[^ ]*) "(?P[^"]*)" "(?P[^"]*)" (?[0-9\.]+)', true)
if err == null {
.remote_addr = match.remote_addr
.user = match.user
.timestamp = parse_timestamp(match.timestamp, "%d/%b/%Y:%H:%M:%S %z") ?? match.timestamp
.request = match.request
.method = match.method
.url = match.url
.protocol = match.protocol
.status, err = to_int(match.status)
.bytes_sent, err = to_int(match.bytes_sent)
.referer = match.referer
.user_agent = match.user_agent
.duration, err = to_float(match.duration)
del(.message)
} else {
log("Failed to parse log line: " + err, level: "error")
}
```
# Ship your Netlify logs to Honeybadger Insights
> Here's how to ship your logs from Netlify to Honeybadger Insights.
You can use Netlify’s [General HTTP endpoint](https://docs.netlify.com/monitor-sites/log-drains/?monitoring-providers=general#general-http-endpoint) to send your Netlify logs to Insights. Choose NDJSON as the Log Drain Format and enter this URL as the Full URL:
```plaintext
https://api.honeybadger.io/v1/events?api_key=PROJECT_API_KEY
```
# OpenTelemetry Protocol (OTLP)
> Send traces, metrics, and logs to Honeybadger Insights using the OpenTelemetry Protocol.
Honeybadger can ingest OpenTelemetry traces, metrics, and logs directly via the [OpenTelemetry Protocol (OTLP)](https://opentelemetry.io/docs/specs/otlp/). If you’re already using OpenTelemetry to instrument your applications, you can send that data to Honeybadger Insights without changing your instrumentation code—just point your OTLP exporter at our endpoint. ## Getting started [Section titled “Getting started”](#getting-started) The quickest way to send OpenTelemetry data to Honeybadger is by pointing your OTLP exporter at our endpoint:
```bash
export OTEL_EXPORTER_OTLP_ENDPOINT=https://api.honeybadger.io
export OTEL_EXPORTER_OTLP_HEADERS=X-API-Key=PROJECT_API_KEY
```
We accept the `http/protobuf` protocol, which is the default for most SDKs. See [Authentication](#authentication) below for other ways to pass your API key. ## Authentication [Section titled “Authentication”](#authentication) Honeybadger accepts your project API key via either the `X-API-Key` header or a standard `Authorization: Bearer` header. Use whichever fits your exporter or collector configuration:
```bash
export OTEL_EXPORTER_OTLP_HEADERS=X-API-Key=PROJECT_API_KEY
```
```bash
export OTEL_EXPORTER_OTLP_HEADERS=Authorization=Bearer%20PROJECT_API_KEY
```
Note that `OTEL_EXPORTER_OTLP_HEADERS` requires the space between `Bearer` and your key to be URL-encoded as `%20`. Your API key is available on the API keys tab of your project settings page. ## Using the OpenTelemetry Collector [Section titled “Using the OpenTelemetry Collector”](#using-the-opentelemetry-collector) If you’re using the [OpenTelemetry Collector](https://opentelemetry.io/docs/collector/), add an `otlphttp` exporter to your configuration:
```yaml
exporters:
otlphttp/honeybadger:
endpoint: https://api.honeybadger.io
headers:
X-API-Key: PROJECT_API_KEY
```
You can also authenticate using a bearer token:
```yaml
exporters:
otlphttp/honeybadger:
endpoint: https://api.honeybadger.io
headers:
Authorization: Bearer PROJECT_API_KEY
```
Then add `otlphttp/honeybadger` to your pipeline exporters. ## Supported signals [Section titled “Supported signals”](#supported-signals) We accept traces, metrics, and logs at the following endpoints: | Signal | Endpoint | | ------- | --------------------------------------- | | Traces | `https://api.honeybadger.io/v1/traces` | | Metrics | `https://api.honeybadger.io/v1/metrics` | | Logs | `https://api.honeybadger.io/v1/logs` | ## Querying your data [Section titled “Querying your data”](#querying-your-data) Once your data is flowing, you can query it in [Insights](/guides/insights/) using [BadgerQL](/guides/insights/badgerql/). OpenTelemetry data appears as events with these types: * **Traces**: `event_type` = `otel.span` * **Metrics**: `event_type` = `otel.metric` * **Logs**: `event_type` = `otel.log` For example, to view recent spans:
```badgerql
fields @ts, span_name::str, duration::float, status.code::str, resource.service.name::str
| filter event_type::str == "otel.span"
| sort @ts
```
# Send logs and events from PHP apps to Honeybadger Insights
> Here's how to integrate your PHP apps with Honeybadger Insights.
#### Logs [Section titled “Logs”](#logs) Instrument your PHP application, either a Lumen, a Laravel or a plain PHP app, to send your logs automatically to Honeybadger Insights. More information can be found [here](/lib/php/insights/capturing-logs/). #### Events [Section titled “Events”](#events) If you are using Laravel or Lumen, enable the automatic events instrumentation :
```php
'events' => [
'enabled' => true,
'automatic' => HoneybadgerLaravel::DEFAULT_EVENTS,
],
```
If you have custom events you’d like to track, use `Honeybadger.event()` to report them to Insights:
```php
Honeybadger.event('button_click', [
'action' => 'buy_now',
'user_id' => 123,
'product_id' => 456
])
```
More information about sending events to Insights from your PHP apps can be found [here](/lib/php/insights/sending-events-to-insights/).
# Send logs and events from Python apps to Honeybadger Insights
> Here's how to integrate your Python apps with Honeybadger Insights.
When enabled, Honeybadger [automatically instruments your Python application](/lib/python/insights/automatic-instrumentation/) to send application events to Honeybadger Insights. This is the easiest way to get started with Insights. To get started, enable Insights in your app configuration:
```python
from honeybadger import honeybadger
honeybadger.configure(insights_enabled=True)
```
Once integrated with our middleware or extensions, Honeybadger instruments the following libraries: * **Django** requests & database queries * **Flask** requests & database queries * **ASGI** requests (FastAPI, Starlette, etc.) * **Celery** tasks * **Oban** workers & maintenance loops See the [automatic instrumentation guide](/lib/python/insights/automatic-instrumentation/) to learn how to configure each integration, and the [Python event reference](/insights/event-types/python/) for every event the package emits, with field schemas and types. You can also [add extra context data](/lib/python/insights/event-context/) to events, [filter events](/lib/python/insights/filtering-events/) to remove PII, and [sample events](/lib/python/insights/sampling-events/) to reduce the amount of data sent to Honeybadger. ## Querying events with BadgerQL [Section titled “Querying events with BadgerQL”](#querying-events-with-badgerql) Once events are flowing into Insights, you can query them with [BadgerQL](/guides/insights/badgerql/). For example, to find your slowest Django views:
```plaintext
filter event_type::str == "django.request"
| stats avg(duration::float) as avg_duration, count() as requests by view::str
| sort avg_duration desc
```
Or to see Oban background-job throughput and p95 duration by worker:
```plaintext
filter event_type::str == "oban.job_finished"
| stats count() as jobs, percentile(95, duration::float) as p95_ms by worker::str
| sort jobs desc
```
The [Python event reference](/insights/event-types/python/) lists the fields available on each event type. ## Sending custom events [Section titled “Sending custom events”](#sending-custom-events) If you have custom events you’d like to track, use `honeybadger.event` to report them to Insights:
```python
from honeybadger import honeybadger
honeybadger.event("user.signup", {"user_id": user.id, "plan": user.plan})
```
More information about sending events to Insights from your Python apps can be found [here](/lib/python/insights/sending-custom-events/). ## Sending logs from your infrastructure [Section titled “Sending logs from your infrastructure”](#sending-logs-from-your-infrastructure) Honeybadger isn’t just for errors and application data! You can use our [syslog](/guides/insights/integrations/systemd/), [Vector](/guides/insights/integrations/log-files/), or [PaaS integrations](/guides/insights/#adding-data-from-other-sources) to send additional data from your infrastructure to [Honeybadger Insights](/guides/insights/), where you can query, visualize, and analyze all of your production data in one place.
# Ship your rsyslog logs to Honeybadger Insights
> Use rsyslog to forward system and application logs to Honeybadger Insights over syslog-TLS.
[rsyslog](https://www.rsyslog.com/) is the default syslog daemon on most Linux distributions. You can configure it to forward logs to Honeybadger Insights over syslog-TLS (RFC 5425), tagging each message with your project’s API key in the structured-data section of the RFC 5424 payload. ## Requirements [Section titled “Requirements”](#requirements) Install the TLS driver package for rsyslog. On Debian and Ubuntu:
```shell
sudo apt-get install rsyslog-gnutls
```
On RHEL, Fedora, and derivatives:
```shell
sudo dnf install rsyslog-gnutls
```
You’ll also need the CA certificate bundle for your system. On Debian/Ubuntu this is `/etc/ssl/certs/ca-certificates.crt`. On RHEL/Fedora it’s `/etc/pki/tls/certs/ca-bundle.crt`. ## Configuration [Section titled “Configuration”](#configuration) /etc/rsyslog.d/60-honeybadger.conf
```plaintext
# Load the TLS network stream driver. Set the CA file to match your OS:
# Debian/Ubuntu: /etc/ssl/certs/ca-certificates.crt
# RHEL/Fedora: /etc/pki/tls/certs/ca-bundle.crt
global(DefaultNetstreamDriver="gtls"
DefaultNetstreamDriverCAFile="/etc/ssl/certs/ca-certificates.crt")
# RFC 5424 template with Honeybadger structured data
template(name="HoneybadgerFormat" type="string"
string="<%PRI%>1 %TIMESTAMP:::date-rfc3339% %HOSTNAME% %APP-NAME% %PROCID% %MSGID% [honeybadger@61642 api_key=\"PROJECT_API_KEY\" event_type=\"rsyslog\"] %msg%\n")
# Forward all logs to Honeybadger over syslog-TLS (RFC 5425)
action(type="omfwd"
Target="in.honeybadger.io"
Port="6514"
Protocol="tcp"
TCP_Framing="octet-counted"
StreamDriver="gtls"
StreamDriverMode="1"
StreamDriverAuthMode="x509/name"
StreamDriverPermittedPeers="*.honeybadger.io"
template="HoneybadgerFormat")
```
Restart rsyslog to pick up the change:
```shell
sudo systemctl restart rsyslog
```
You can add additional key/value pairs to the structured-data section of the template. For example, to tag every event with an environment, replace the `string=` value inside the `template(name="HoneybadgerFormat" ...)` block above with the following:
```plaintext
string="<%PRI%>1 %TIMESTAMP:::date-rfc3339% %HOSTNAME% %APP-NAME% %PROCID% %MSGID% [honeybadger@61642 api_key=\"PROJECT_API_KEY\" event_type=\"rsyslog\" environment=\"production\"] %msg%\n"
```
## Shipping application log files with imfile [Section titled “Shipping application log files with imfile”](#shipping-application-log-files-with-imfile) rsyslog’s [`imfile`](https://www.rsyslog.com/doc/configuration/modules/imfile.html) module can tail arbitrary log files and feed them through the same pipeline, which is handy if your application writes to its own log file instead of stdout. Add the following to the top of `/etc/rsyslog.d/60-honeybadger.conf` (before the `action(...)` block):
```plaintext
# Load the file input module
module(load="imfile" PollingInterval="10")
# Tail your application's log files
input(type="imfile"
File="/var/log/myapp/*.log"
Tag="myapp"
Severity="info"
Facility="local7")
```
Each line written to a matching file will be forwarded to Honeybadger using the `HoneybadgerFormat` template, with `APP-NAME` set to the `Tag` value (`myapp`). Adjust `File`, `Tag`, `Severity`, and `Facility` to match your application. If you’d rather only forward the events captured by `imfile` (and not every other message rsyslog processes), wrap the action in a conditional:
```plaintext
if ($programname == "myapp") then {
action(type="omfwd"
Target="in.honeybadger.io"
Port="6514"
Protocol="tcp"
TCP_Framing="octet-counted"
StreamDriver="gtls"
StreamDriverMode="1"
StreamDriverAuthMode="x509/name"
StreamDriverPermittedPeers="*.honeybadger.io"
template="HoneybadgerFormat")
}
```
## Querying your data [Section titled “Querying your data”](#querying-your-data) Once your data is flowing, you can query it in [Insights](/guides/insights/) using [BadgerQL](/guides/insights/badgerql/). The following query will return events sent via rsyslog:
```badgerql
fields @ts, hostname::str, appname::str, severity::str, message::str
| filter event_type::str == "rsyslog"
| sort @ts
```
## Troubleshooting [Section titled “Troubleshooting”](#troubleshooting) If events aren’t showing up in Insights, check rsyslog’s own log for TLS or forwarding errors:
```shell
sudo journalctl -u rsyslog -f
```
A missing or incorrect CA file is the most common cause of connection failures — double-check the `DefaultNetstreamDriverCAFile` path against what’s installed on your system.
# Send metrics and events from Ruby and Rails apps to Honeybadger Insights
> Here's how to integrate your Ruby/Ruby on Rails apps with Honeybadger Insights.
#### Logs [Section titled “Logs”](#logs) Sending your logs to Insights is a quick way to get some visibility into your app. There are two good options: ##### Semantic Logger [Section titled “Semantic Logger”](#semantic-logger) Use the [rails\_semantic\_logger gem](https://github.com/reidmorrison/rails_semantic_logger) and enable the `HoneybadgerInsights` appender by adding `config.semantic_logger.add_appender(appender: :honeybadger_insights)` to `config/application.rb`. Outside of Rails, you can use the same appender with the [semantic\_logger gem](https://github.com/reidmorrison/semantic_logger). Please note that if you are using SolidQueue, you will need to add the following snippet to `config/initializers/solid_queue.rb` to work around a [known issue with Semantic Logger](https://github.com/reidmorrison/rails_semantic_logger/issues/237) that causes SolidQueue/ActiveJob logging to not be sent to Insights:
```yaml
# Re-open appenders after forking the worker, dispatcher, and scheduler processes
SolidQueue.on_worker_start { SemanticLogger.reopen }
SolidQueue.on_dispatcher_start { SemanticLogger.reopen }
SolidQueue.on_scheduler_start { SemanticLogger.reopen }
```
##### Lograge [Section titled “Lograge”](#lograge) Use [Lograge](https://github.com/roidrage/lograge) to emit JSON-formatted output to your log files and Vector to [forward them to Insights](/guides/insights/integrations/log-files/). If you go this route, be sure to disable the log tagging in your Rails environment config (`config/environments/production.rb`) by commenting out the `config.log_tags` line, as that will mess with the JSON output. #### Metrics [Section titled “Metrics”](#metrics) You can get more details about what’s happening in your application by enabling our gem’s automatic instrumentation, which will report information about every SQL query, HTTP request, etc. to Insights. This will consume more Insights quota than the logging approach, but you will get much more data to use for analyzing your app’s performance, and this will populate our ready-made Rails dashboard, which includes charts for request duration, SQL query counts, and more. More information can be found [here](/lib/ruby/insights/collecting-and-reporting-metrics). Alternatively, you can use [Yabeda](https://github.com/yabeda-rb/yabeda) and [our Yabeda integration](https://github.com/honeybadger-io/yabeda-honeybadger_insights) to collect and report metrics in your Ruby and Rails apps. Several default metrics, such as request counts, request duration, etc., will be reported automatically once you’ve added and configured the gems. Alternatively, you can use [Yabeda](https://github.com/yabeda-rb/yabeda) and [our Yabeda integration](https://github.com/honeybadger-io/yabeda-honeybadger_insights) to collect and report metrics in your Ruby and Rails apps. Several default metrics, such as request counts, request duration, etc., will be reported automatically once you’ve added and configured the gems. #### Events [Section titled “Events”](#events) If you have custom events you’d like to track, use `Honeybadger#event` to report those events to Insights: app/controllers/accounts\_controller.rb
```ruby
class AccountsController < ApplicationController
def create
# Account.create(...)
Honeybadger.event("Created account", account_id: account.id, account_name: account.name, plan: account.subscription.name)
end
end
```
More information about sending events to Insights from your Ruby and Rails apps can be found [here](/lib/ruby/insights/sending-events-to-insights).
# Send CI/CD telemetry from RWX to Honeybadger Insights
> Here's how to send CI/CD telemetry from RWX (Mint) to Honeybadger Insights using OpenTelemetry.
[RWX](https://www.rwx.com/) can send CI/CD pipeline telemetry to Honeybadger Insights using [OpenTelemetry](/guides/insights/integrations/opentelemetry/), giving you visibility into pipeline runs, task durations, and failures. ## Configuration [Section titled “Configuration”](#configuration) 1. Go to your [RWX organization observability settings](https://cloud.rwx.com/org/deep_link/manage/mint/observability). 2. Select **Honeybadger** as the OpenTelemetry provider. 3. The endpoint will default to `https://api.honeybadger.io/v1/traces`. 4. Enter your Honeybadger API key, which is available on the API keys tab of your [project settings](/guides/projects/). ## Querying your data [Section titled “Querying your data”](#querying-your-data) Once you’re receiving telemetry, you can query your CI/CD data in [Insights](/guides/insights/) using [BadgerQL](/guides/insights/badgerql/). RWX sends OpenTelemetry spans with [CI/CD semantic convention](https://opentelemetry.io/docs/specs/semconv/cicd/cicd-metrics/) fields. View recent pipeline tasks:
```badgerql
fields @ts, span_name::str, cicd.pipeline.task.run.result::str, duration::int
| filter event_type::str == "otel.span"
| filter resource.service.name::str == "rwx"
| sort @ts desc
```
Find failed tasks:
```badgerql
fields @ts, span_name::str, cicd.pipeline.run.git.repository::str, cicd.pipeline.run.git.branch::str
| filter event_type::str == "otel.span"
| filter resource.service.name::str == "rwx"
| filter cicd.pipeline.task.run.result::str == "failure"
| sort @ts desc
```
Analyze task durations:
```badgerql
fields cicd.pipeline.task.name::str, cicd.pipeline.task.run.timing.runtime.ms::int
| filter event_type::str == "otel.span"
| filter resource.service.name::str == "rwx"
| filter cicd.pipeline.task.name::str != "$run"
| stats avg(cicd.pipeline.task.run.timing.runtime.ms::int), max(cicd.pipeline.task.run.timing.runtime.ms::int) by cicd.pipeline.task.name::str
```
## Learn more [Section titled “Learn more”](#learn-more) * [RWX Honeybadger integration docs](https://www.rwx.com/docs/observability/honeybadger) * [OpenTelemetry CI/CD semantic conventions](https://opentelemetry.io/docs/specs/semconv/cicd/cicd-metrics/) * [Honeybadger OpenTelemetry integration](/guides/insights/integrations/opentelemetry/)
# Use Vector to ship your systemd logs to Honeybadger Insights
> Here's how to use Vector to watch journald and send events to Honeybadger.
[Journald](https://www.freedesktop.org/software/systemd/man/latest/systemd-journald.service.html) is the logging system used by [systemd](https://systemd.io), the init system used on most modern Linux distributions. It’s a replacement for syslog and rsyslog, and it captures the logs for just about everything running on a Linux server, including services like web and database servers that are managed by systemd. Any systemd-managed process that sends output to stdout will show that output in journald. You can use [Vector](https://vector.dev) to watch journald and relay the events it captures. Here’s a sample configuration that will encode the journald’s data into the newline-delimited JSON format that our API expects:
```yaml
# Put this in /etc/vector/vector.yaml
sources:
journald:
type: journald
include_matches:
_TRANSPORT:
- stdout
# See the Vector Remap Language reference for more info: https://vrl.dev
transforms:
parse_logs:
type: "remap"
inputs: ["journald"]
source: |
. = {"host": .host, "unit": ._SYSTEMD_USER_UNIT || ._SYSTEMD_UNIT, "message": .message, "timestamp": .timestamp}
structured = parse_json(.message) ?? {}
. = merge!(., structured)
sinks:
honeybadger:
type: "http"
inputs: ["parse_logs"]
uri: "https://api.honeybadger.io/v1/events"
request:
headers:
X-API-Key: "PROJECT_API_KEY"
encoding:
codec: "json"
framing:
method: "newline_delimited"
batch:
max_bytes: 1000000
```
Since journald captures *everything* that happens on your server, and since you probably don’t care about stuff like kernel messages, the `sources` section of the configuration limits what it will pass on to Honeybadger. This configuration will only relay events that were emitted to stdout, like web server logs, Rails application logs, and that sort of thing. If you really want to send everything that gets logged to journald, you can delete the `include_matches` portion of the configuration. See the [Vector documentation](https://vector.dev/docs/reference/configuration/sources/journald/) for more info on filtering the journald input. The `parse_logs` transformation also reduces the amount of data sent to Insights by stripping out things like the process ID, the user running the service, etc. If you decide you want to be able to query that data in Insights, you can remove the transform and change the `honeybadger` sink `inputs` from “parse\_logs” to “journald”. Please see our documentation on ingesting [log files](/guides/insights/integrations/log-files/) for a few more handy transformations you can use in your Vector configuration. ## Quick setup method [Section titled “Quick setup method”](#quick-setup-method) If you’re running a system that uses apt to manage packages, like Debian or Ubuntu, you can use the following command to fetch and run a [script](https://gist.github.com/stympy/9ccb5a809a6731f53b3335fb4e020c2c#file-install_vector-sh) that installs the Vector package, sets up the configuration file, and starts Vector as a service:
```shell
curl -sL https://gist.github.com/stympy/9ccb5a809a6731f53b3335fb4e020c2c/raw/bc5741a4e277ea3a7d6d0f5e70a67e0767aec221/install_vector.sh > install_vector.sh && \
chmod a+x install_vector.sh && \
HONEYBADGER_API_KEY="PROJECT_API_KEY" ./install_vector.sh
```
# Integrations
> Send Honeybadger data to other services.
Honeybadger has deep support for a wide variety of [third-party integrations](#supported-integrations). This page provides an overview of some cool features available for every integration. These settings are located at **Project settings > Alerts & integrations**. You can click the edit icon and customize the notifications for each integration. 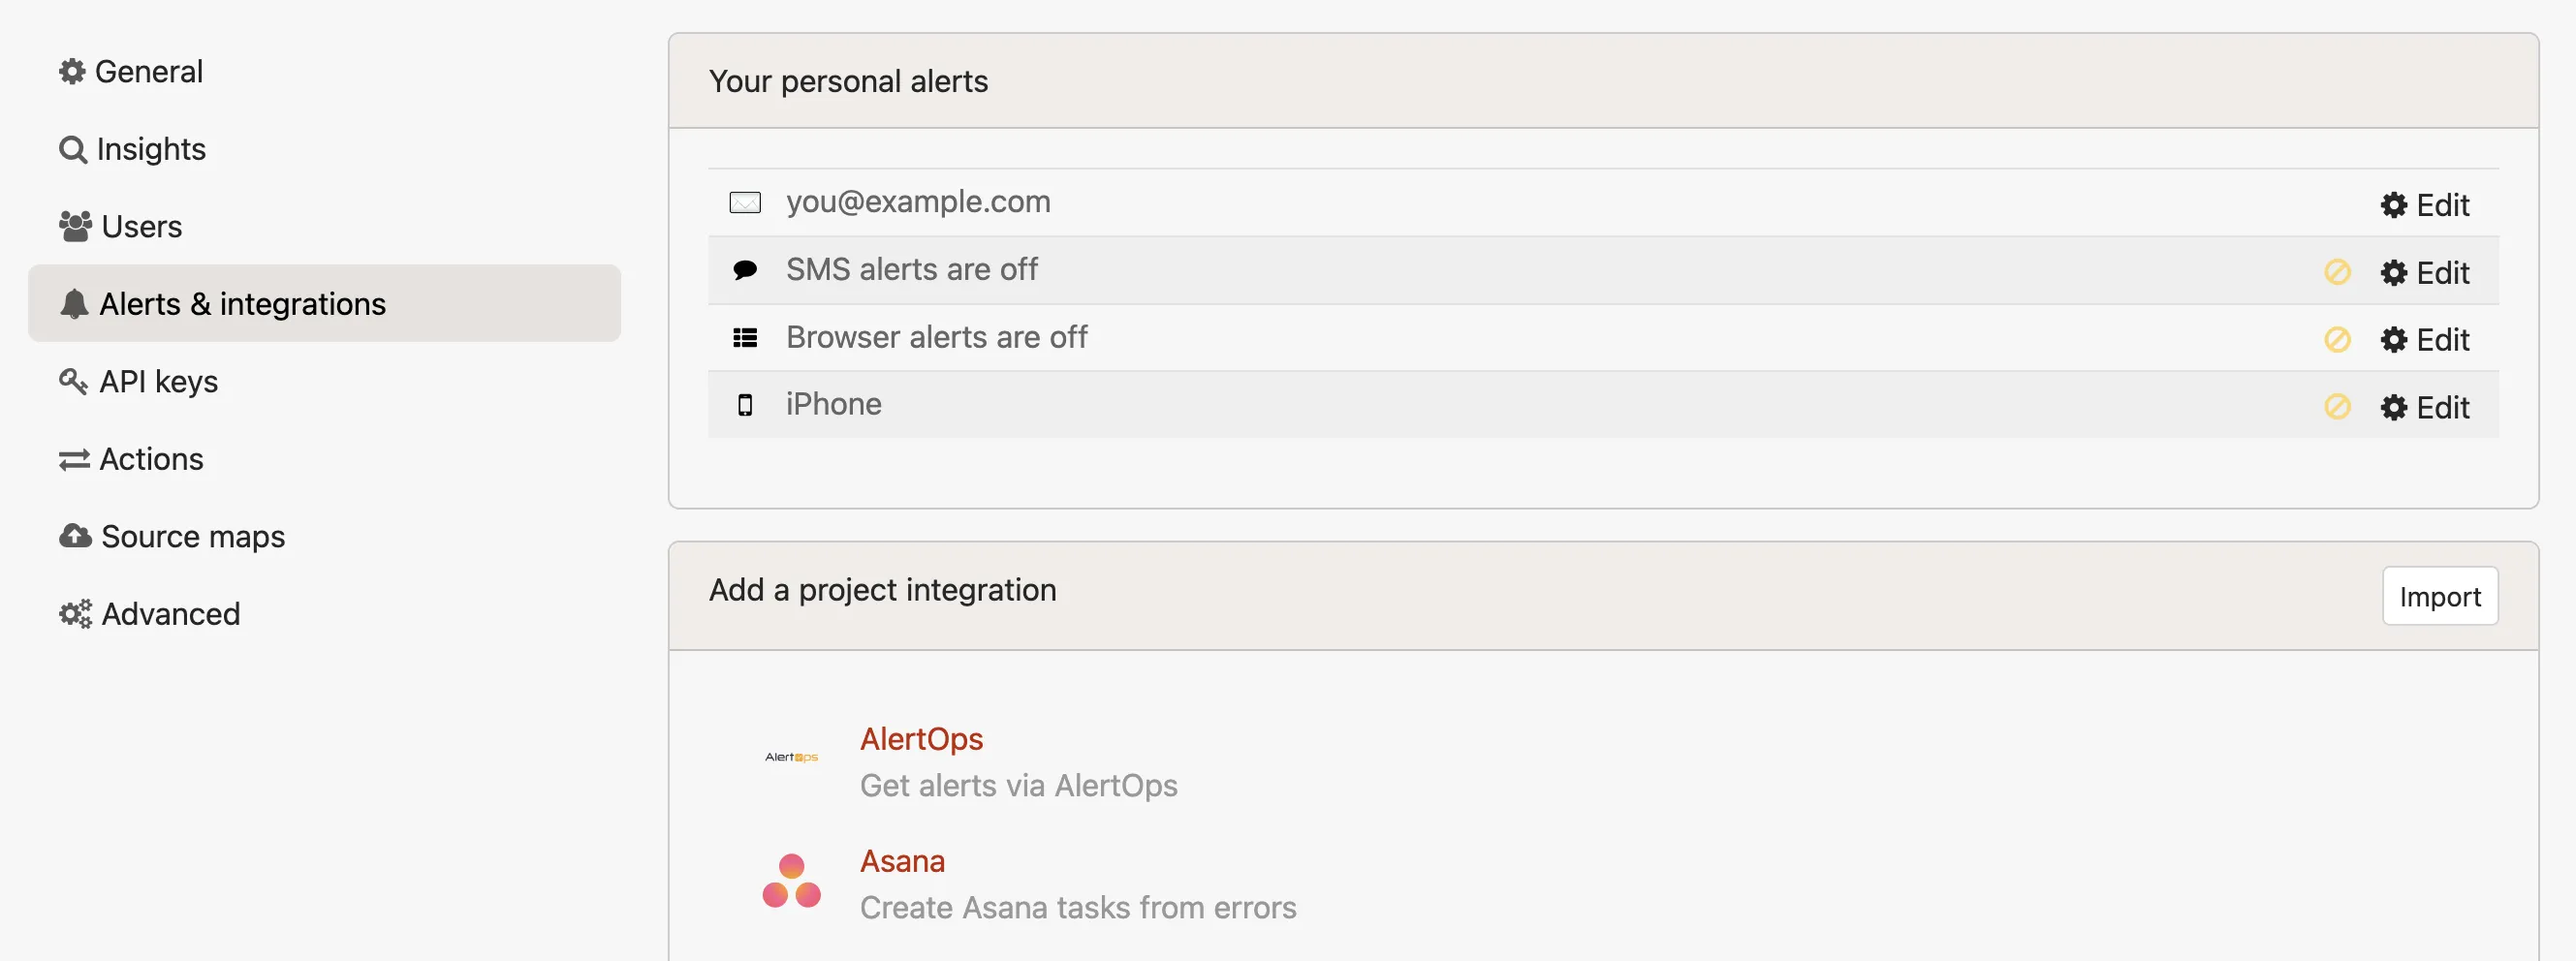 ## Customizing integration notifications [Section titled “Customizing integration notifications”](#customizing-integration-notifications) ### Errors [Section titled “Errors”](#errors) 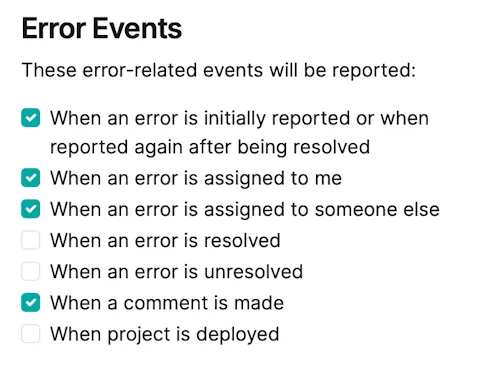 You get to choose which error events result in a notification or ticket being created: ### Uptime checks [Section titled “Uptime checks”](#uptime-checks) You can edit which uptime events are sent to the integration for all or a subset of the project’s uptime checks: 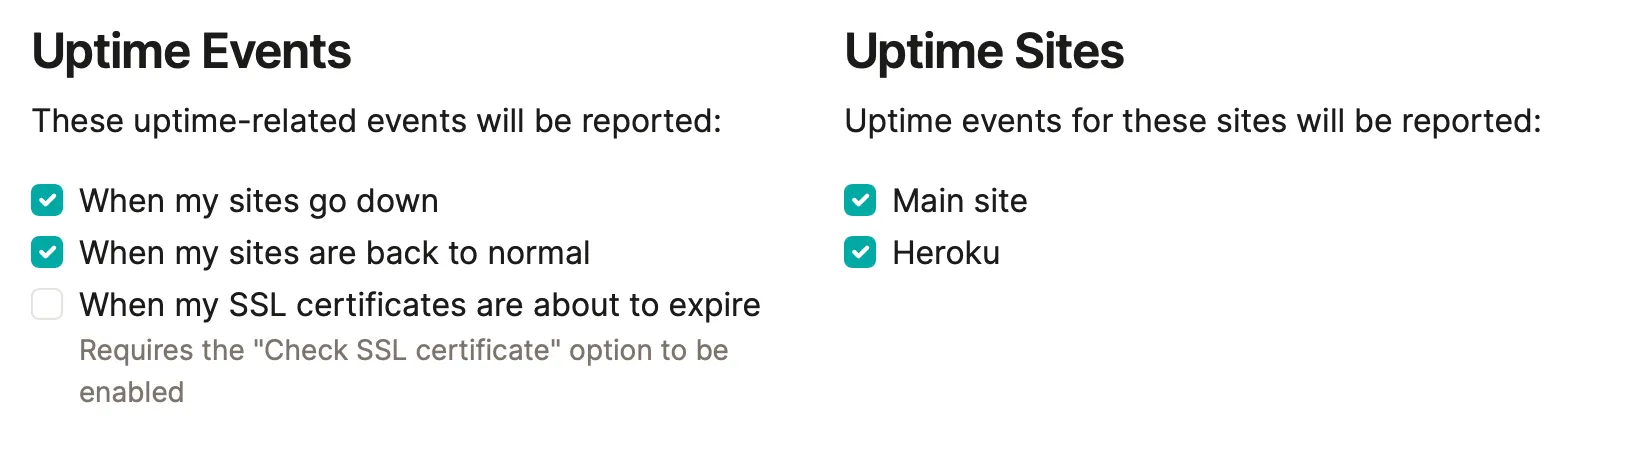 ### Check-Ins [Section titled “Check-Ins”](#check-ins) And you can also change what check-in events are reported: 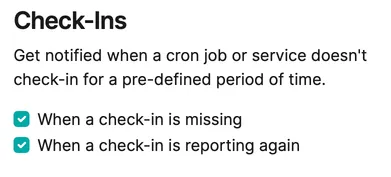 ### Environments [Section titled “Environments”](#environments) You can ignore environments. We auto-populate the list based on environments we’ve seen in your app.  ## Rate escalations [Section titled “Rate escalations”](#rate-escalations) Escalations let you receive extra notifications when your error rate exceeds a number you’ve configured.  ## Error volume anomaly detection [Section titled “Error volume anomaly detection”](#error-volume-anomaly-detection) Anomaly detection alerts you when a project’s **total error volume** deviates from its learned baseline. Unlike [rate escalations](#rate-escalations), which fire at a fixed threshold you have set, anomaly detection learns each project’s normal hourly error volume and notifies you when the current rate is statistically unusual (for example, “errors are 4.7× your normal rate”). Turn it on per integration in the **Anomaly detection** section in the integration’s options. Honeybadger evaluates your projects every few minutes and sends a single notification when a spike begins. A two-hour cooldown then suppresses repeat alerts so a sustained spike notifies you once rather than continuously. Anomaly detection needs enough history to learn what’s normal — at least 48 hours of error activity. Brand-new or very quiet projects won’t trigger alerts until they’ve accumulated enough data. Spike alerts go to notification and alerting integrations (email, Slack, SMS, PagerDuty, Opsgenie, Microsoft Teams, webhooks, and similar). Issue-tracker integrations (GitHub, Jira, Linear, and the like) don’t receive spike alerts, since a spike is an alert rather than a fileable issue. See the structure of the JSON sent to webhook and event-based integrations in the [`volume_spike` payload](/guides/integrations/payloads/volume_spike/). ## Throttling [Section titled “Throttling”](#throttling) Avoid floods of notifications when everything goes wrong at once.  ## Filters [Section titled “Filters”](#filters) With filters, you can be hyper-precise about which errors trigger notifications or issue creation. You could: * Create issues in separate trackers for staging, prepared and production * Route notifications to a certain team’s inbox whenever an error assigned to that team reoccurs.  The syntax for error filters is essentially the same as our search syntax, with a few limitations: * You can’t filter on params, context, session or other per-notice data * Filters don’t support freeform text search. You must use the `key:val` syntax. Below is a list of fields you can use when constructing your queries. Note that you can prefix any query with `-` to create its inverse. | Example query | Matches | | ------------------------------- | ------------------------------------------ | | `is:resolved` | Resolved errors | | `is:paused` | Paused errors | | `is:ignored` | Ignored errors | | `assignee:"nobody"` | Unassigned errors | | `assignee:"anybody"` | Errors assigned to anyone | | `assignee:"jane@email.com"` | Errors assigned to a specific person | | `environment:"production"` | Errors occurring in production | | `class:"PermissionDeniedError"` | Errors with a certain class | | `tag:"tag_example"` | Errors with a tag | | `message:"404"` | Errors with a message | | `component:"UsersController"` | Errors occurring in a controller/component | | `action:"update"` | Errors occurring in an action | Multiple filters are evaluated using a logical OR. If any query matches the error, a notification will be sent. When using negative queries like `-class:Foo`, this OR behavior can give unexpected results. To combine multiple negative matches, use a single filter with a search term like `-class:"Foo" AND -class:"Bar"`. ## Custom formatters [Section titled “Custom formatters”](#custom-formatters) For some of our integrations, we allow the option to provide a custom format for specific fields (e.g., email subject line or Trello card title). Your custom format will be used for all events that are applicable for the integration (reported, assigned, marked as resolved, etc). The following is a list of valid formatter tokens: | Token | Description | | --------------- | ----------------------------------------------------------------------------------- | | `[project]` | The project name | | `[environment]` | The operating environment — production, development, etc. | | `[type]` | The event type — occurred, assigned, etc. | | `[class]` | The class of the error associated with the event | | `[message]` | The message of the error associated with the event | | `[component]` | The component name (might be null, usually maps to the controller name) | | `[action]` | The action name (might be null, usually maps to the controller action e.g. `index`) | | `[fault_id]` | A unique id for the fault event | | `[file]` | The filename with path and line number where the error occurred | | `[backtrace]` | The backtrace of the error associated with the event (first 3 lines) | | `[url]` | The URL of the event in the Honeybadger UI | ## Supported integrations [Section titled “Supported integrations”](#supported-integrations) Your Honeybadger data can be sent to a variety of third-party services, listed below. We support creating issues for errors in the SCM and project management tools, such as GitHub and Jira. For communication tools like Slack and PagerDuty, we can send notifications for errors, sites that go down (and come back up), and check-ins. [AlertOps](/guides/integrations/alertops/)Send alerts to AlertOps [Asana](/guides/integrations/asana/)Create Asana tasks from errors [Backlog](/guides/integrations/backlog/)Create Backlog issues from errors [Bitbucket](/guides/integrations/bitbucket/)Create Bitbucket issues from errors [Campfire](/guides/integrations/campfire/)Send notifications to Campfire [ClickUp](/guides/integrations/clickup/)Create ClickUp tasks from errors [ClickUp Chat](/guides/integrations/clickup-chat/)Send messages to ClickUp Chat [Datadog](/guides/integrations/datadog/)Send events to Datadog [Discord](/guides/integrations/discord/)Send notifications to Discord [Email](/guides/integrations/email/)Receive email notifications [GitHub](/guides/integrations/github/)Create GitHub issues from errors [GitLab](/guides/integrations/gitlab/)Create GitLab issues from errors [Google Chat](/guides/integrations/google-chat/)Send messages to Google Chat [ilert](/guides/integrations/ilert/)Create ilert alerts [incident.io](/guides/integrations/incident-io/)Create incidents in incident.io [Instatus](/guides/integrations/instatus/)Update Instatus status page [Intercom](/guides/integrations/intercom/)Send messages to Intercom [Jira & Jira Cloud](/guides/integrations/jira/)Create Jira issues from errors [Linear](/guides/integrations/linear/)Create Linear issues from errors [Mattermost](/guides/integrations/mattermost/)Send notifications to Mattermost [Microsoft Teams](/guides/integrations/microsoft-teams/)Send messages to Microsoft Teams [OpsGenie](/guides/integrations/opsgenie/)Create OpsGenie alerts [PagerDuty](/guides/integrations/pagerduty/)Create PagerDuty incidents [PagerTree](/guides/integrations/pagertree/)Create PagerTree alerts [Redmine](/guides/integrations/redmine/)Create Redmine issues from errors [Rootly](/guides/integrations/rootly/)Create Rootly incidents [Shortcut](/guides/integrations/shortcut/)Create Shortcut stories from errors [Slack](/guides/integrations/slack/)Send notifications to Slack [Splunk On-Call](/guides/integrations/splunk-on-call/)Create Splunk On-Call incidents [Sprintly](/guides/integrations/sprintly/)Create Sprintly items from errors [Trello](/guides/integrations/trello/)Create Trello cards from errors [Webhook](/guides/integrations/webhook/)Send webhooks to custom endpoints [Zulip](/guides/integrations/zulip/)Send messages to Zulip
# AlertOps
> Connect Honeybadger to AlertOps to route notifications through your incident management and alerting system.
Users with administrative privileges can find this integration below the list of personal alert integrations on the Alerts & Integrations tab of the Project Settings page. ## Setup [Section titled “Setup”](#setup) ### 1. Select the AlertOps integration [Section titled “1. Select the AlertOps integration”](#1-select-the-alertops-integration)  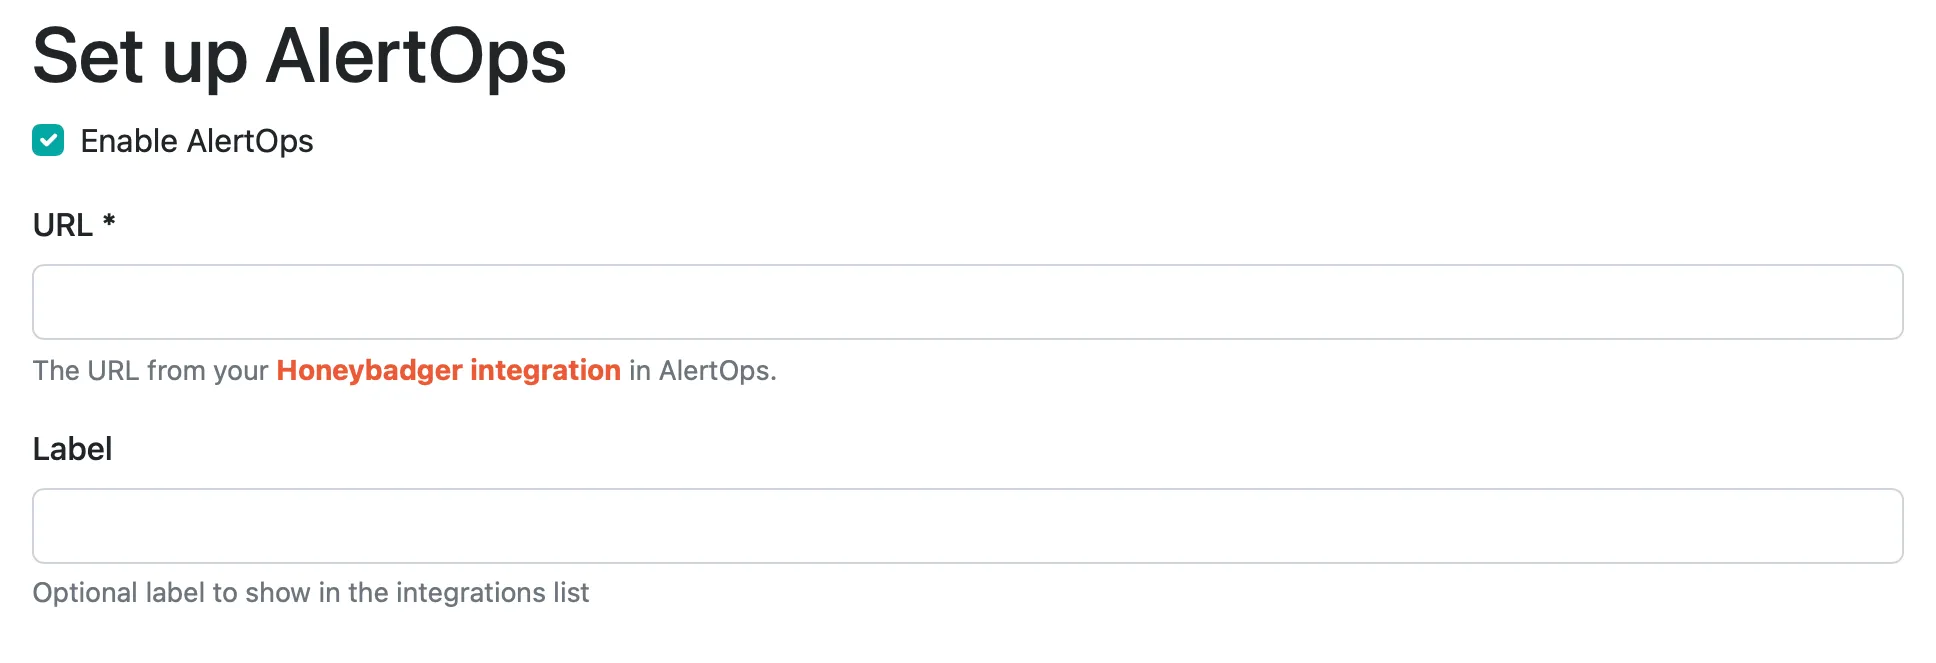 ### 2. Enter the AlertOps URL [Section titled “2. Enter the AlertOps URL”](#2-enter-the-alertops-url) After you set up the [integration URL](https://honeybadger.alertops.com/admin/MappingRulesList.aspx) at AlertOps, you can enter that URL here. ### 3. Save [Section titled “3. Save”](#3-save) That’s it! You’re good to go.
# Asana
> Connect Honeybadger to Asana to automatically create tasks from errors and track bug fixes in your project workflow.
Users with administrative privileges can find this integration below the list of personal alert integrations on the Alerts & Integrations tab of the Project Settings page. ## Setup [Section titled “Setup”](#setup) ### 1. Select the Asana integration [Section titled “1. Select the Asana integration”](#1-select-the-asana-integration)  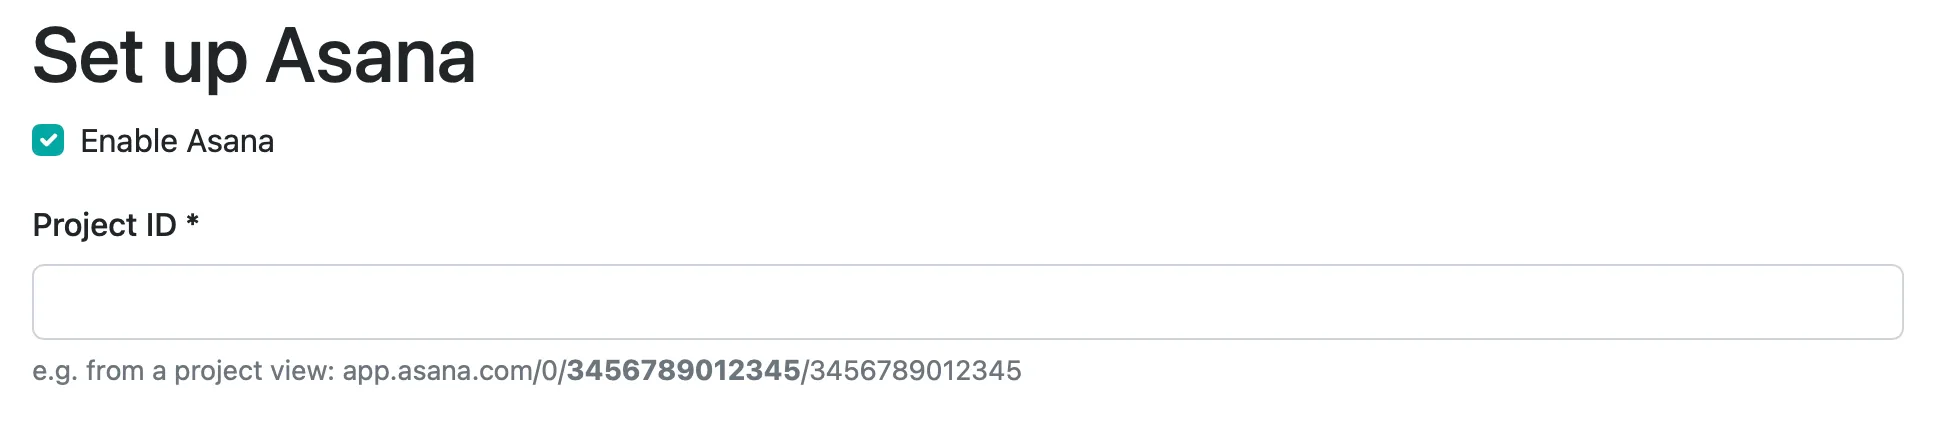 ### 2. Enter your project ID [Section titled “2. Enter your project ID”](#2-enter-your-project-id) You can find your Project ID from a project view. See the input hint for more details on where the ID is located. ### 3. Connect via OAuth [Section titled “3. Connect via OAuth”](#3-connect-via-oauth) Select the “Connect OAuth” button and give access to our app. ### 4. Save [Section titled “4. Save”](#4-save) That’s it! You can test the integration by clicking “Test”. Otherwise, just save it and you’re ready to go.
# Backlog
> Connect Honeybadger to Backlog to automatically create issues from errors and track bug fixes in your project workflow.
Users with administrative privileges can find this integration below the list of personal alert integrations on the Alerts & Integrations tab of the Project Settings page. [Backlog](https://backlog.com/) is a project management and collaboration platform that helps teams track issues, tasks, and bugs. Honeybadger automatically creates issues in Backlog when errors occur and keeps the status in sync, making it easy to track bug fixes as part of your project workflow. ## Setup [Section titled “Setup”](#setup) ### 1. Select the Backlog integration [Section titled “1. Select the Backlog integration”](#1-select-the-backlog-integration)  ### 2. Enter your Space URL [Section titled “2. Enter your Space URL”](#2-enter-your-space-url) Your Space URL is the full URL of your Backlog space, including the protocol. For example: * `https://example.backlog.com` (for international spaces) * `https://example.backlog.jp` (for Japanese spaces) ### 3. Set the API key [Section titled “3. Set the API key”](#3-set-the-api-key) You can generate an API key from your Backlog account: 1. Go to **Personal Settings** in Backlog 2. Navigate to the **API** section 3. Generate a new API key 4. Copy the key and paste it into the API Key field ### 4. Fetch projects [Section titled “4. Fetch projects”](#4-fetch-projects) Click the **Fetch Projects** button to retrieve your Backlog projects. This will populate the project dropdown and enable the remaining configuration options. ### 5. Select project and configure issue settings [Section titled “5. Select project and configure issue settings”](#5-select-project-and-configure-issue-settings) Choose the Backlog project where issues should be created, then configure the required settings: * **Issue Type**: The type of issue to create (bug, task, etc.) * **Priority**: The priority level for created issues * **Closed Status**: The status to transition issues to when errors are marked as resolved * **Open Status**: The status to transition issues to when errors are reopened By default, Honeybadger will automatically create a Backlog issue when a new error occurs, and sync status updates between Backlog and Honeybadger. See [Two-way sync with Backlog](#two-way-sync-with-backlog) for additional options. ### 6. Save [Section titled “6. Save”](#6-save) That’s it! You can test the integration by clicking “Test this integration”. Otherwise, just save it and you’re ready to go. ## Two-way sync with Backlog [Section titled “Two-way sync with Backlog”](#two-way-sync-with-backlog) Honeybadger provides seamless two-way synchronization with Backlog by default. **From Honeybadger to Backlog:** * **Automatically create an issue when an error occurs:** When a new error occurs, Honeybadger creates a new issue in Backlog with the **Open Status** * **Automatically resolve issues**: When you resolve an error in Honeybadger, Honeybadger transitions the Backlog issue to the **Closed Status** * **Automatically reopen issues**: When you unresolve (reopen) an error in Honeybadger, Honeybadger transitions the Backlog issue to the **Open Status** **From Backlog to Honeybadger:** * **Sync status from Backlog**: Honeybadger creates [a webhook](https://support.nulab.com/hc/en-us/articles/8840133998489-How-to-add-and-manage-webhooks-in-Backlog) in your Backlog project that automatically syncs status changes back to Honeybadger: * When a Backlog issue’s status changes to your selected **Closed Status**: the error is automatically resolved in Honeybadger * When a Backlog issue’s status changes from your selected **Closed Status** to any other status: the error is automatically unresolved in Honeybadger These options are enabled by default to keep your Backlog issues and Honeybadger errors in sync automatically. You can uncheck any of these options if you prefer to create/update issues manually. For additional integration options, see the [integrations guide](/guides/integrations/).
# Bitbucket
> Connect Honeybadger to Bitbucket to automatically create issues from errors and link commits to deployments.
Users with administrative privileges can find this integration below the list of personal alert integrations on the Alerts & Integrations tab of the Project Settings page. ## Setup [Section titled “Setup”](#setup) ### 1. Select the Bitbucket integration [Section titled “1. Select the Bitbucket integration”](#1-select-the-bitbucket-integration)  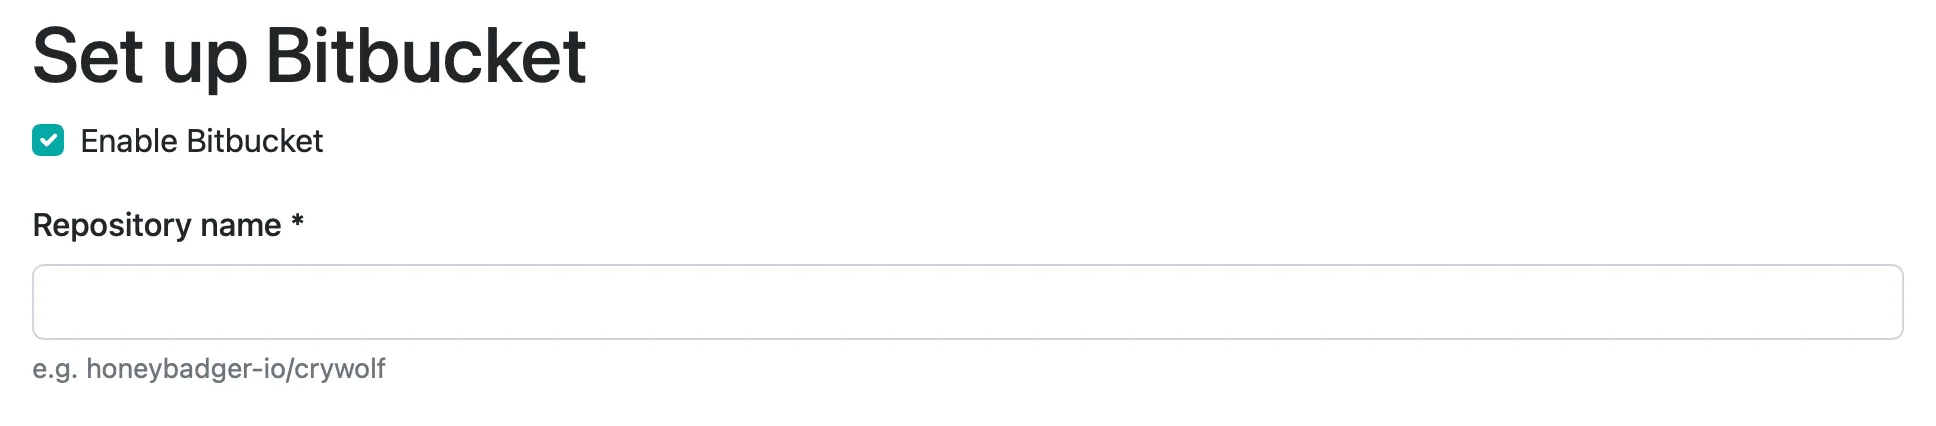 ### 2. Set the repository name [Section titled “2. Set the repository name”](#2-set-the-repository-name) The repository name includes the account name. For example, Honeybadger has a repo called “docs” the repository name we’d enter here is “honeybadger/docs”. ### 3. Authenticate [Section titled “3. Authenticate”](#3-authenticate) Click “Save and Authenticate With Bitbucket” to complete setup. This will send you to bitbucket.org to authenticate via OAuth.
# Campfire
> Connect Honeybadger to Campfire to receive real-time application monitoring alerts directly in your team's chat rooms.
Users with administrative privileges can find this integration below the list of personal alert integrations on the Alerts & Integrations tab of the Project Settings page. ## Setup [Section titled “Setup”](#setup) ### 1. Select the Campfire integration [Section titled “1. Select the Campfire integration”](#1-select-the-campfire-integration)  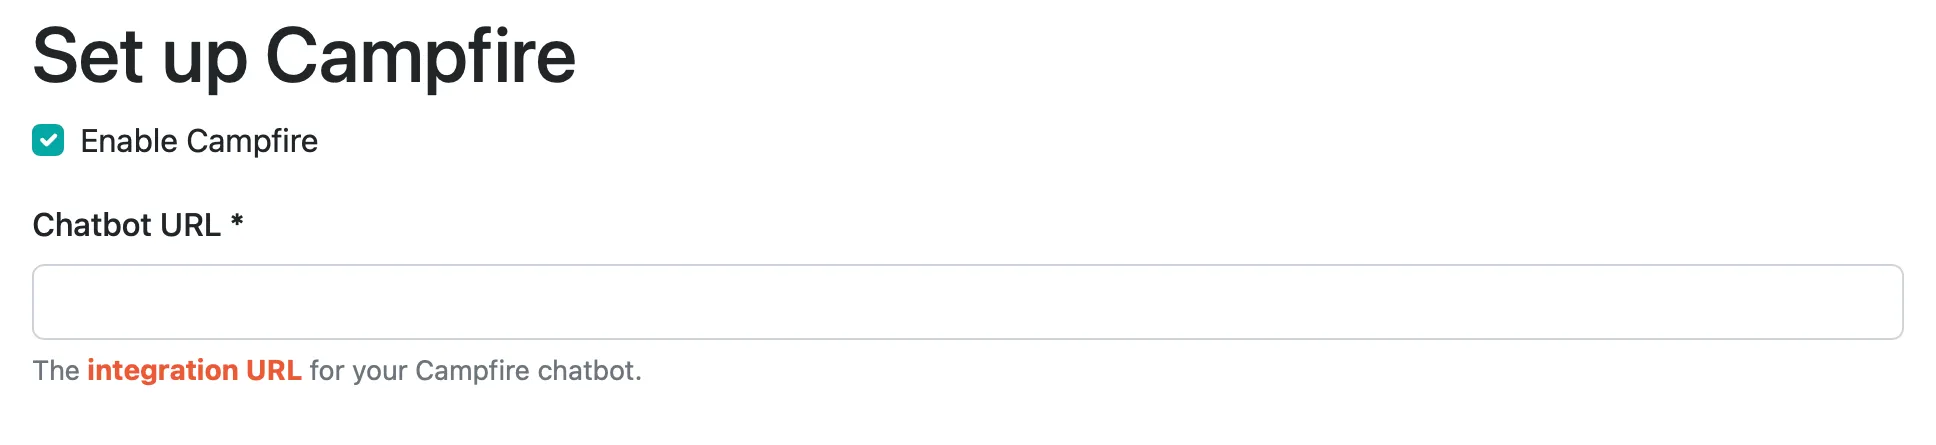 ### 2. Create a chatbot integration in Basecamp [Section titled “2. Create a chatbot integration in Basecamp”](#2-create-a-chatbot-integration-in-basecamp) You can configure chatbots under **Basecamp** → **\[Your project]** → **Chat** → **…** (click the three dots in the upper right-hand corner of the chat window to get the context menu). 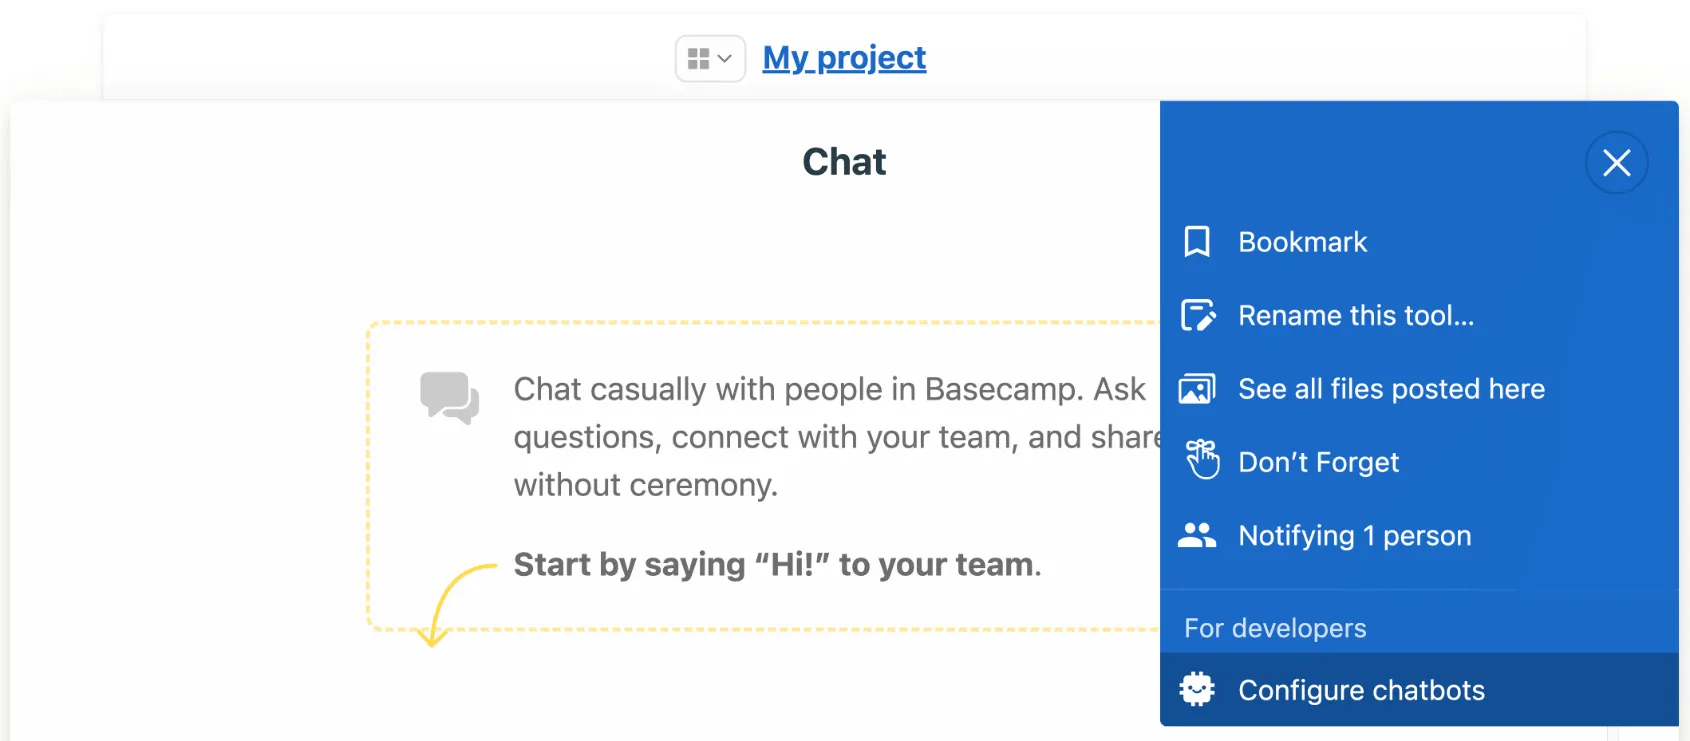 To add a chatbot, click **Configure chatbots** → **Add a new chatbot**, and type “Honeybadger” in the `Name` field. 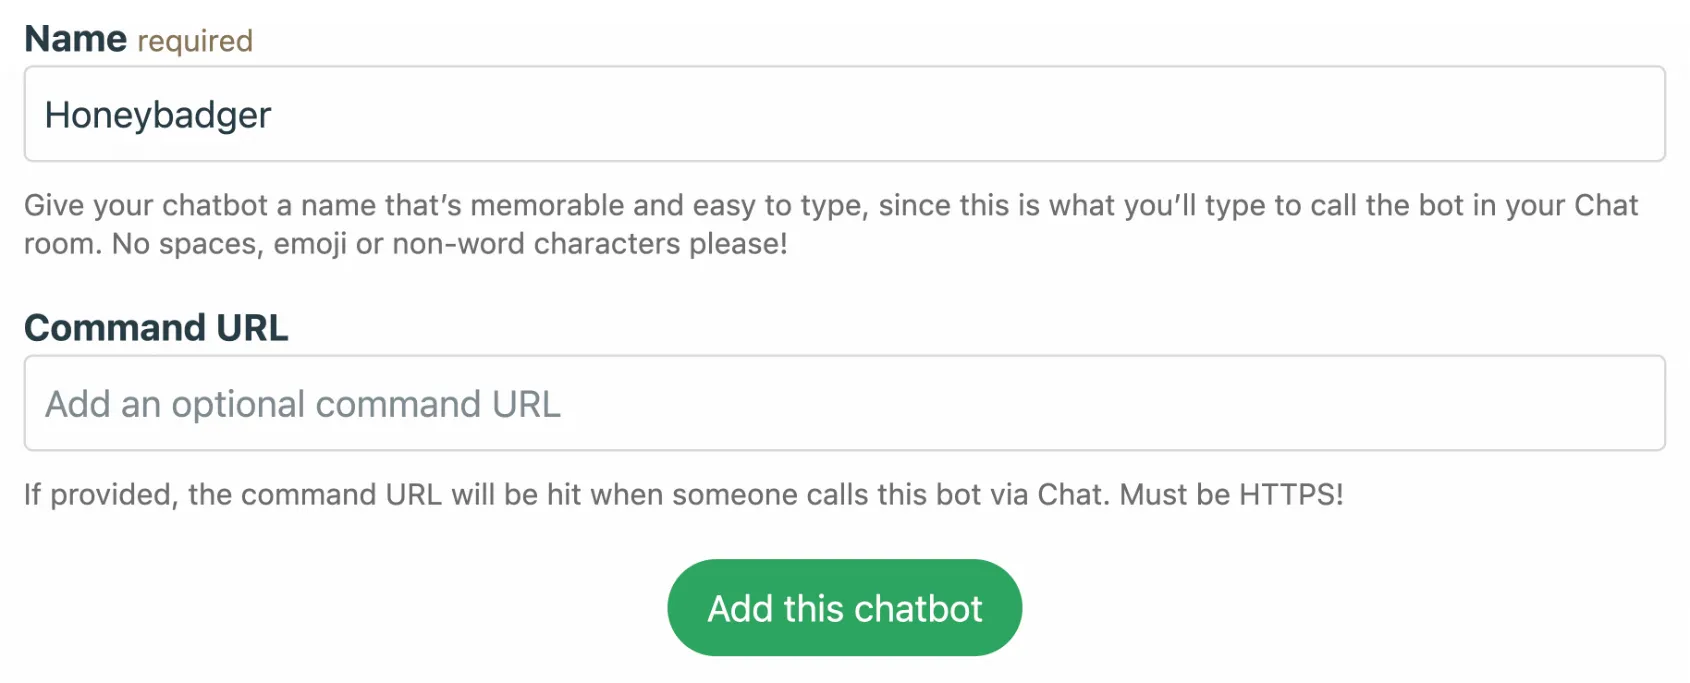 You can optionally upload an avatar (i.e. [our logo](https://www.honeybadger.io/assets/)). Leave `Command URL` blank. ### 3. Set the chatbot URL in Honeybadger [Section titled “3. Set the chatbot URL in Honeybadger”](#3-set-the-chatbot-url-in-honeybadger) After you create the chatbot in Basecamp, click on “Send line from this integration to Chat…” and copy/paste the URL in the example into the `Chatbot URL` field in Honeybadger.  ### 4. Save [Section titled “4. Save”](#4-save) That’s it! You can test the integration by clicking “Test”. Otherwise, just save it and you’re ready to go.
# ClickUp
> Connect Honeybadger to ClickUp to automatically create tasks from errors and track bug fixes in your workflow.
Users with administrative privileges can find this integration below the list of personal alert integrations on the Alerts & Integrations tab of the Project Settings page. ## Setup [Section titled “Setup”](#setup) ### 1. Select the ClickUp integration [Section titled “1. Select the ClickUp integration”](#1-select-the-clickup-integration)  ### 2. Connect via OAuth [Section titled “2. Connect via OAuth”](#2-connect-via-oauth) An OAuth dialog should appear. Log in to your account and grant access to one or more workspaces. You’ll then be redirected back to the integration page. ### 3. Select workspace and teamspace [Section titled “3. Select workspace and teamspace”](#3-select-workspace-and-teamspace) Select one of the available workspaces and then a teamspace. ### 4. Select a list (or folder first) [Section titled “4. Select a list (or folder first)”](#4-select-a-list-or-folder-first) If the task list you are looking for is in a folder, select that folder first. Task lists that are not in a folder will be immediately listed in the dropdown. ### 5. Set statuses [Section titled “5. Set statuses”](#5-set-statuses) After selecting a task list, set the “initial”, “resolve”, and “reopen” statuses. ### 6. Tags [Section titled “6. Tags”](#6-tags) Add a list of comma-separated tags you wish to be associated when a task is created. ### 7. Save [Section titled “7. Save”](#7-save) That’s it! You can test the integration by clicking “Test”. Otherwise, just save it and you’re ready to go.
# ClickUp Chat
> Connect Honeybadger to ClickUp Chat to receive real-time application monitoring alerts in your team's chat workspace.
Users with administrative privileges can find this integration below the list of personal alert integrations on the Alerts & Integrations tab of the Project Settings page. ## Setup [Section titled “Setup”](#setup) ### 1. Select the ClickUp Chat integration [Section titled “1. Select the ClickUp Chat integration”](#1-select-the-clickup-chat-integration)  ### 2. Connect via OAuth [Section titled “2. Connect via OAuth”](#2-connect-via-oauth) An OAuth dialog should appear. Log in to your account and grant access to one or more workspaces. You’ll then be redirected back to the integration page. ### 3. Select workspace and channel [Section titled “3. Select workspace and channel”](#3-select-workspace-and-channel) Select one of the available workspaces and then a channel where the bot will post. ### 4. Save [Section titled “4. Save”](#4-save) That’s it! You can test the integration by clicking “Test”. Otherwise, just save it and you’re ready to go.
# Datadog
> Connect Honeybadger to Datadog to send application events to your monitoring systems and create unified observability.
Datadog is an enterprise platform for infrastructure and application monitoring. Connect Honeybadger to Datadog to surface errors, uptime events, and Insights alarms directly in your Datadog event stream—bringing developer-focused monitoring into your existing observability workflow. Users with administrative privileges can find this integration below the list of personal alert integrations on the Alerts & Integrations tab of the Project Settings page. ## Setup [Section titled “Setup”](#setup) ### 1. Install the integration in Datadog [Section titled “1. Install the integration in Datadog”](#1-install-the-integration-in-datadog) Click the **Install Integration** button on the [Honeybadger Integration Tile](https://app.datadoghq.com/account/settings#integrations/honeybadger) in Datadog. ### 2. Select the Datadog integration in Honeybadger [Section titled “2. Select the Datadog integration in Honeybadger”](#2-select-the-datadog-integration-in-honeybadger)  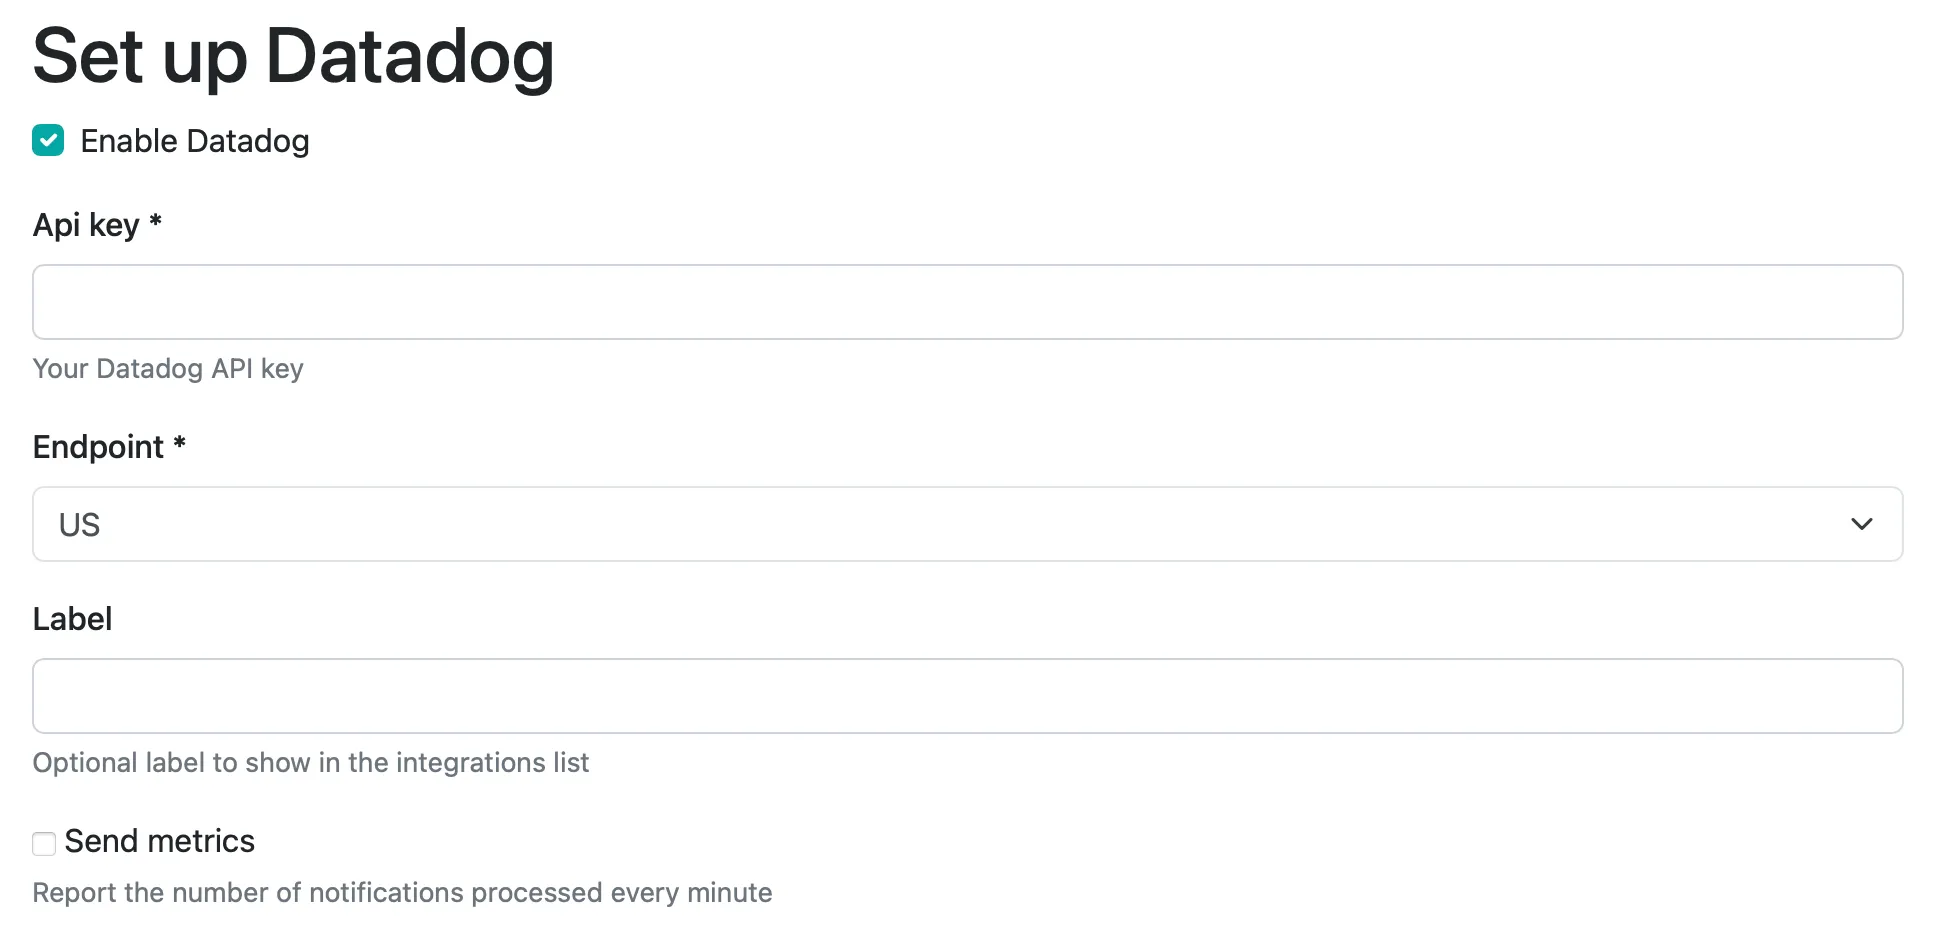 ### 3. Set the API key [Section titled “3. Set the API key”](#3-set-the-api-key) You can generate a Datadog API key from your [Datadog organization settings page](https://app.datadoghq.com/organization-settings/api-keys). ### 4. Select region [Section titled “4. Select region”](#4-select-region) Choose from the following supported Datadog regions: US1, US3, US5, US1-FED, EU1, or AP1. ### 5. Select label (optional) [Section titled “5. Select label (optional)”](#5-select-label-optional) If you have multiple Datadog integrations, you can add a label to differentiate in the integration list view. ### 6. Choose whether to send metrics [Section titled “6. Choose whether to send metrics”](#6-choose-whether-to-send-metrics) Enabling the “Send metrics” option will result in the metric `honeybadger.occurrences_per_minute` to be reported to Datadog. ### 7. Save [Section titled “7. Save”](#7-save) That’s it! You can test the integration by clicking “Test”. Otherwise, just save it and you’re ready to go.
# Discord
> Connect Honeybadger to Discord to receive real-time application monitoring alerts directly in your team's channels.
Users with administrative privileges can find this integration below the list of personal alert integrations on the Alerts & Integrations tab of the Project Settings page. ## Setup [Section titled “Setup”](#setup) ### 1. Select Discord from the integrations list [Section titled “1. Select Discord from the integrations list”](#1-select-discord-from-the-integrations-list)  ### 2. Enter your Discord webhook URL [Section titled “2. Enter your Discord webhook URL”](#2-enter-your-discord-webhook-url) 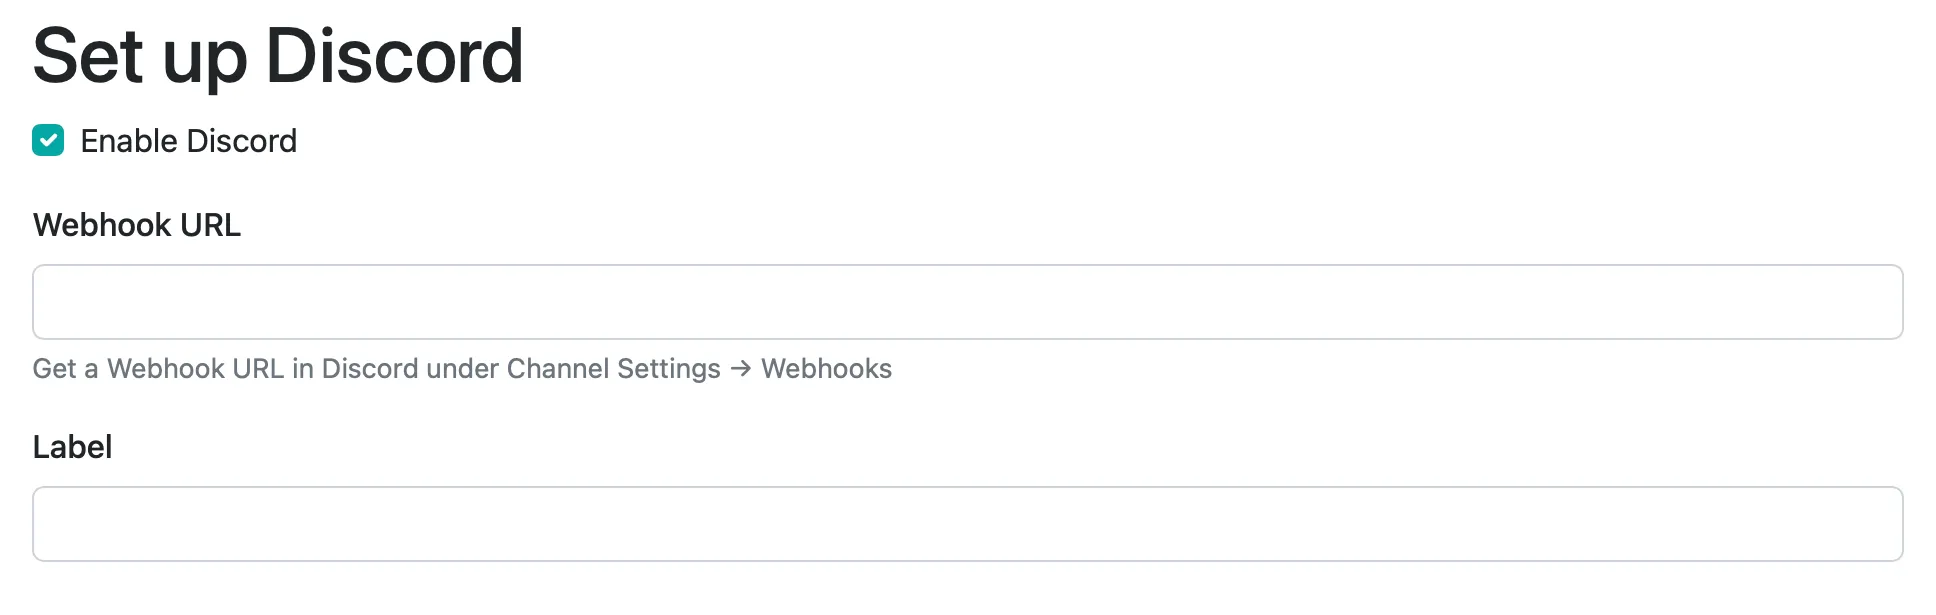 You can find your Discord Webhook URL under Channel Settings > Webhooks. ### 3. Save [Section titled “3. Save”](#3-save) That’s it! You can test the integration by clicking “Test”. Otherwise, just save it and you’re ready to go.
# Email
> Configure email notifications from Honeybadger to receive real-time application monitoring alerts and incident updates directly in your inbox.
Users with administrative privileges can find this integration below the list of personal alert integrations on the Alerts & Integrations tab of the Project Settings page. Heads Up! This isn’t where you configure your personal email notifications. This email channel is specifically for integrating with services like Basecamp which consume inbound email. ## Setup [Section titled “Setup”](#setup) ### 1. Select the Email integration [Section titled “1. Select the Email integration”](#1-select-the-email-integration)  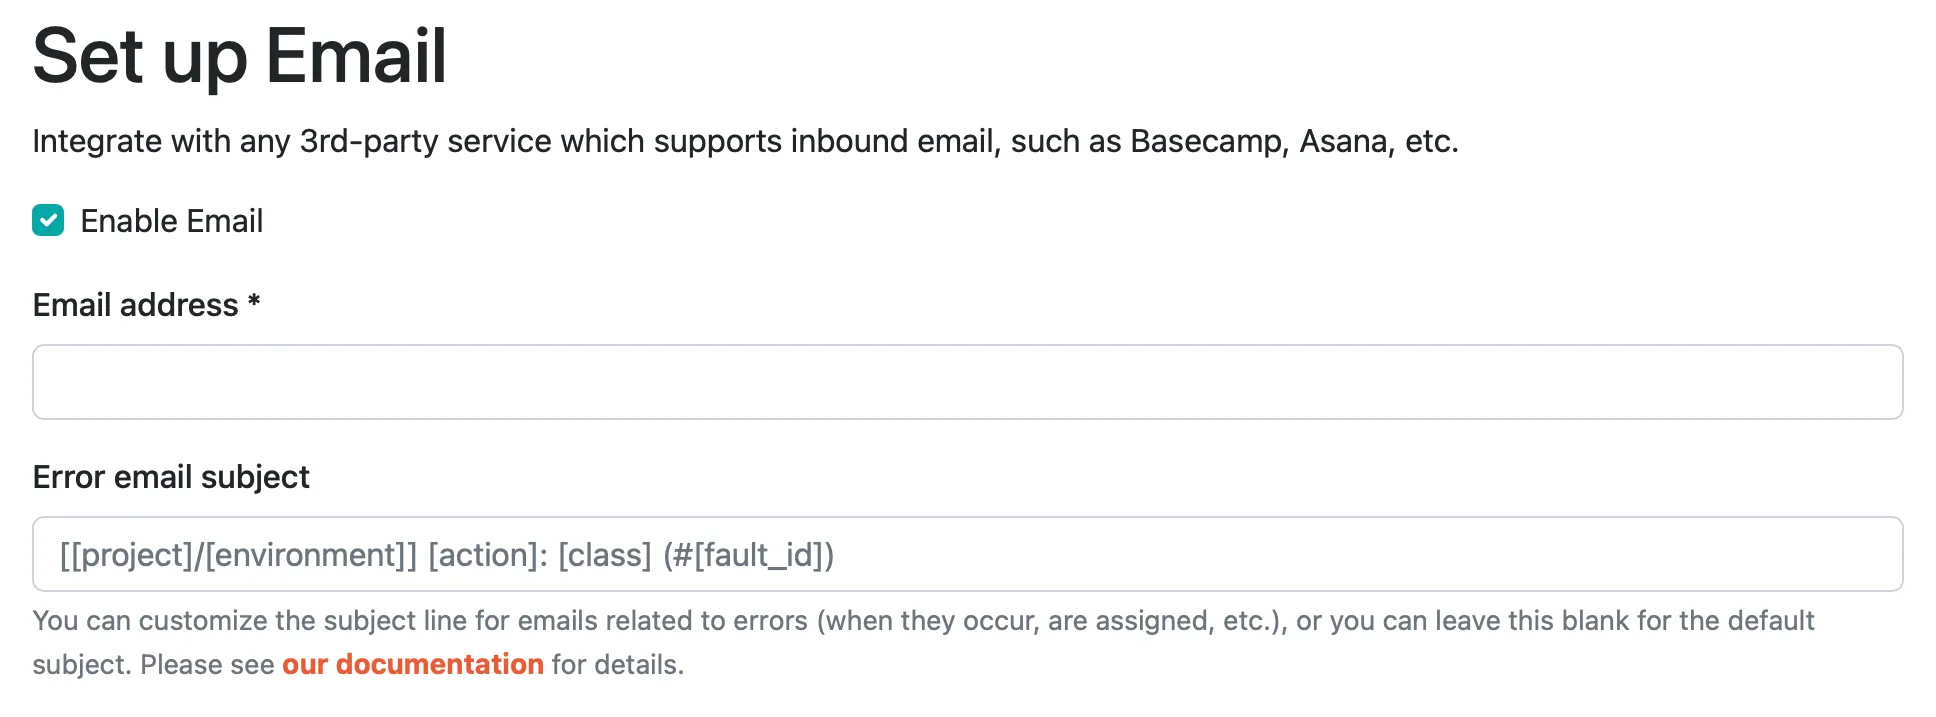 ### 2. Enter the email address [Section titled “2. Enter the email address”](#2-enter-the-email-address) It’s just an email address, folks. I’m sure you can figure it out. :wink: ### 3. Save [Section titled “3. Save”](#3-save) That’s it! Just save and you’re ready to go.
# GitHub
> Connect Honeybadger to GitHub to automatically create issues from errors and link commits to deployments.
Users with administrative privileges can find this integration below the list of personal alert integrations on the Alerts & Integrations tab of the Project Settings page. ## Setup [Section titled “Setup”](#setup) ### 1. Select the GitHub integration [Section titled “1. Select the GitHub integration”](#1-select-the-github-integration)  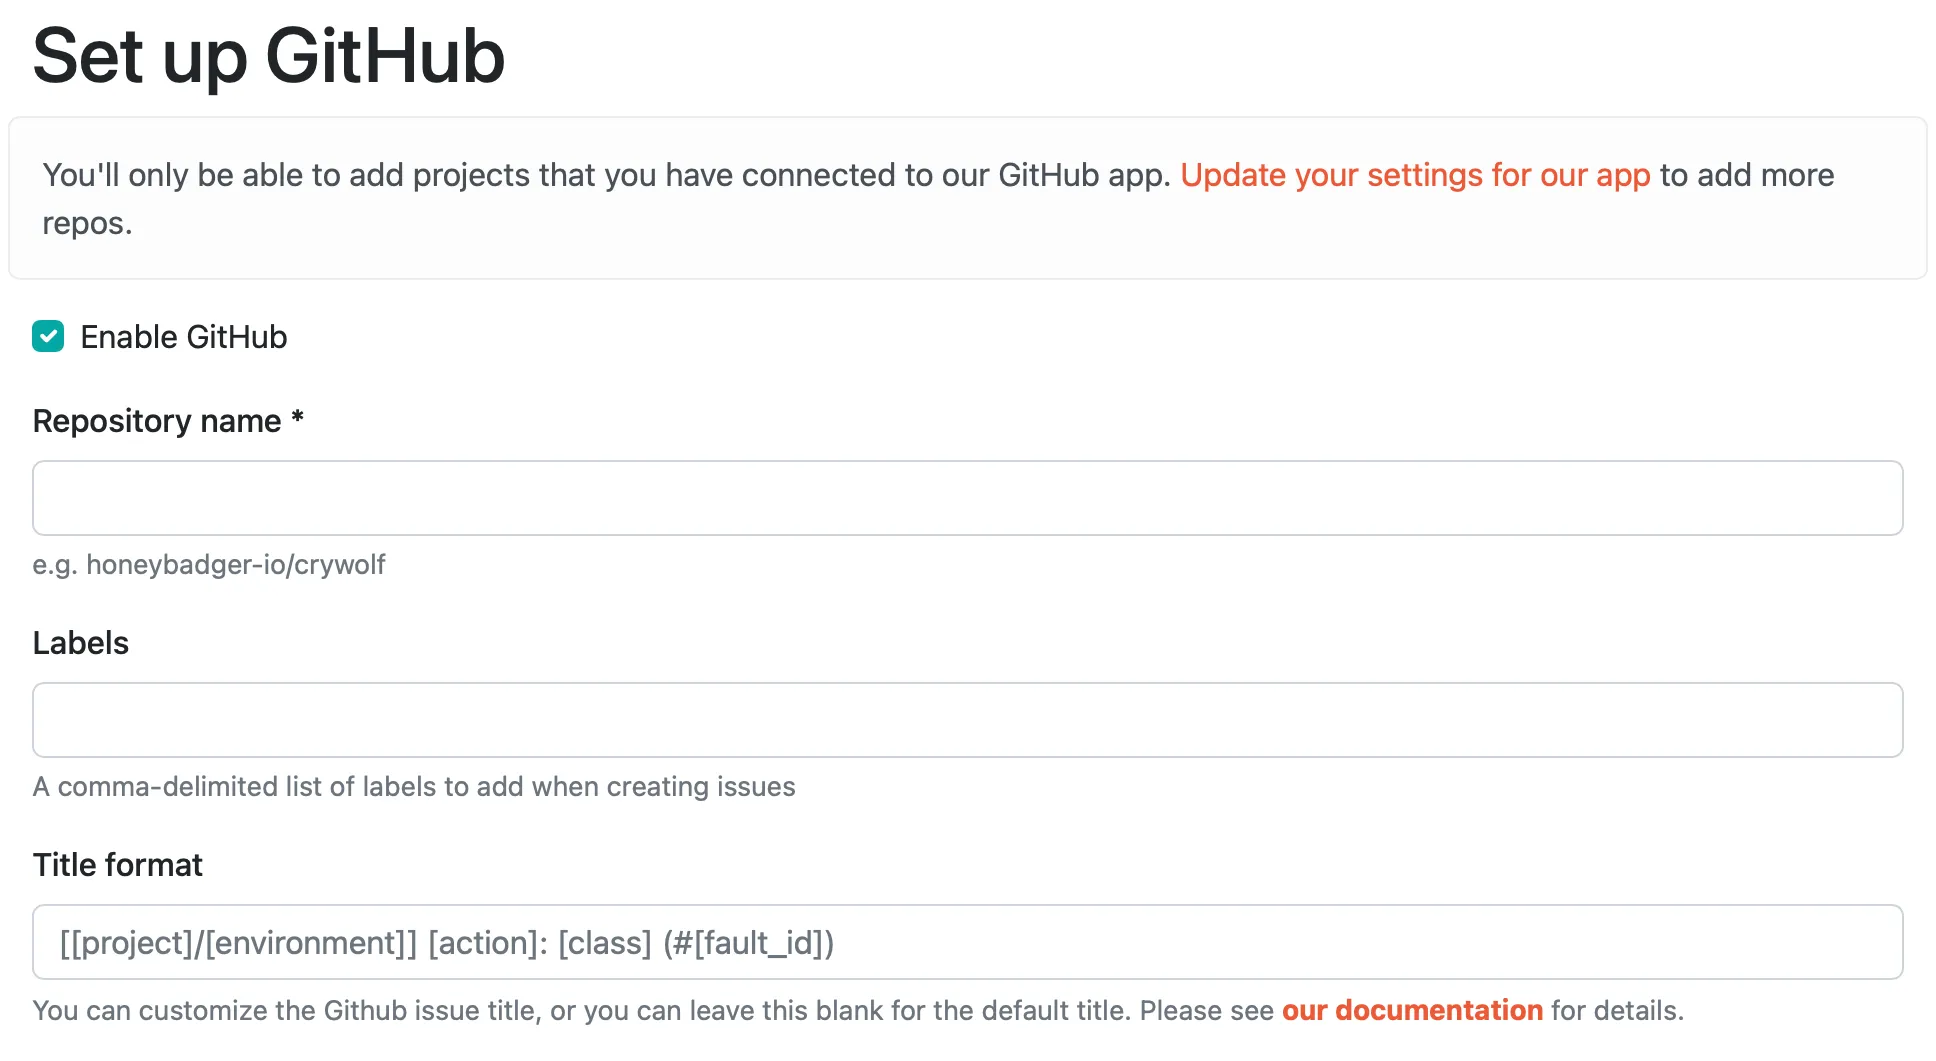 ### 2. Authenticate [Section titled “2. Authenticate”](#2-authenticate) If you haven’t already granted our GitHub app access to your account, you will be prompted to do so. After that is done, you’ll be prompted to install our GitHub app in your GitHub repositories. Once that’s done, you’ll be able to create a new GitHub integration. ### 3. Set the repository name [Section titled “3. Set the repository name”](#3-set-the-repository-name) The repository name includes the account or organization name. For example, our gem is hosted at , so we’d enter “honeybadger-io/ruby” for the repo name to connect to that repository. ### 4. Enter labels (optional) [Section titled “4. Enter labels (optional)”](#4-enter-labels-optional) If you’d like us to label issues we create in GitHub, just enter a comma-separated list of tags here. ### 5. Title format (optional) [Section titled “5. Title format (optional)”](#5-title-format-optional) Customize the issue title, if you want, with our handy [custom formatters](/guides/integrations/#custom-formatters). ### 6. Send a detailed issue body (optional) [Section titled “6. Send a detailed issue body (optional)”](#6-send-a-detailed-issue-body-optional) By default, Honeybadger creates GitHub issues with a short backtrace excerpt and a link back to the fault in Honeybadger. Enable **Send a detailed issue body** to instead create issues with a full Markdown body that includes context, parameters, and the backtrace. Note that enabling this sends more potentially sensitive fault data to GitHub. ### 7. Save [Section titled “7. Save”](#7-save) That’s it! You can test the integration by clicking “Test”. Otherwise, just save it and you’re ready to go.
# GitLab
> Connect Honeybadger to GitLab to automatically create issues from errors and link commits to deployments.
Users with administrative privileges can find this integration below the list of personal alert integrations on the Alerts & Integrations tab of the Project Settings page. ## Setup [Section titled “Setup”](#setup) ### 1. Select the GitLab integration [Section titled “1. Select the GitLab integration”](#1-select-the-gitlab-integration)  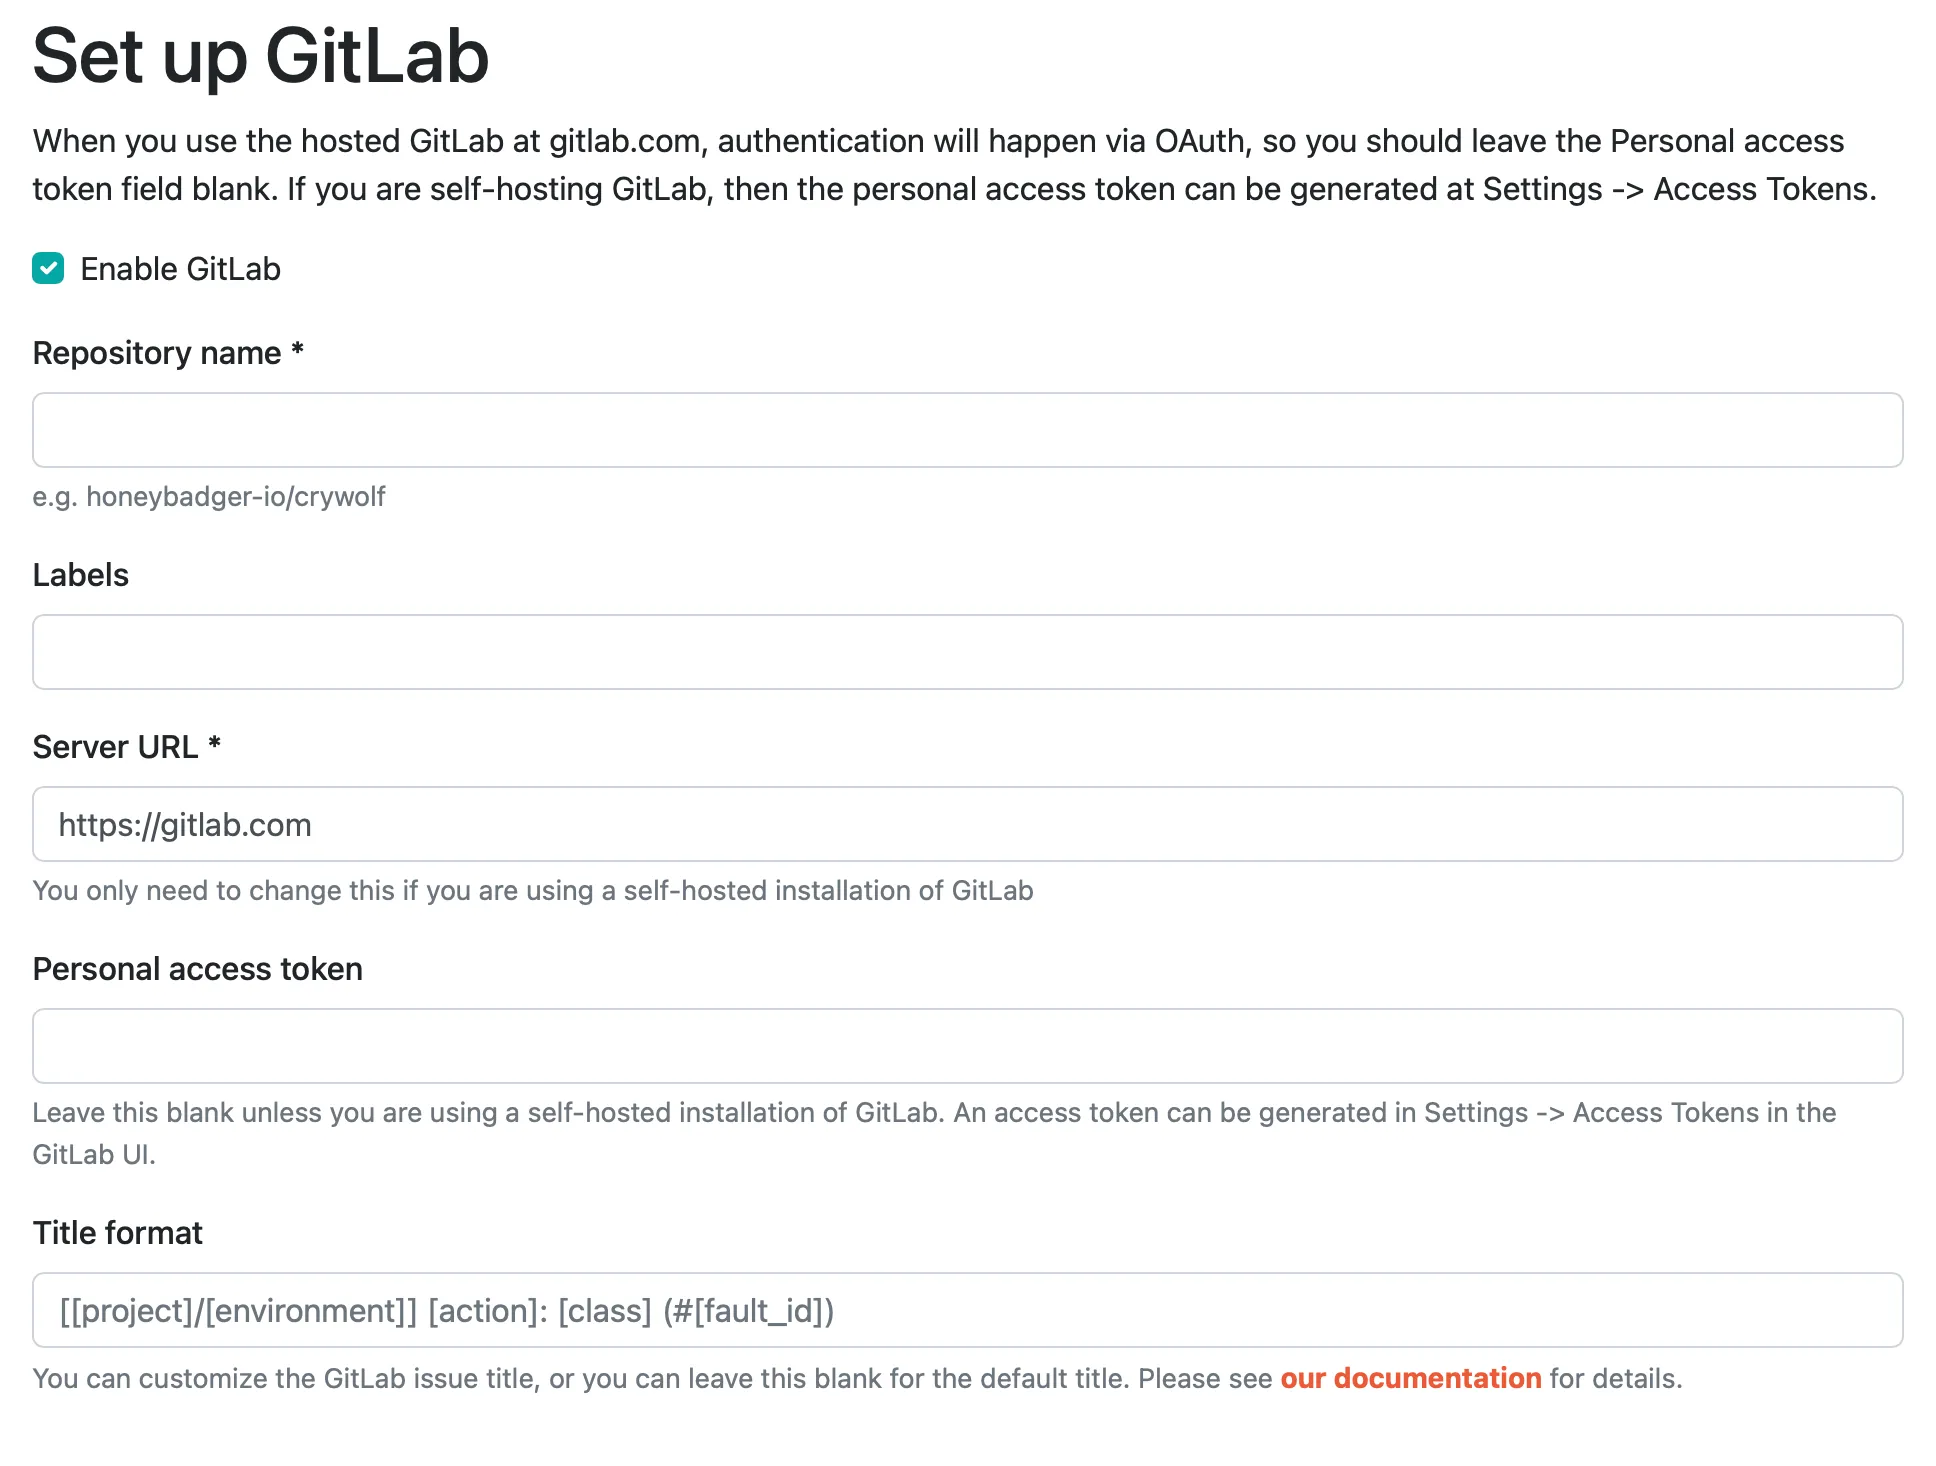 ### 2. Set the repository name [Section titled “2. Set the repository name”](#2-set-the-repository-name) The repository name includes the account or organization name. For example, if your project is hosted at , you’d enter “honeybadger-io/app” for the repo name to connect to that repository. ### 3. Enter labels (optional) [Section titled “3. Enter labels (optional)”](#3-enter-labels-optional) If you’d like us to label issues we create in GitLab, just enter a comma-separated list of tags here. ### 4. Enter server URL and personal access token (optional) [Section titled “4. Enter server URL and personal access token (optional)”](#4-enter-server-url-and-personal-access-token-optional) Our default configuration assumes you are hosting your code at gitlab.com and that we’ll use OAuth to connect to your account for creating issues. If you are using a self-hosted version of GitLab, then enter the URL of the GitLab installation and enter a personal access token. We will use that personal access token (generated in the GitLab UI at Settings -> Access Tokens) rather than OAuth. ### 5. Send a detailed issue body (optional) [Section titled “5. Send a detailed issue body (optional)”](#5-send-a-detailed-issue-body-optional) By default, Honeybadger creates GitLab issues with a short backtrace excerpt and a link back to the fault in Honeybadger. Enable **Send a detailed issue body** to instead create issues with a full Markdown body that includes context, parameters, and the backtrace. Note that enabling this sends more potentially sensitive fault data to GitLab. ### 6. Save [Section titled “6. Save”](#6-save) That’s it! You’ll be redirected to GitLab to grant OAuth access (if you left the server URL unchanged), or back to the integrations list if you used a custom server URL and a personal access token. Either way, once you’re back at the integrations list, you can Edit your new GitLab integration and use the Test button to test creating an issue in your repository.
# Google Chat
> Connect Honeybadger to Google Chat to receive real-time application monitoring alerts directly in your team's spaces.
Users with administrative privileges can find this integration below the list of personal alert integrations on the Alerts & Integrations tab of the Project Settings page. ## Setup [Section titled “Setup”](#setup) ### 1. Select the Google Hangouts Chat integration [Section titled “1. Select the Google Hangouts Chat integration”](#1-select-the-google-hangouts-chat-integration)  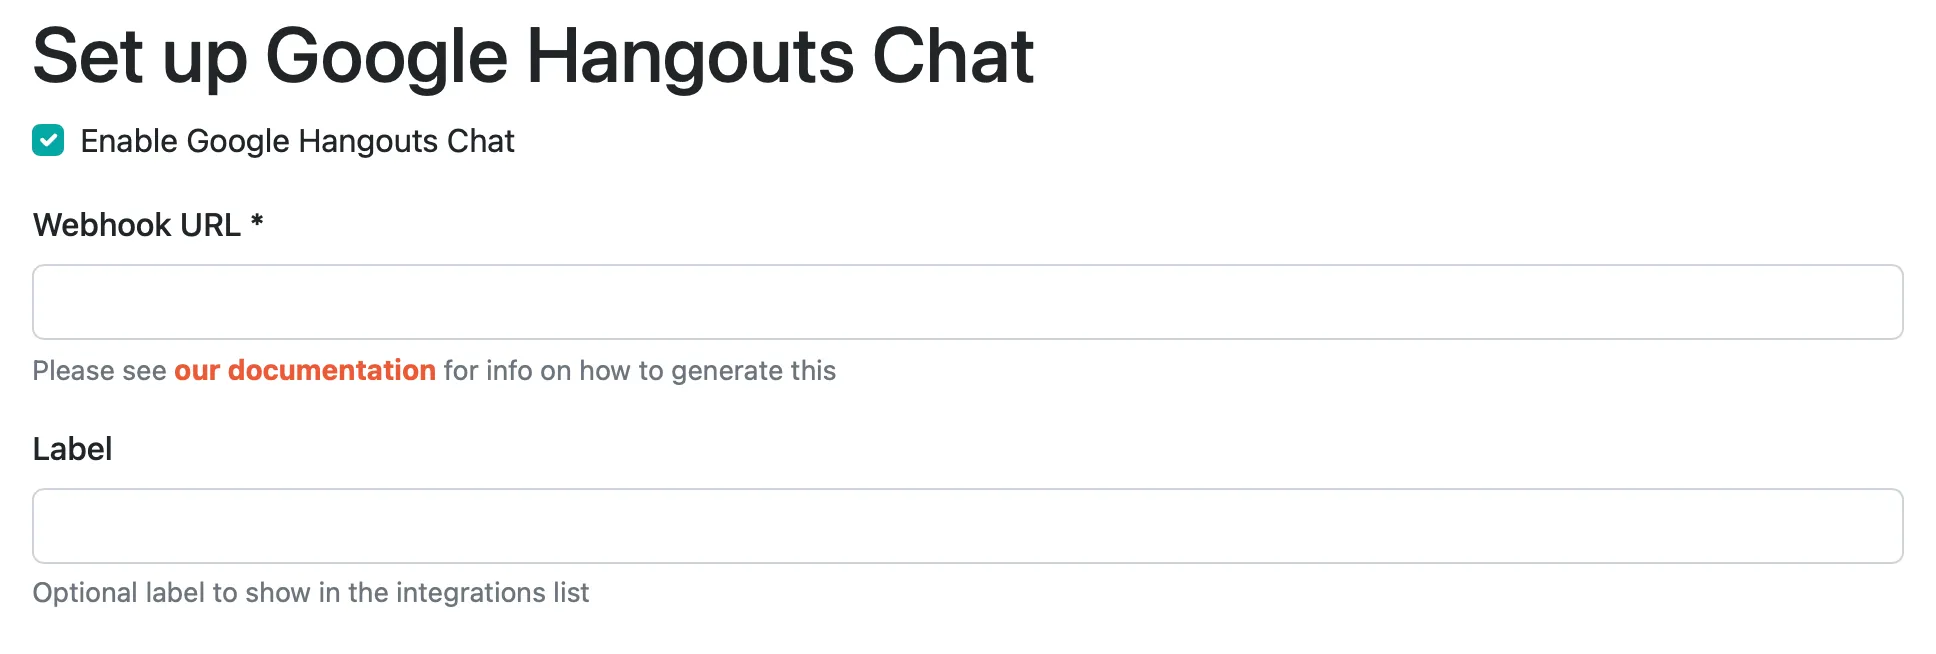 ### 2. Set the webhook URL [Section titled “2. Set the webhook URL”](#2-set-the-webhook-url) You can get the Webhook URL by clicking the channel name where you want the notifications to appear in the Hangouts Chat UI:  Choosing the “Add webhooks” option presents a popup that allows you to create a new webhook. You can enter “Honeybadger” for the name, and grab a copy of HB’s [PNG bolt logo](https://honeybadger-static.s3.amazonaws.com/brand_assets/honeybadger_bolt/honeybadger_bolt.png) from our [brand assets page](https://www.honeybadger.io/assets/) for the avatar URL. Saving the webhook generates the webhook URL:  Choose the Copy link button from the actions menu to copy the URL to your clipboard, then enter that url in channel settings in the Honeybadger UI. ### 3. Save [Section titled “3. Save”](#3-save) That’s it! You can test the integration by clicking “Test”. Otherwise, just save it and you’re ready to go. ## Honeybadger chat bot [Section titled “Honeybadger chat bot”](#honeybadger-chat-bot) If you’d like to install our chat bot in Google Hangouts Chat, search for “Honeybadger” in the “Find people, rooms, bots” search box in the Chat UI. Adding our bot in Chat will prompt you to authorize the bot’s access to your Honeybadger account. Once you do that, you’ll be able to work with your Honeybadger data from within Chat.
# ilert
> Connect Honeybadger to ilert to receive real-time alerts and manage incidents from your on-call workflow.
Users with administrative privileges can find this integration below the list of personal alert integrations on the Alerts & Integrations tab of the Project Settings page. [ilert](https://www.ilert.com/) provides alert routing, escalations, and on-call scheduling, ensuring critical issues always reach the right person at the right time. Honeybadger can send events to ilert to trigger alerts when your applications are having problems. ## Setup [Section titled “Setup”](#setup) ### 1. Select the ilert integration in Honeybadger [Section titled “1. Select the ilert integration in Honeybadger”](#1-select-the-ilert-integration-in-honeybadger)   ### 2. Create a Honeybadger alert source in ilert [Section titled “2. Create a Honeybadger alert source in ilert”](#2-create-a-honeybadger-alert-source-in-ilert) Follow ilert’s instructions to [create a new alert source for Honeybadger](https://docs.ilert.com/inbound-integrations/honeybadger), and copy the “Honeybadger URL” from the integration settings page. ### 3. Copy/paste the webhook URL from ilert into Honeybadger [Section titled “3. Copy/paste the webhook URL from ilert into Honeybadger”](#3-copypaste-the-webhook-url-from-ilert-into-honeybadger) Copy and paste the “Honeybadger URL” from the integration settings page in ilert into the “URL” field in Honeybadger. ### 4. Save [Section titled “4. Save”](#4-save) That’s it! You can test the integration by clicking “Test.” Otherwise, just save it and you’re ready to go.
# incident.io
> Connect Honeybadger to incident.io to automatically create incidents from critical errors and manage your response process.
Users with administrative privileges can find this integration below the list of personal alert integrations on the Alerts & Integrations tab of the Project Settings page. ## Setup [Section titled “Setup”](#setup) ### 1. Create an API key in incident.io. [Section titled “1. Create an API key in incident.io.”](#1-create-an-api-key-in-incidentio) From your incident.io dashboard, go to Settings > API keys > Add new. Create an API key with the following permissions: * Create incidents * Edit incidents * Create and manage on-call resources  Make sure to copy the generated token. ### 2. In Honeybadger, locate the incident.io integration. [Section titled “2. In Honeybadger, locate the incident.io integration.”](#2-in-honeybadger-locate-the-incidentio-integration) In the project settings, click on the **Integrations** tab where you’ll find the incident.io integration.  ### 3. Fill in the required fields and save. [Section titled “3. Fill in the required fields and save.”](#3-fill-in-the-required-fields-and-save) Fill in API key field with the generated token from step 1 and then specify the alert source label. This will create an alert source in your incident.io account. ### 4. Test the integration. [Section titled “4. Test the integration.”](#4-test-the-integration) Click on the “Test this integration” button to send a test notification to your incident.io account. This is a great way to ensure that everything is set up correctly before you start receiving real notifications. 
# Instatus
> Connect Honeybadger to Instatus to automatically update your status page when critical errors and application issues are detected.
Users with administrative privileges can find this integration below the list of personal alert integrations on the Alerts & Integrations tab of the Project Settings page. ## Setup [Section titled “Setup”](#setup) ### 1. Select the Instatus integration [Section titled “1. Select the Instatus integration”](#1-select-the-instatus-integration)   ### 2. Set the webhook URL [Section titled “2. Set the webhook URL”](#2-set-the-webhook-url) Go to Instatus dashboard, under Monitors, select Custom service (webhook). Copy your component’s webhook URL, and then enter that URL into the Webhook URL field in the Honeybadger UI. ### 3. Save [Section titled “3. Save”](#3-save) That’s it! You can test the integration by clicking “Test”. Otherwise, just save it and you’re ready to go.
# Intercom
> Connect Honeybadger to Intercom to track errors affecting specific users and provide better customer support.
## Setup [Section titled “Setup”](#setup) ### 1. Select the Intercom integration [Section titled “1. Select the Intercom integration”](#1-select-the-intercom-integration)   ### 2. Enter your context field [Section titled “2. Enter your context field”](#2-enter-your-context-field) This is the field that you set in the context in your application with the user ID that is associated with your Intercom users. For example, if you are identifying users with Intercom with `current_user.id`, and you have `current_user.id` in the `user_id` field of your context, then enter `user_id` in this field. ### 3. Connect via OAuth [Section titled “3. Connect via OAuth”](#3-connect-via-oauth) Select the “Connect OAuth” button and give access to our app. ### 4. Save [Section titled “4. Save”](#4-save) That’s it! You can test the integration by clicking “Test”. Otherwise, just save it and you’re ready to go. ## What gets sent to Intercom [Section titled “What gets sent to Intercom”](#what-gets-sent-to-intercom) When an error occurs, Honeybadger sends an event for the affected user with the following payload: | Field | Value | | ------------ | --------------------------------------------------------- | | `event_name` | `encountered-error` | | `user_id` | The value from your configured context field (see step 2) | | `created_at` | Unix timestamp in seconds since the epoch (UTC) | | `metadata` | `{ "url": "" }` | You can use this event in Intercom to build segments (e.g. “users who hit an error in the last 7 days”) or to drive a Workflow that sets a custom attribute on the user; for example, flipping a `has_honeybadger_error` attribute to `true` whenever the event fires.
# Jira & Jira Cloud
> Connect Honeybadger to Jira to automatically create tickets from errors and track bug fixes in your project workflow.
Users with administrative privileges can find this integration below the list of personal alert integrations on the Alerts & Integrations tab of the Project Settings page. We currently have two different service integrations for Jira. Both versions provide the same features, but differ in the way they authenticate requests. ## Which integration to choose? [Section titled “Which integration to choose?”](#which-integration-to-choose) If you are running a Jira Server, then the original [Jira](#jira) Integration is your only option. You *may also* use this integration for Jira Cloud, but we don’t recommend it as it uses Basic Authentication which requires storing credentials to make a API request. If you are using Jira Cloud, then we highly recommend the newer [Jira Cloud](#jira-cloud) integration as this uses OAuth and only requires us to keep a token for authentication. ## Jira [Section titled “Jira”](#jira) ### 1. Select the Jira integration [Section titled “1. Select the Jira integration”](#1-select-the-jira-integration)  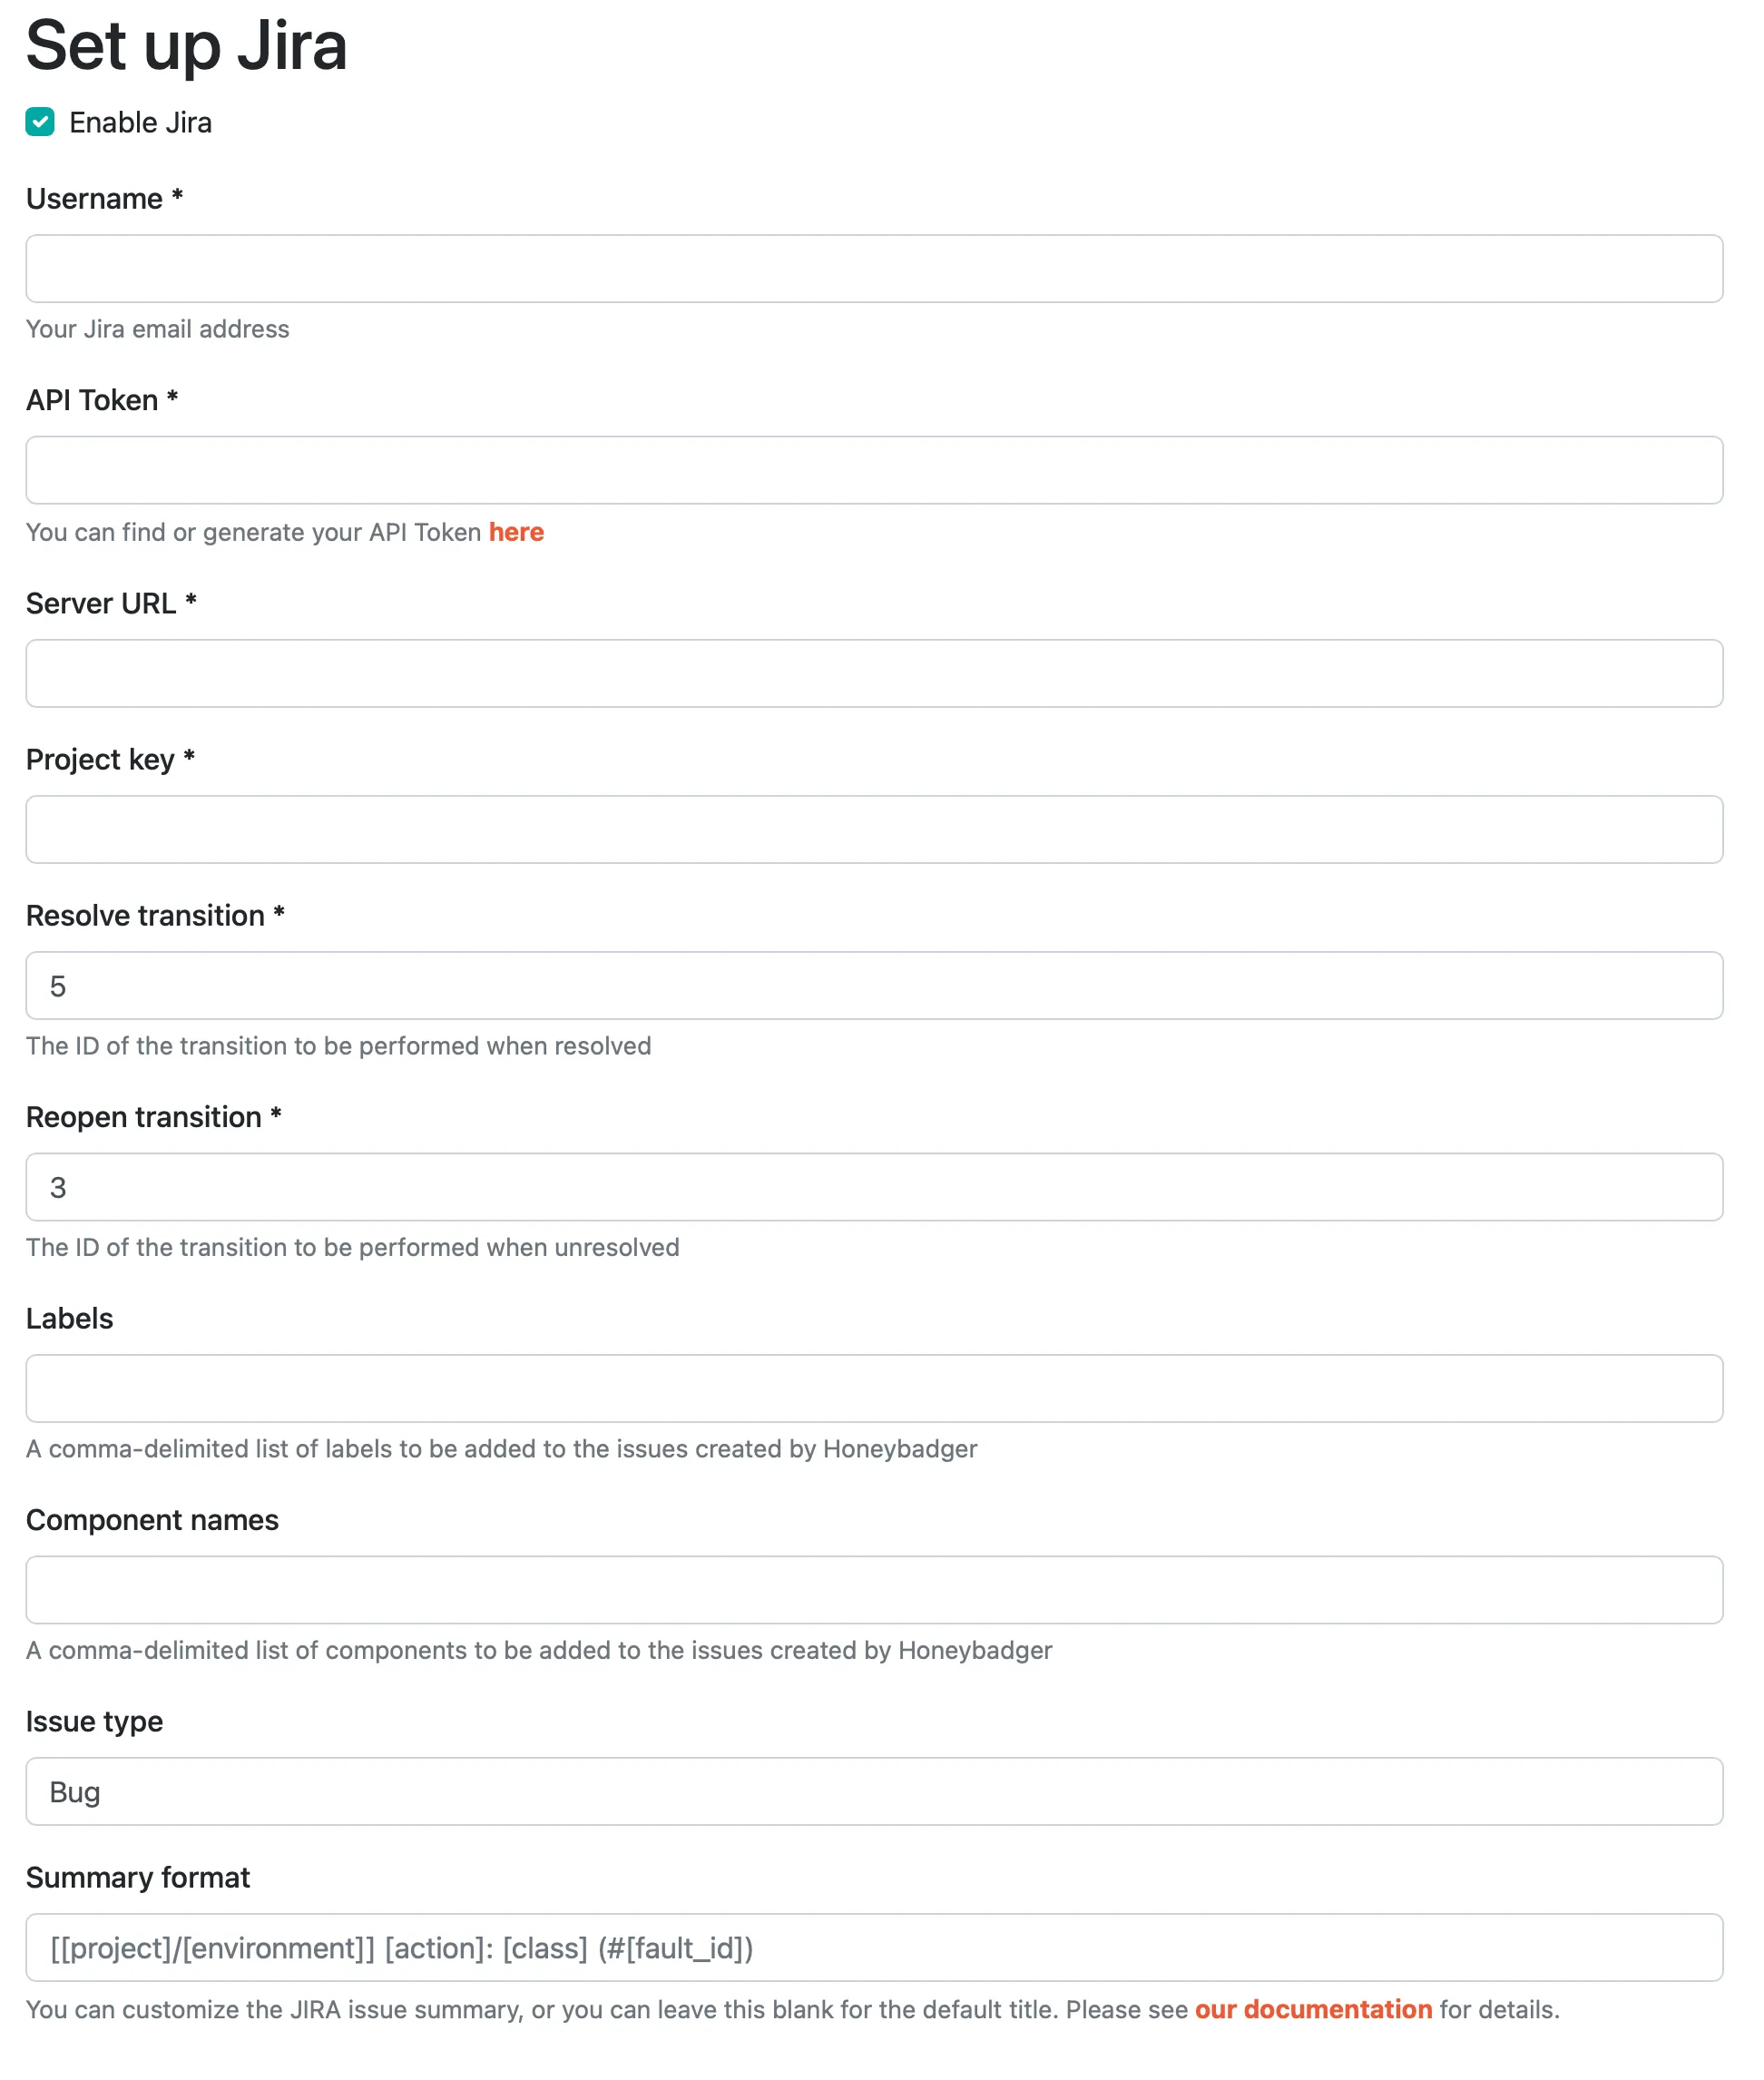 ### 2. Configure [Section titled “2. Configure”](#2-configure) Here’s an overview of the options: * The **username** and **password** will be your login for Jira. * The **server url** is the subdomain of your Jira instance, such as “”. Don’t forget the “https\://”. * The **project key** was setup when you created the project. It can be found (on Jira) from Project Overview > Administration > Edit Project. * The **transition** ID’s can be set in your workflows on Jira when viewed in text mode. ID’s are unique, so make sure there are no conflicting values. * **Send a detailed issue description** controls how much fault data is included in new issues. By default, Honeybadger sends a short backtrace excerpt and a link back to the fault in Honeybadger. Enable this option to instead send a detailed Jira-wiki description that includes context, parameters, and the backtrace. Note that enabling this sends more potentially sensitive fault data to Jira. ### 3. Save [Section titled “3. Save”](#3-save) That’s it! You can test the integration by clicking “Test”. Otherwise, just save it and you’re ready to go. ## Jira Cloud [Section titled “Jira Cloud”](#jira-cloud) ### 1. Select the Jira Cloud integration [Section titled “1. Select the Jira Cloud integration”](#1-select-the-jira-cloud-integration)   ### 2. Configure [Section titled “2. Configure”](#2-configure-1) Here’s an overview of the options: * The **project key** was setup when you created the project. It can be found (on Jira) from Project Overview > Administration > Edit Project. * The **transition** ID’s can be set in your workflows on Jira when viewed in text mode. ID’s are unique, so make sure there are no conflicting values. * **Send a detailed issue description** controls how much fault data is included in new issues. By default, Honeybadger sends a short backtrace excerpt and a link back to the fault in Honeybadger. Enable this option to instead send a detailed Jira-wiki description that includes context, parameters, and the backtrace. Note that enabling this sends more potentially sensitive fault data to Jira. ### 3. Save [Section titled “3. Save”](#3-save-1) Click “Save” to be sent to Atlassian to authorize our Honeybadger App. That’s it! Once we have an OAuth connection to your instance you can test the integration clicking “Test”.
# Linear
> Connect Honeybadger to Linear to automatically create issues from errors and track bug fixes in your project workflow.
Users with administrative privileges can find this integration below the list of personal alert integrations on the Alerts & Integrations tab of the Project Settings page. ## Setup [Section titled “Setup”](#setup) ### 1. Select the Linear integration [Section titled “1. Select the Linear integration”](#1-select-the-linear-integration)  ### 2. Connect via OAuth [Section titled “2. Connect via OAuth”](#2-connect-via-oauth) An OAuth dialog should appear. Log in to your account, and give access to our app. 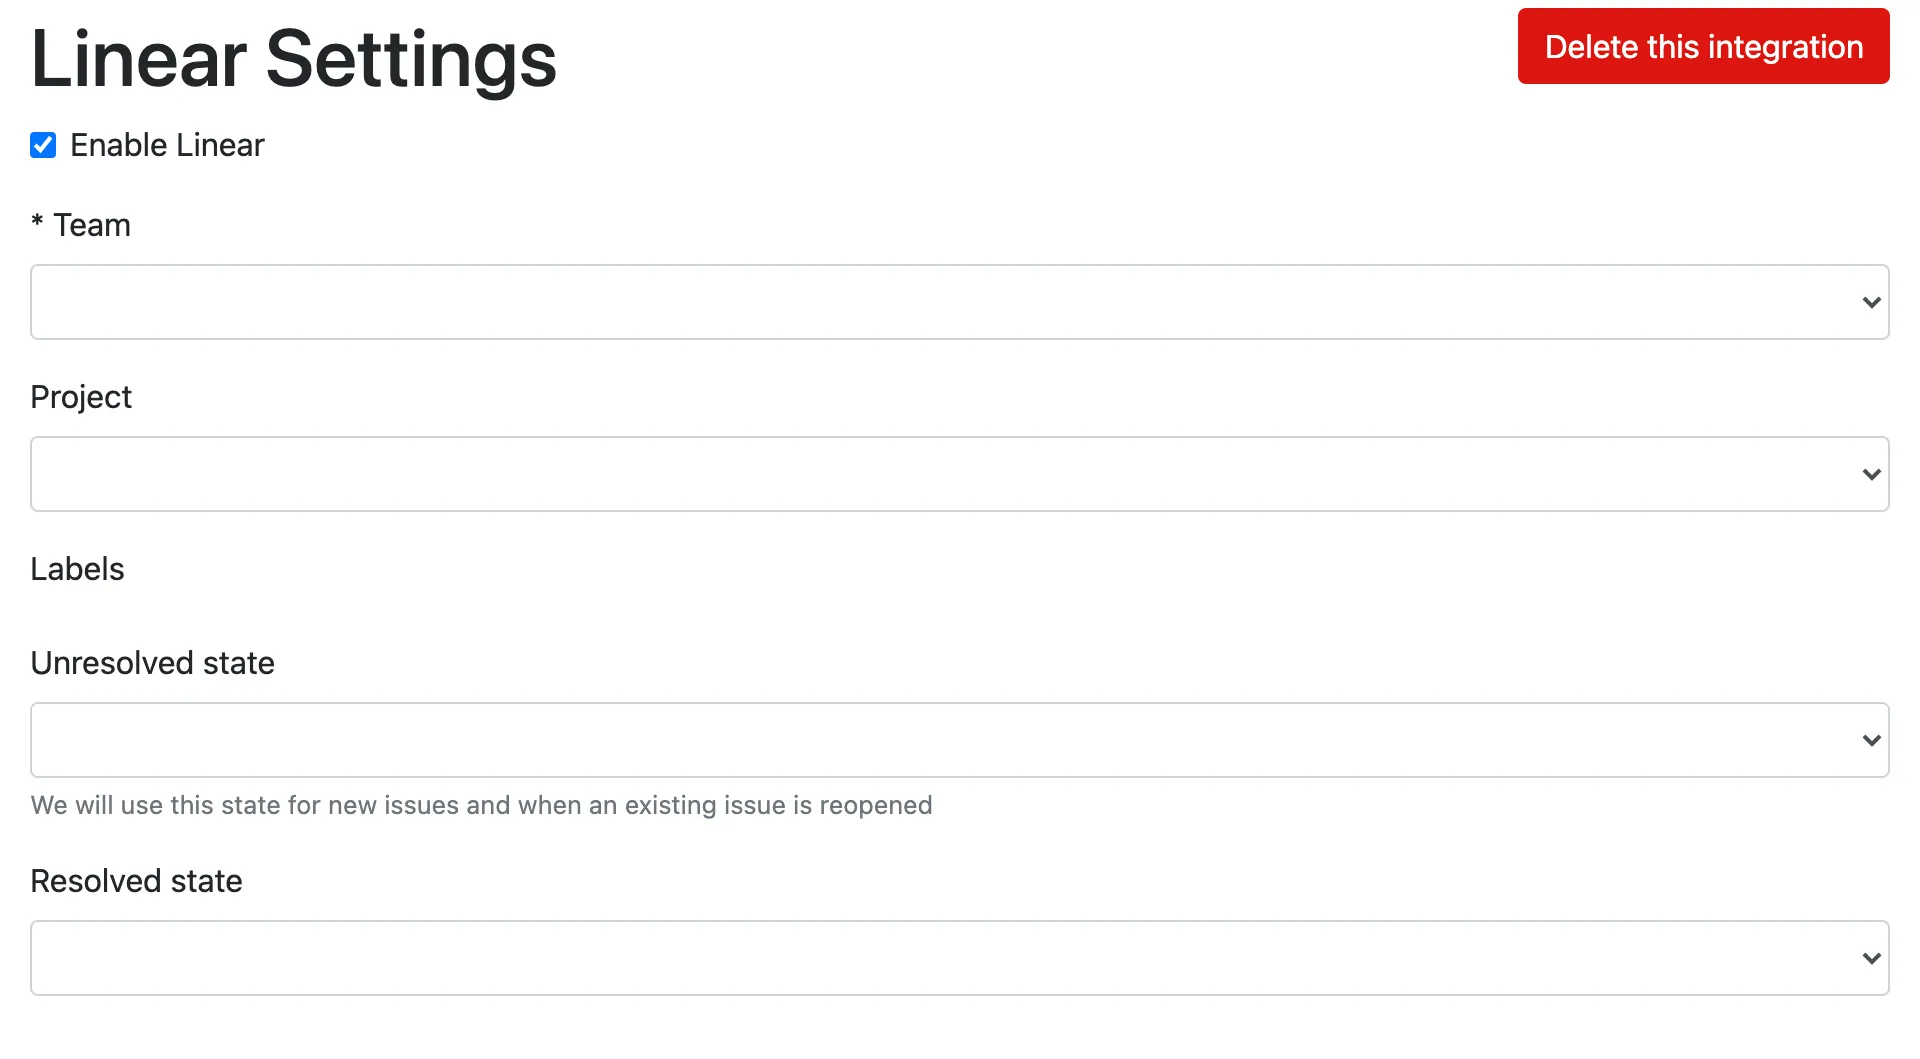 ### 3. Select team [Section titled “3. Select team”](#3-select-team) We gathered all teams associated with your account. Select the team you want to integrate with. ### 4. Project & labels (optional) [Section titled “4. Project & labels (optional)”](#4-project--labels-optional) We can associate a project or any labels when we create your issue. ### 5. Unresolved state [Section titled “5. Unresolved state”](#5-unresolved-state) This is both the initial and the state that we transition your issue back to if it is reopened. ### 6. Resolved state [Section titled “6. Resolved state”](#6-resolved-state) The issue state for resolved errors. ### 7. Save [Section titled “7. Save”](#7-save) That’s it! You can test the integration by clicking “Test”. Otherwise, just save it and you’re ready to go.
# Mattermost
> Connect Honeybadger to Mattermost to receive real-time application monitoring alerts directly in your team's chat channels.
Users with administrative privileges can find this integration below the list of personal alert integrations on the Alerts & Integrations tab of the Project Settings page. ## Setup [Section titled “Setup”](#setup) ### 1. Select the Mattermost integration [Section titled “1. Select the Mattermost integration”](#1-select-the-mattermost-integration)  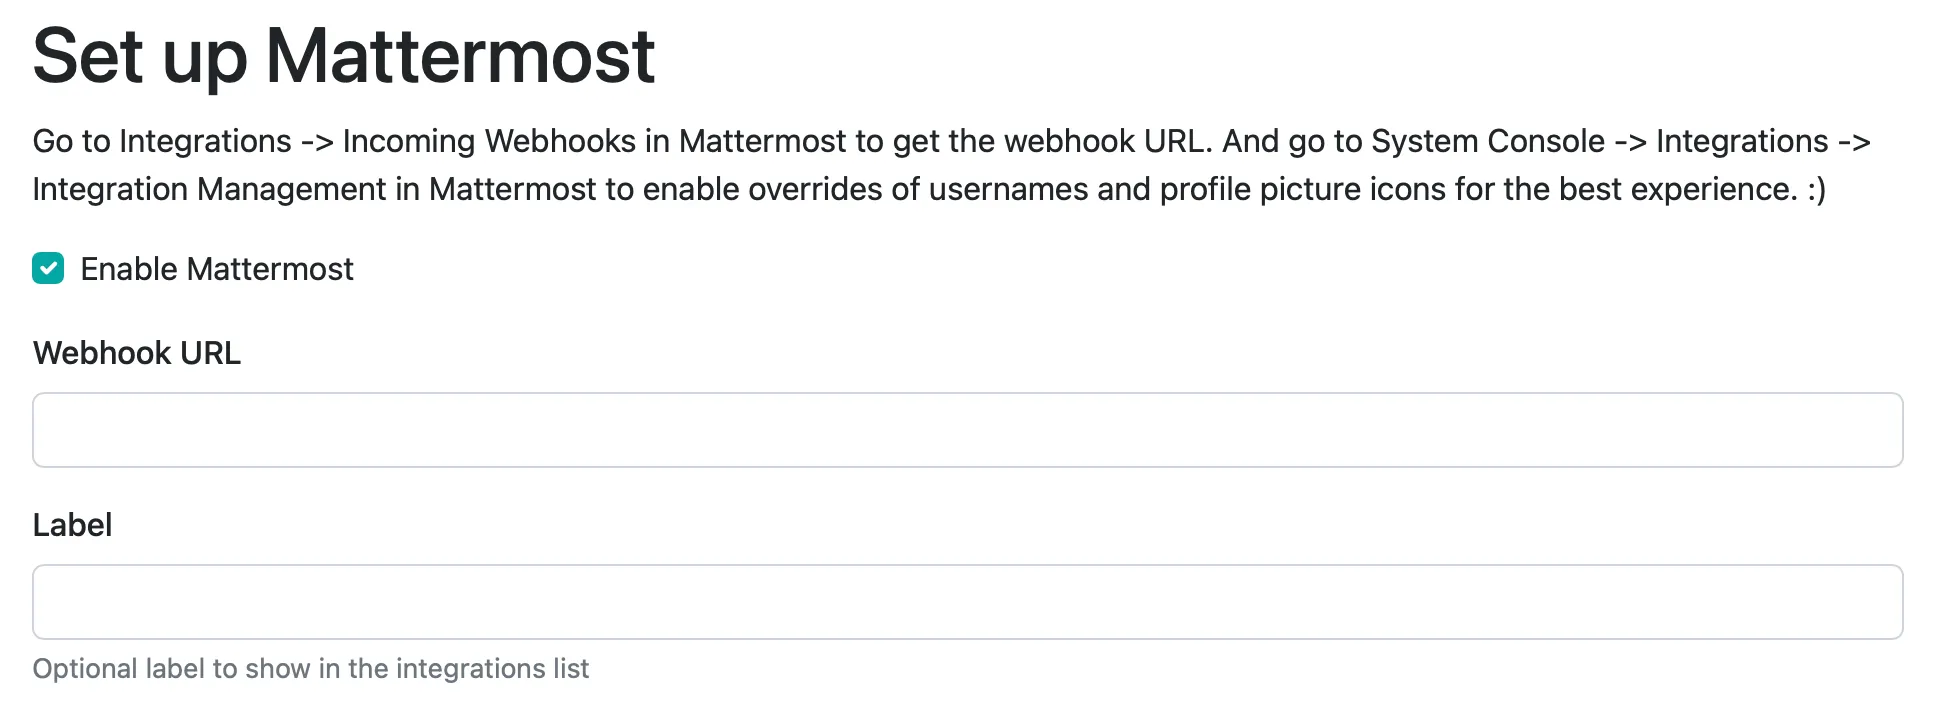 ### 2. Set the webhook URL [Section titled “2. Set the webhook URL”](#2-set-the-webhook-url) Choose Integrations from the Mattermost sidebar menu, then Incoming Webhooks, and click the “Add Incoming Webhook” button. Enter the options you want, then save the new webhook. Copy the URL displayed on the next page, and then enter that URL into the Webhook URL field in the Honeybadger UI. ### 3. Save [Section titled “3. Save”](#3-save) That’s it! You can test the integration by clicking “Test”. Otherwise, just save it and you’re ready to go.
# Microsoft Teams
> Connect Honeybadger to Microsoft Teams to receive real-time application monitoring alerts in your team collaboration workspace.
Users with administrative privileges can find this integration below the list of personal alert integrations on the Alerts & Integrations tab of the Project Settings page. ## Setup [Section titled “Setup”](#setup) ### 1. Select the Microsoft Teams integration [Section titled “1. Select the Microsoft Teams integration”](#1-select-the-microsoft-teams-integration)  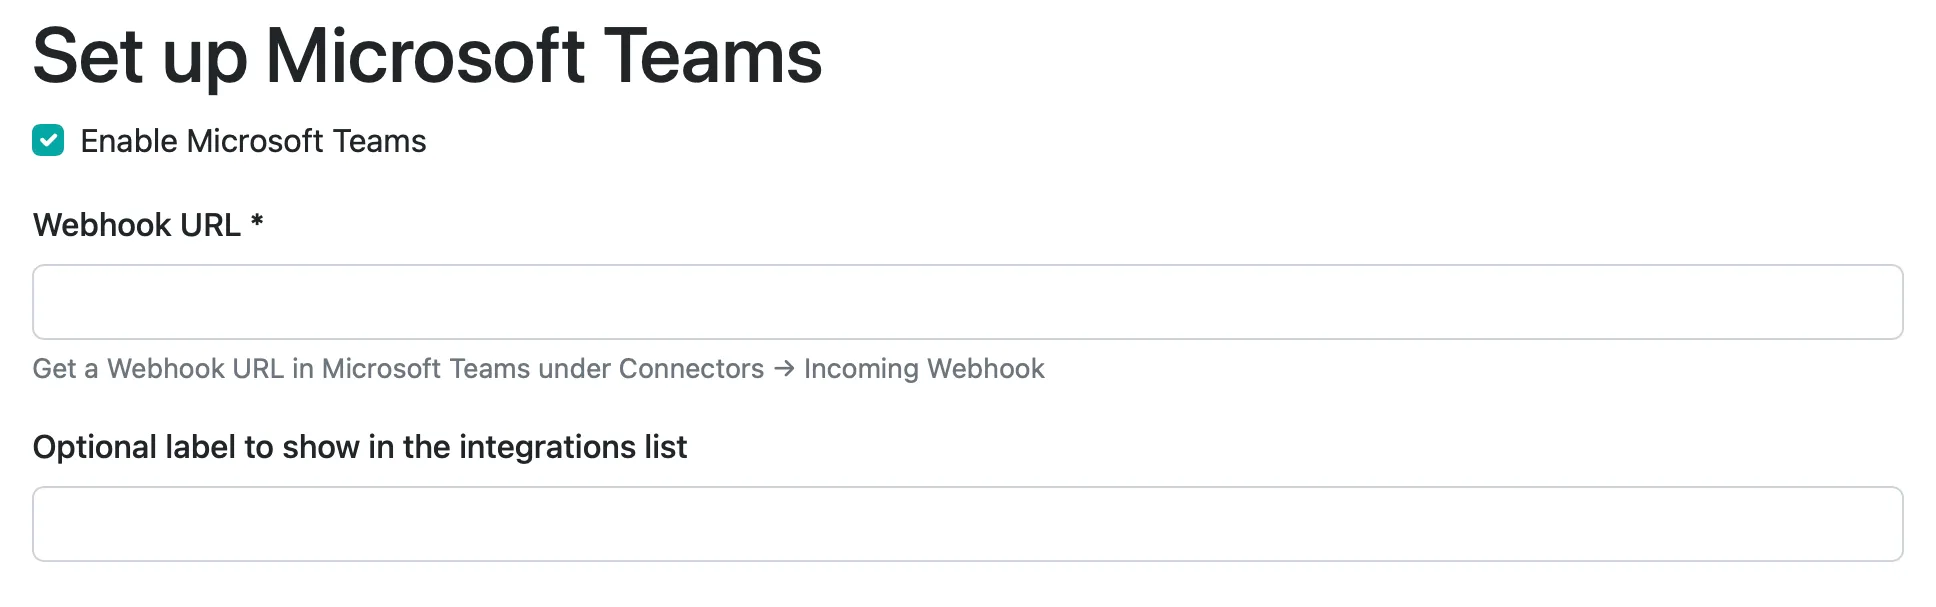 ### 2. Set the webhook URL [Section titled “2. Set the webhook URL”](#2-set-the-webhook-url) Choose Connectors from the popup channel menu, then Incoming Webhook, and click “Configure” or “Add”. Enter the options you want, then save the new webhook. Copy the provided URL, and then enter that URL into the Webhook URL field in the Honeybadger UI. ### 3. Save [Section titled “3. Save”](#3-save) That’s it! You can test the integration by clicking “Test”. Otherwise, just save it and you’re ready to go.
# OpsGenie
> Connect Honeybadger to OpsGenie to route critical errors and application issues through your incident management and on-call alerting system.
Users with administrative privileges can find this integration below the list of personal alert integrations on the Alerts & Integrations tab of the Project Settings page. ## Setup [Section titled “Setup”](#setup) ### 1. Select the OpsGenie integration [Section titled “1. Select the OpsGenie integration”](#1-select-the-opsgenie-integration)  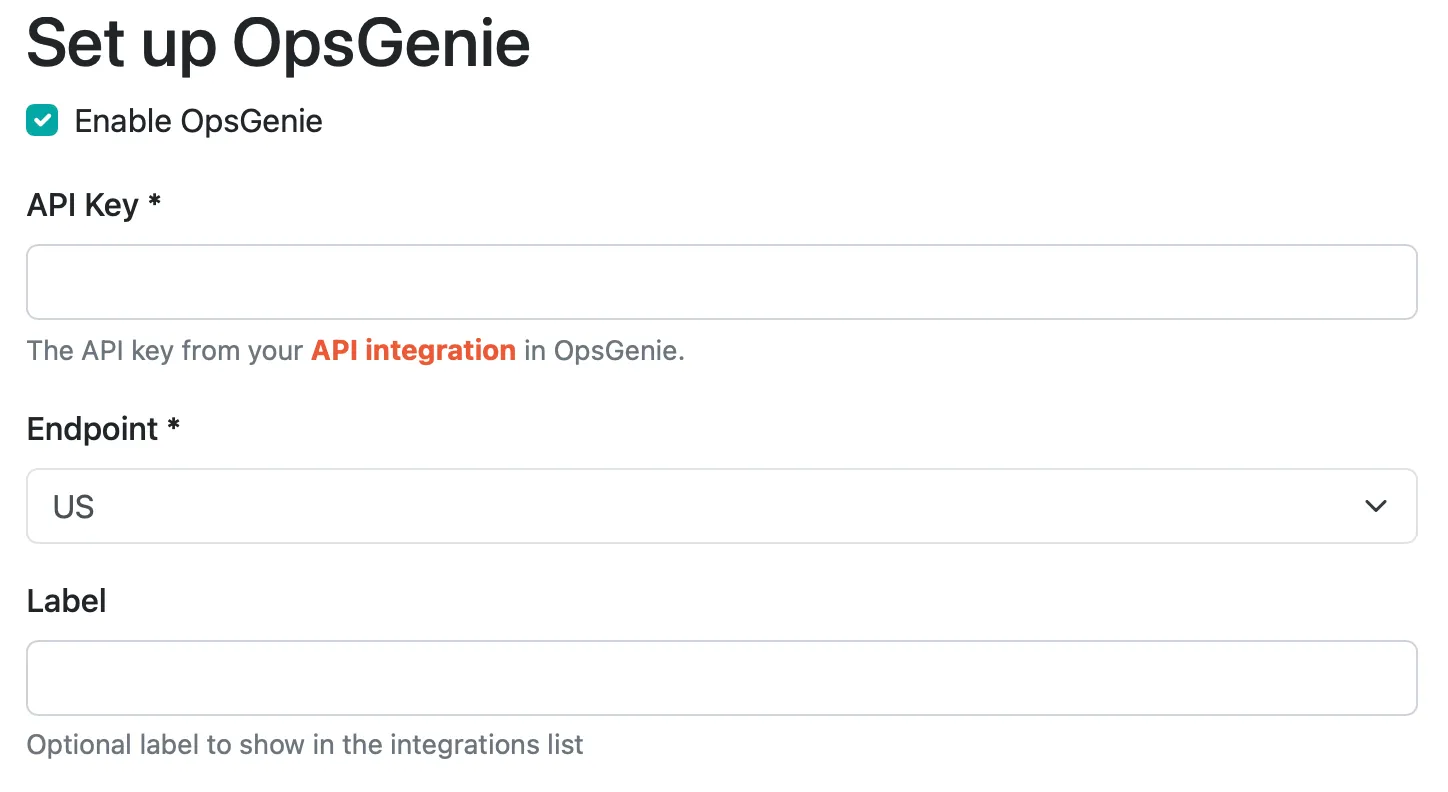 ### 2. Set the API key [Section titled “2. Set the API key”](#2-set-the-api-key) Caution Please note that the OpsGenie integration labeled “Honeybadger” is an older version that doesn’t currently support all the events we send. You can generate a OpsGenie API key by creating an [API Integration](https://support.atlassian.com/opsgenie/docs/create-a-default-api-integration/) by logging in to OpsGenie then going to Settings - Integrations and selecting “API”.  ### 3. Select region [Section titled “3. Select region”](#3-select-region) We can send to both US and EU regions. ### 4. Select label (optional) [Section titled “4. Select label (optional)”](#4-select-label-optional) If you have multiple OpsGenie integrations, you can add a label to differentiate in the integration list view. ### 5. Save [Section titled “5. Save”](#5-save) That’s it! You can test the integration by clicking “Test”. Otherwise, just save it and you’re ready to go. ## Configuring OpsGenie alerts [Section titled “Configuring OpsGenie alerts”](#configuring-opsgenie-alerts) OpsGenie provides the option to route the alerts based on the kind of event that is reported to OpsGenie, and elements from the event payloads can be used in the alert rules. For example, when a check-in fails to report on time, Honeybadger will send the “Check-In Missing” event to OpsGenie. You can use the **Details (key-value)** condition to match that event by specifying “Event” as the **Key** and “Check-In Missing” as the **Value**: 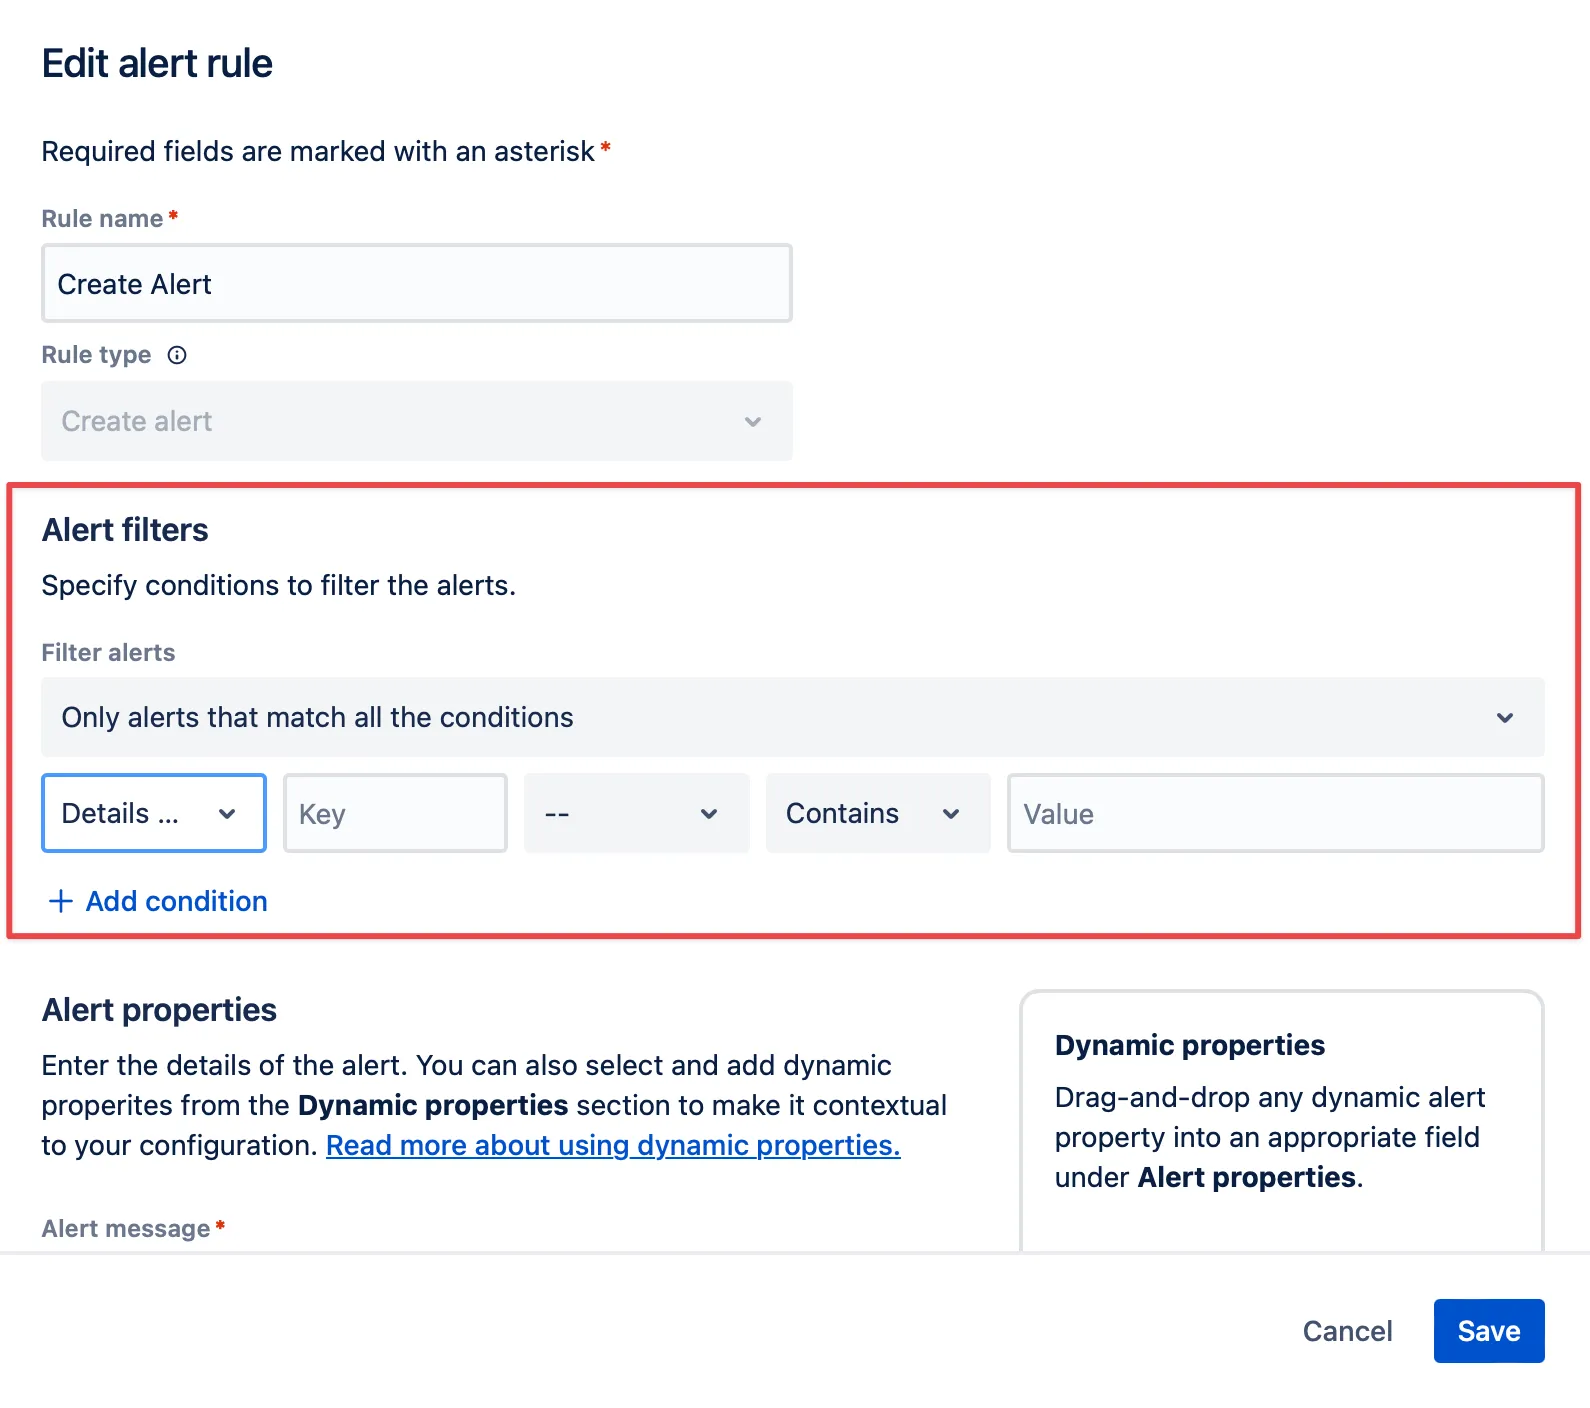 ## Event Payloads [Section titled “Event Payloads”](#event-payloads) The following events are supported by the OpsGenie integration: ### `Assigned` [Section titled “Assigned”](#assigned) Sent when an error is assigned to a user. **Additional Details keys:** `Error Details`, `Project`, `Environment`, `Assignee Name`, `Assignee Email` ### `Cert Will Expire` [Section titled “Cert Will Expire”](#cert-will-expire) Sent when an SSL certificate is about to expire. **Additional Details keys:** `Project`, `Name`, `URL` ### `Check-In Missing` [Section titled “Check-In Missing”](#check-in-missing) Sent when an expected check-in is missing. **Additional Details keys:** `Check-In Details`, `Project`, `Name` ### `Check-In Reporting` [Section titled “Check-In Reporting”](#check-in-reporting) Sent when a check-in reports successfully. **Additional Details keys:** `Check-In Details`, `Project`, `Name` ### `Commented` [Section titled “Commented”](#commented) Sent when a comment is added to an error. **Additional Details keys:** `Error Details`, `Project`, `Environment`, `Author` ### `Deployed` [Section titled “Deployed”](#deployed) Sent when a deployment is recorded. **Additional Details keys:** `Project`, `Environment`, `Revision`, `Repository` ### `Down` [Section titled “Down”](#down) Sent when an uptime check fails. **Additional Details keys:** `Outage Details`, `Project`, `Name`, `URL` ### `Occurred` [Section titled “Occurred”](#occurred) Sent when an error occurs. **Additional Details keys:** `Error Details`, `Project`, `Environment` ### `Rate Exceeded` [Section titled “Rate Exceeded”](#rate-exceeded) Sent when error rate threshold is exceeded. **Additional Details keys:** `Error Details`, `Project`, `Environment` ### `Resolved` [Section titled “Resolved”](#resolved) Sent when an error is marked as resolved. **Additional Details keys:** `Error Details`, `Project`, `Environment` ### `Unresolved` [Section titled “Unresolved”](#unresolved) Sent when a resolved error occurs again. **Additional Details keys:** `Error Details`, `Project`, `Environment` ### `Up` [Section titled “Up”](#up) Sent when an uptime check succeeds after being down. **Additional Details keys:** `Outage Details`, `Project`, `Name`, `URL`
# PagerDuty
> Connect Honeybadger to PagerDuty to route critical errors and application issues through your incident response workflow and on-call schedules.
Users with administrative privileges can find this integration below the list of personal alert integrations on the Alerts & Integrations tab of the Project Settings page. ## Setup [Section titled “Setup”](#setup) ### 1. Select the PagerDuty integration [Section titled “1. Select the PagerDuty integration”](#1-select-the-pagerduty-integration)  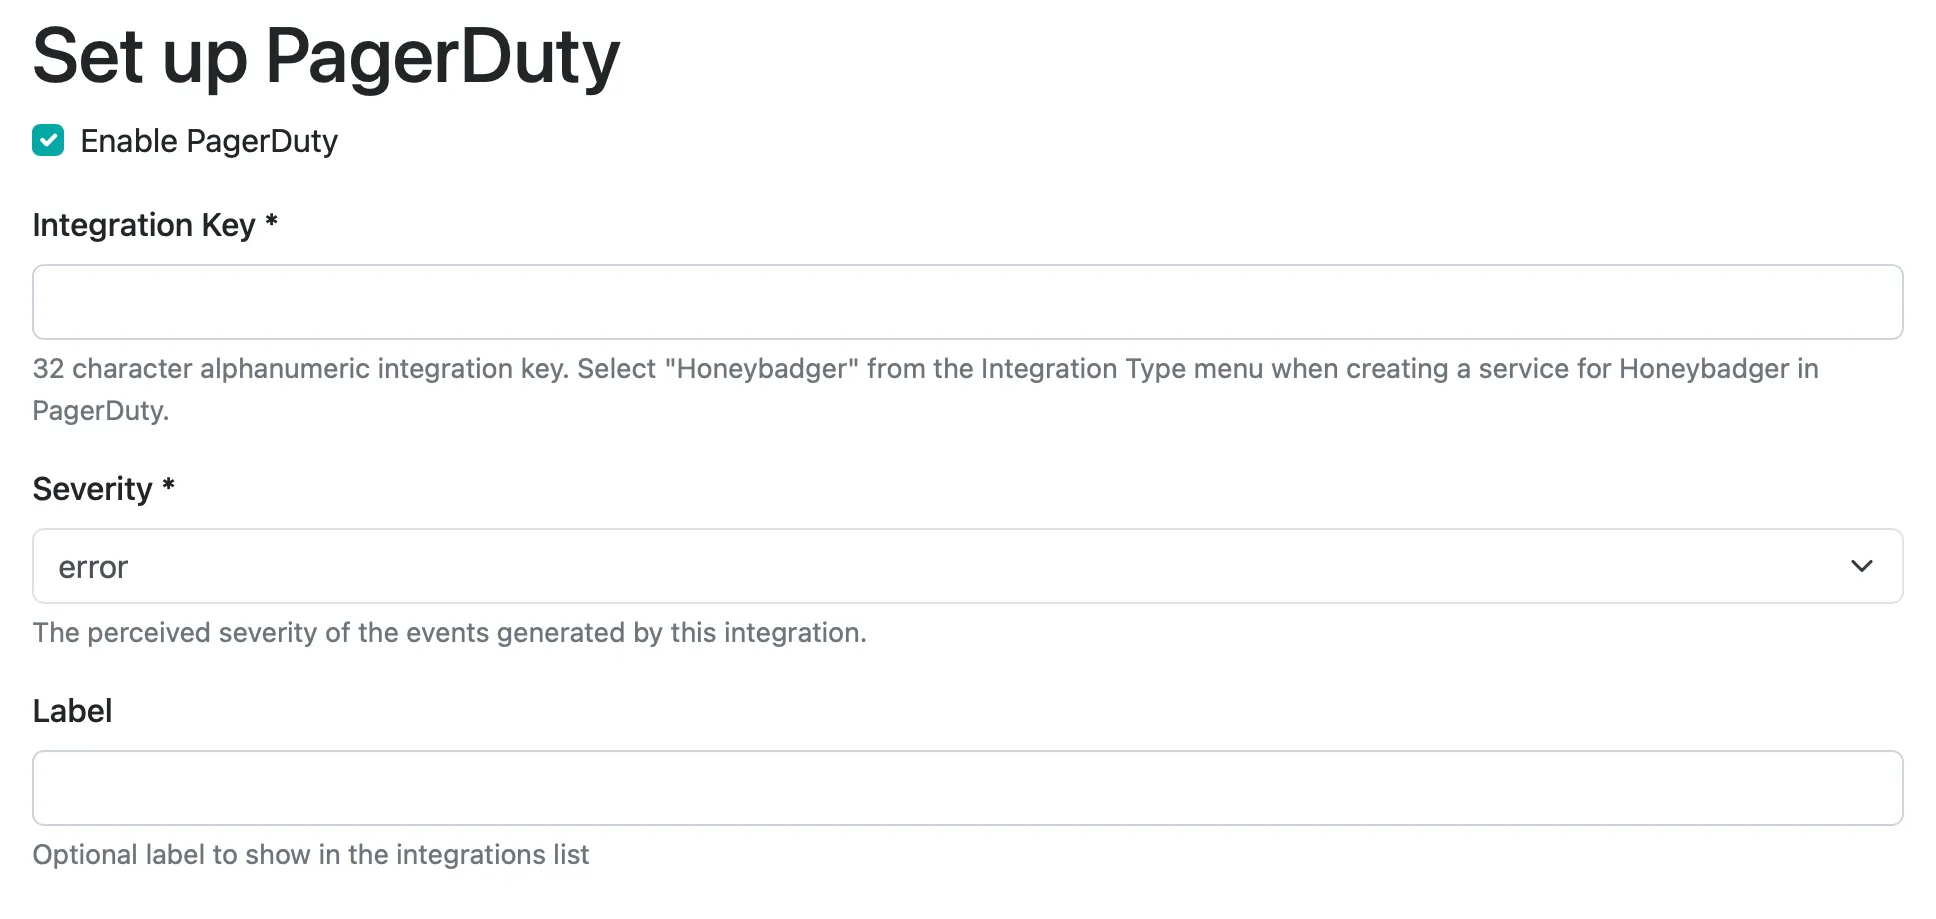 ### 2. Set the API key [Section titled “2. Set the API key”](#2-set-the-api-key) You can generate an integration key for Honeybadger by logging in to PagerDuty then clicking on “Add New Service” and choosing “Honeybadger” as the service type. [Here’s a walkthrough](https://www.pagerduty.com/docs/guides/honeybadger-integration-guide/). ### 3. Save [Section titled “3. Save”](#3-save) That’s it! You can test the integration by clicking “Test”. Otherwise, just save it and you’re ready to go. ## Event rules in PagerDuty [Section titled “Event rules in PagerDuty”](#event-rules-in-pagerduty) You can use PagerDuty’s [event rules](https://support.pagerduty.com/docs/event-management#section-suppression-and-event-rules) feature to suppress an event or change its severity based on data sent from Honeybadger. For instance, when an exception is sent to PagerDuty, you could set the severity to “critical” for a specific environment when `fault.environment` equals “production”. The custom data payloads sent from Honeybadger are the same as our [webhook event payloads](/guides/integrations/webhook/#event-payloads). ## Upgrading a legacy PagerDuty integration [Section titled “Upgrading a legacy PagerDuty integration”](#upgrading-a-legacy-pagerduty-integration) If your integration is marked “legacy”, then you should upgrade by deleting your existing integration and then creating a new integration following the instructions above. If you use Event Rules in PagerDuty, see the next paragraph. The custom data payload sent to PagerDuty has changed to match our [webhook event payloads](/guides/integrations/webhook/#event-payloads). If you use [event rules in PagerDuty](#event-rules-in-pagerduty) based on the old payload, you will need to update your rules.
# PagerTree
> Connect Honeybadger to PagerTree to route critical errors and application issues through your incident management and on-call system.
Users with administrative privileges can find this integration below the list of personal alert integrations on the Alerts & Integrations tab of the Project Settings page. ## Setup [Section titled “Setup”](#setup) ### 1. Select the PagerTree integration [Section titled “1. Select the PagerTree integration”](#1-select-the-pagertree-integration)   ### 2. Set the integration URL [Section titled “2. Set the integration URL”](#2-set-the-integration-url) Follow the steps outlined in the [PagerTree documentation](https://pagertree.com/knowledge-base/integration-honeybadger/) to get the Endpoint URL. Enter that URL into the URL field in the Honeybadger UI. ### 3. Save [Section titled “3. Save”](#3-save) That’s it! You can test the integration by clicking “Test”. Otherwise, just save it and you’re ready to go.
# Error assigned event payload
> Sent when an error is assigned to a user.
Sent when an error is assigned to a user.
```json
{
"event": "assigned",
"message": "[Testy McTestFace/production] ActiveRecord::StatementInvalid assigned to George Jetson by Ben",
"actor": {
"id": 1,
"email": "ben@example.com",
"name": "Ben"
},
"fault": {
"project_id": 123321,
"klass": "ActiveRecord::StatementInvalid",
"component": "search",
"action": "index",
"environment": "production",
"resolved": true,
"ignored": false,
"created_at": "2023-01-31T03:10:01.126549Z",
"comments_count": 3,
"message": "PG::SyntaxError: ERROR: syntax error in tsquery: \"厄瓜多尔Google霸屏【TG飞机:@bapingseo】腾讯视频谷歌完全无广告版【TG飞机:@bapingseo】不到外贸行业运营推广计划怎么写谷歌相机的广告怎么关掉?Em0atRS3g3F4.html\"",
"notices_count": 5514,
"last_notice_at": "2023-02-06T12:20:01.772130Z",
"tags": [],
"id": 42,
"assignee": "george@example.com",
"url": "https://app.honeybadger.io/projects/123321/faults/42",
"deploy": {
"environment": "production",
"revision": "dd2ce1c1f5be3532e10fadf2224a19847f0c62e9",
"repository": "https://github.com/spacely/testy-mctestface",
"local_username": "heroku-redis@addons.heroku.com",
"created_at": "2023-02-01T05:12:31.417405Z",
"changelog": [],
"url": "https://github.com/spacely/testy-mctestface/compare/3e51742fd5f43197891a67b74a54903513e59ce5...dd2ce1c1f5be3532e10fadf2224a19847f0c62e9"
}
},
"assignee": {
"id": 99,
"email": "george@example.com",
"name": "George Jetson"
}
}
```
# Certificate expiration event payload
> Sent when an SSL certificate is about to expire.
Sent when an SSL certificate is about to expire.
```json
{
"event": "cert_will_expire",
"message": "[My Private Project] SSL certificate for gerlach-bergnaum.net will expire on 11/2/2023 11:22:41 UTC",
"project": {
"id": 4,
"name": "My Private Project"
},
"site": {
"id": "f0cacf21-8446-4545-9544-f764b9470c29",
"name": "gerlach-bergnaum.net",
"url": "http://steuber-ernser.com/martha_crona",
"frequency": 5,
"match_type": "success",
"match": null,
"state": "up",
"active": true,
"last_checked_at": "2023-07-21 17:46:24 UTC",
"retries": 0,
"proxy": 0,
"cert_will_expire_at": "2023-11-02 11:22:41 UTC",
"details_url": "http://localhost:3000/projects/4/sites/f0cacf21-8446-4545-9544-f764b9470c29"
}
}
```
# Check-in missing event payload
> Sent when an expected check-in is missing.
Sent when an expected check-in is missing.
```json
{
"event": "check_in_missing",
"message": "[Voyager Test] MISSING: Voyager hasn't checked in for 4 years",
"project": {
"id": 67747,
"name": "Voyager Test",
"created_at": "2019-12-23T21:28:16.571090Z",
"disable_public_links": false,
"pivotal_project_id": null,
"asana_workspace_id": null,
"token": "abcd1234",
"github_project": null,
"environments": [
{
"id": 94721,
"project_id": 67747,
"name": "development",
"notifications": true,
"created_at": "2020-01-08T16:00:02.343155Z",
"updated_at": "2020-01-08T16:00:02.343155Z"
},
{
"id": 94355,
"project_id": 67747,
"name": "local",
"notifications": true,
"created_at": "2019-12-23T21:28:30.733084Z",
"updated_at": "2019-12-23T21:28:30.733084Z"
}
],
"owner": {
"id": 1,
"email": "ben@example.com",
"name": "Spacely Sprockets"
},
"last_notice_at": "2020-11-10T20:07:04.000000Z",
"earliest_notice_at": "2023-05-03T19:39:33.365387Z",
"unresolved_fault_count": 3,
"fault_count": 6,
"active": true,
"users": [
{
"id": 1,
"email": "ben@example.com",
"name": "Ben"
}
],
"sites": [],
"team_id": null
},
"check_in": {
"state": "missing",
"schedule_type": "simple",
"reported_at": "2019-12-23T21:39:37.124397Z",
"expected_at": "2023-10-30T19:42:28.853152Z",
"missed_count": 33385,
"grace_period": "00:00:00",
"id": "XYZLOL",
"name": "Voyager",
"slug": null,
"url": "https://api.honeybadger.io/v1/check_in/XYZLOL",
"details_url": "https://app.honeybadger.io/projects/67747/check_ins",
"report_period": "1 hour"
}
}
```
# Check-in reporting event payload
> Sent when a check-in reports successfully.
Sent when a check-in reports successfully.
```json
{
"event": "check_in_reporting",
"message": "[Voyager Test] REPORTING: Voyager is reporting again",
"project": {
"id": 67747,
"name": "Voyager Test",
"created_at": "2019-12-23T21:28:16.571090Z",
"disable_public_links": false,
"pivotal_project_id": null,
"asana_workspace_id": null,
"token": "abcd1234",
"github_project": null,
"environments": [
{
"id": 94721,
"project_id": 67747,
"name": "development",
"notifications": true,
"created_at": "2020-01-08T16:00:02.343155Z",
"updated_at": "2020-01-08T16:00:02.343155Z"
},
{
"id": 94355,
"project_id": 67747,
"name": "local",
"notifications": true,
"created_at": "2019-12-23T21:28:30.733084Z",
"updated_at": "2019-12-23T21:28:30.733084Z"
}
],
"owner": {
"id": 1,
"email": "ben@example.com",
"name": "Spacely Sprockets"
},
"last_notice_at": "2020-11-10T20:07:04.000000Z",
"earliest_notice_at": "2023-05-03T19:39:54.491724Z",
"unresolved_fault_count": 3,
"fault_count": 6,
"active": true,
"users": [
{
"id": 1,
"email": "ben@example.com",
"name": "Ben"
}
],
"sites": [],
"team_id": null
},
"check_in": {
"state": "missing",
"schedule_type": "simple",
"reported_at": "2019-12-23T21:39:37.124397Z",
"expected_at": "2023-10-30T19:42:28.853152Z",
"missed_count": 33385,
"grace_period": "00:00:00",
"id": "XYZLOL",
"name": "Voyager",
"slug": null,
"url": "https://api.honeybadger.io/v1/check_in/XYZLOL",
"details_url": "https://app.honeybadger.io/projects/67747/check_ins",
"report_period": "1 hour"
}
}
```
# Error Comment event payload
> Sent when a comment is added to an error.
Sent when a comment is added to an error.
```json
{
"event": "commented",
"message": "[Testy McTestFace/production] Ben commented on ActiveRecord::StatementInvalid: First post!",
"actor": {
"id": 1,
"email": "ben@example.com",
"name": "Ben"
},
"fault": {
"project_id": 123321,
"klass": "ActiveRecord::StatementInvalid",
"component": "search",
"action": "index",
"environment": "production",
"resolved": true,
"ignored": false,
"created_at": "2023-01-31T03:10:01.126549Z",
"comments_count": 3,
"message": "PG::SyntaxError: ERROR: syntax error in tsquery: \"厄瓜多尔Google霸屏【TG飞机:@bapingseo】腾讯视频谷歌完全无广告版【TG飞机:@bapingseo】不到外贸行业运营推广计划怎么写谷歌相机的广告怎么关掉?Em0atRS3g3F4.html\"",
"notices_count": 5514,
"last_notice_at": "2023-02-06T12:20:01.772130Z",
"tags": [],
"id": 42,
"assignee": "george@example.com",
"url": "https://app.honeybadger.io/projects/123321/faults/42",
"deploy": {
"environment": "production",
"revision": "dd2ce1c1f5be3532e10fadf2224a19847f0c62e9",
"repository": "https://github.com/spacely/testy-mctestface",
"local_username": "heroku-redis@addons.heroku.com",
"created_at": "2023-02-01T05:12:31.417405Z",
"changelog": [],
"url": "https://github.com/spacely/testy-mctestface/compare/3e51742fd5f43197891a67b74a54903513e59ce5...dd2ce1c1f5be3532e10fadf2224a19847f0c62e9"
}
},
"comment": {
"id": 7075,
"fault_id": 2653,
"event": null,
"source": "web",
"created_at": "2012-11-29T03:44:09.381543Z",
"email": null,
"author": "Starr",
"body": "You might try shaving the yaks outside of the transaction."
}
}
```
# Deployed event payload
> Sent when a deployment is recorded.
Sent when a deployment is recorded.
```json
{
"event": "deployed",
"message": "[Testy McTestFace/production] ben@example.com deployed Testy McTestFace to production",
"project": {
"id": 123321,
"name": "Testy McTestFace",
"created_at": "2017-08-30T12:54:33.156695Z",
"disable_public_links": false,
"pivotal_project_id": null,
"asana_workspace_id": null,
"token": "zzz111",
"github_project": "spacely/testy-mctestface",
"environments": [
{
"id": 68210,
"project_id": 123321,
"name": "production",
"notifications": true,
"created_at": "2017-09-05T06:10:19.057794Z",
"updated_at": "2017-09-05T06:10:19.057794Z"
},
{
"id": 68074,
"project_id": 123321,
"name": "development",
"notifications": true,
"created_at": "2017-08-30T12:55:29.297392Z",
"updated_at": "2017-08-30T12:55:29.297392Z"
}
],
"owner": {
"id": 1,
"email": "ben@example.com",
"name": "Spacely Sprockets"
},
"last_notice_at": "2023-10-30T19:29:08.000000Z",
"earliest_notice_at": "2023-05-03T19:50:44.677809Z",
"unresolved_fault_count": 102,
"fault_count": 925,
"active": true,
"users": [
{
"id": 1,
"email": "ben@example.com",
"name": "Ben"
},
{
"id": 99,
"email": "george@example.com",
"name": "George Jetson"
}
],
"sites": [],
"team_id": 1
},
"deploy": {
"environment": "production",
"revision": "d5b13eea87cd98b45e51b92d6382198f4c102d6d",
"repository": "https://github.com/spacely/testy-mctestface",
"local_username": "ben@example.com",
"created_at": "2023-10-30T15:10:40.754174Z",
"changelog": [],
"url": "https://github.com/spacely/testy-mctestface/compare/5c9c677d9bb17cb3a211d1f65701b866e9ece5a7...d5b13eea87cd98b45e51b92d6382198f4c102d6d"
}
}
```
# Site down event payload
> Sent when an uptime check fails.
Sent when an uptime check fails.
```json
{
"event": "down",
"message": "[Testy McTestFace] Heroku is down.",
"project": {
"id": 123321,
"name": "Testy McTestFace",
"created_at": "2017-08-30T12:54:33.156695Z",
"disable_public_links": false,
"pivotal_project_id": null,
"asana_workspace_id": null,
"token": "zzz111",
"github_project": "spacely/testy-mctestface",
"environments": [
{
"id": 68210,
"project_id": 123321,
"name": "production",
"notifications": true,
"created_at": "2017-09-05T06:10:19.057794Z",
"updated_at": "2017-09-05T06:10:19.057794Z"
},
{
"id": 68074,
"project_id": 123321,
"name": "development",
"notifications": true,
"created_at": "2017-08-30T12:55:29.297392Z",
"updated_at": "2017-08-30T12:55:29.297392Z"
}
],
"owner": {
"id": 1,
"email": "ben@example.com",
"name": "Spacely Sprockets"
},
"last_notice_at": "2023-10-30T19:29:08.000000Z",
"earliest_notice_at": "2023-05-03T19:38:32.092931Z",
"unresolved_fault_count": 102,
"fault_count": 925,
"active": true,
"users": [
{
"id": 1,
"email": "ben@example.com",
"name": "Ben"
},
{
"id": 99,
"email": "george@example.com",
"name": "George Jetson"
}
],
"sites": [],
"team_id": 1
},
"site": {
"id": "c42c4c0a-6e3d-4303-9769-549ed2a5818e",
"name": "Heroku",
"url": "https://example.com",
"frequency": 5,
"match_type": "success",
"match": null,
"state": "down",
"active": true,
"last_checked_at": "2023-10-30T19:34:08.150725Z",
"retries": 0,
"proxy": 4,
"cert_will_expire_at": null,
"details_url": "https://app.honeybadger.io/projects/123321/sites/c42c4c0a-6e3d-4303-9769-549ed2a5818e"
},
"outage": {
"down_at": "2023-07-17T15:46:52.384701Z",
"up_at": "2023-07-17T15:51:56.063948Z",
"status": null,
"reason": "Connection timed out",
"headers": null,
"details_url": "https://app.honeybadger.io/projects/123321/sites/c42c4c0a-6e3d-4303-9769-549ed2a5818e"
}
}
```
# Occurred event payload
> Sent when an error occurs.
Sent when an error occurs.
```json
{
"event": "occurred",
"message": "[Testy McTestFace/production] ActiveRecord::NoDatabaseError: We could not find your database: d6ipl26lboesdi. Which can be found in the database configuration file located at config/database.yml.\n\nTo resolve this issue:\n\n- Did you create the database for th...",
"project": {
"id": 123321,
"name": "Testy McTestFace",
"created_at": "2017-08-30T12:54:33.156695Z",
"disable_public_links": false,
"pivotal_project_id": null,
"asana_workspace_id": null,
"token": "zzz111",
"github_project": "spacely/testy-mctestface",
"environments": [
{
"id": 68210,
"project_id": 123321,
"name": "production",
"notifications": true,
"created_at": "2017-09-05T06:10:19.057794Z",
"updated_at": "2017-09-05T06:10:19.057794Z"
},
{
"id": 68074,
"project_id": 123321,
"name": "development",
"notifications": true,
"created_at": "2017-08-30T12:55:29.297392Z",
"updated_at": "2017-08-30T12:55:29.297392Z"
}
],
"owner": {
"id": 1,
"email": "ben@example.com",
"name": "Spacely Sprockets"
},
"last_notice_at": "2023-10-30T19:29:08.000000Z",
"earliest_notice_at": "2023-05-03T19:35:56.783102Z",
"unresolved_fault_count": 102,
"fault_count": 925,
"active": true,
"users": [
{
"id": 1,
"email": "ben@example.com",
"name": "Ben"
},
{
"id": 99,
"email": "george@example.com",
"name": "George Jetson"
}
],
"sites": [
{
"id": "c42c4c0a-6e3d-4303-9769-549ed2a5818e",
"active": true,
"last_checked_at": "2023-10-30T19:34:08.150725Z",
"name": "Heroku",
"state": "up",
"url": "https://example.com"
}
],
"team_id": 1
},
"fault": {
"project_id": 123321,
"klass": "ActiveRecord::NoDatabaseError",
"component": "pages",
"action": "home",
"environment": "production",
"resolved": false,
"ignored": false,
"created_at": "2023-10-13T18:07:55.692256Z",
"comments_count": 0,
"message": "We could not find your database: d6ipl26lboesdi. Which can be found in the database configuration file located at config/database.yml.\n\nTo resolve this issue:\n\n- Did you create the database for this app, or delete it? You may need to create your database.\n- Has the database name changed? Check your database.yml config has the correct database name.\n\nTo create your database, run:\n\n bin/rails db:create",
"notices_count": 6,
"last_notice_at": "2023-10-13T18:08:10.000000Z",
"tags": [],
"id": 101337516,
"assignee": null,
"url": "https://app.honeybadger.io/projects/123321/faults/101337516",
"deploy": {
"environment": "production",
"revision": "0eaf61a9ec756be9f4bb511ad71b37baaa9b73ba",
"repository": "https://github.com/spacely/testy-mctestface",
"local_username": "ben@example.com",
"created_at": "2023-10-06T20:52:51.878336Z",
"changelog": [],
"url": "https://github.com/spacely/testy-mctestface/compare/d4f90c876adf4a108ebb9a6f47b5562b59578d97...0eaf61a9ec756be9f4bb511ad71b37baaa9b73ba"
}
},
"notice": {
"id": 1013375161697220500,
"environment": {},
"created_at": "2023-10-13T18:08:10.141219Z",
"message": null,
"token": "babe1d9d-67e3-4438-8c57-c544cea24ffb",
"fault_id": 101337516,
"request": {
"url": "https://example.com/",
"component": "pages",
"action": "home",
"params": {
"controller": "pages",
"action": "home"
},
"session": {},
"context": {}
},
"backtrace": [
{
"number": "81",
"file": "[GEM_ROOT]/gems/activerecord-7.0.7.2/lib/active_record/connection_adapters/postgresql_adapter.rb",
"method": "rescue in new_client",
"source": {
"79": " rescue ::PG::Error => error\n",
"80": " if conn_params && conn_params[:dbname] && error.message.include?(conn_params[:dbname])\n",
"81": " raise ActiveRecord::NoDatabaseError.db_error(conn_params[:dbname])\n",
"82": " elsif conn_params && conn_params[:user] && error.message.include?(conn_params[:user])\n",
"83": " raise ActiveRecord::DatabaseConnectionError.username_error(conn_params[:user])\n"
},
"context": "all"
},
{
"number": "77",
"file": "[GEM_ROOT]/gems/activerecord-7.0.7.2/lib/active_record/connection_adapters/postgresql_adapter.rb",
"method": "new_client",
"source": {
"75": "\n",
"76": " class << self\n",
"77": " def new_client(conn_params)\n",
"78": " PG.connect(**conn_params)\n",
"79": " rescue ::PG::Error => error\n"
},
"context": "all"
},
{
"number": "37",
"file": "[GEM_ROOT]/gems/activerecord-7.0.7.2/lib/active_record/connection_adapters/postgresql_adapter.rb",
"method": "postgresql_connection",
"source": {
"35": "\n",
"36": " ConnectionAdapters::PostgreSQLAdapter.new(\n",
"37": " ConnectionAdapters::PostgreSQLAdapter.new_client(conn_params),\n",
"38": " logger,\n",
"39": " conn_params,\n"
},
"context": "all"
},
{
"number": "656",
"file": "[GEM_ROOT]/gems/activerecord-7.0.7.2/lib/active_record/connection_adapters/abstract/connection_pool.rb",
"method": "public_send",
"source": {
"654": "\n",
"655": " def new_connection\n",
"656": " Base.public_send(db_config.adapter_method, db_config.configuration_hash).tap do |conn|\n",
"657": " conn.check_version\n",
"658": " end\n"
},
"context": "all"
},
{
"number": "656",
"file": "[GEM_ROOT]/gems/activerecord-7.0.7.2/lib/active_record/connection_adapters/abstract/connection_pool.rb",
"method": "new_connection",
"source": {
"654": "\n",
"655": " def new_connection\n",
"656": " Base.public_send(db_config.adapter_method, db_config.configuration_hash).tap do |conn|\n",
"657": " conn.check_version\n",
"658": " end\n"
},
"context": "all"
},
{
"number": "700",
"file": "[GEM_ROOT]/gems/activerecord-7.0.7.2/lib/active_record/connection_adapters/abstract/connection_pool.rb",
"method": "checkout_new_connection",
"source": {
"698": " def checkout_new_connection\n",
"699": " raise ConnectionNotEstablished unless @automatic_reconnect\n",
"700": " new_connection\n",
"701": " end\n",
"702": "\n"
},
"context": "all"
},
{
"number": "679",
"file": "[GEM_ROOT]/gems/activerecord-7.0.7.2/lib/active_record/connection_adapters/abstract/connection_pool.rb",
"method": "try_to_checkout_new_connection",
"source": {
"677": " # if successfully incremented @now_connecting establish new connection\n",
"678": " # outside of synchronized section\n",
"679": " conn = checkout_new_connection\n",
"680": " ensure\n",
"681": " synchronize do\n"
},
"context": "all"
},
{
"number": "640",
"file": "[GEM_ROOT]/gems/activerecord-7.0.7.2/lib/active_record/connection_adapters/abstract/connection_pool.rb",
"method": "acquire_connection",
"source": {
"638": " # and +try_to_checkout_new_connection+ we can piggyback on +synchronize+ sections\n",
"639": " # of the said methods and avoid an additional +synchronize+ overhead.\n",
"640": " if conn = @available.poll || try_to_checkout_new_connection\n",
"641": " conn\n",
"642": " else\n"
},
"context": "all"
},
{
"number": "341",
"file": "[GEM_ROOT]/gems/activerecord-7.0.7.2/lib/active_record/connection_adapters/abstract/connection_pool.rb",
"method": "checkout",
"source": {
"339": " # - ActiveRecord::ConnectionTimeoutError no connection can be obtained from the pool.\n",
"340": " def checkout(checkout_timeout = @checkout_timeout)\n",
"341": " checkout_and_verify(acquire_connection(checkout_timeout))\n",
"342": " end\n",
"343": "\n"
},
"context": "all"
},
{
"number": "181",
"file": "[GEM_ROOT]/gems/activerecord-7.0.7.2/lib/active_record/connection_adapters/abstract/connection_pool.rb",
"method": "connection",
"source": {
"179": " # held in a cache keyed by a thread.\n",
"180": " def connection\n",
"181": " @thread_cached_conns[connection_cache_key(current_thread)] ||= checkout\n",
"182": " end\n",
"183": "\n"
},
"context": "all"
},
{
"number": "211",
"file": "[GEM_ROOT]/gems/activerecord-7.0.7.2/lib/active_record/connection_adapters/abstract/connection_handler.rb",
"method": "retrieve_connection",
"source": {
"209": " end\n",
"210": "\n",
"211": " pool.connection\n",
"212": " end\n",
"213": "\n"
},
"context": "all"
},
{
"number": "313",
"file": "[GEM_ROOT]/gems/activerecord-7.0.7.2/lib/active_record/connection_handling.rb",
"method": "retrieve_connection",
"source": {
"311": "\n",
"312": " def retrieve_connection\n",
"313": " connection_handler.retrieve_connection(connection_specification_name, role: current_role, shard: current_shard)\n",
"314": " end\n",
"315": "\n"
},
"context": "all"
},
{
"number": "280",
"file": "[GEM_ROOT]/gems/activerecord-7.0.7.2/lib/active_record/connection_handling.rb",
"method": "connection",
"source": {
"278": " # to any of the specific Active Records.\n",
"279": " def connection\n",
"280": " retrieve_connection\n",
"281": " end\n",
"282": "\n"
},
"context": "all"
},
{
"number": "433",
"file": "[GEM_ROOT]/gems/activerecord-7.0.7.2/lib/active_record/core.rb",
"method": "cached_find_by_statement",
"source": {
"431": "\n",
"432": " def cached_find_by_statement(key, &block) # :nodoc:\n",
"433": " cache = @find_by_statement_cache[connection.prepared_statements]\n",
"434": " cache.compute_if_absent(key) { StatementCache.create(connection, &block) }\n",
"435": " end\n"
},
"context": "all"
},
{
"number": "317",
"file": "[GEM_ROOT]/gems/activerecord-7.0.7.2/lib/active_record/core.rb",
"method": "find_by",
"source": {
"315": "\n",
"316": " keys = hash.keys\n",
"317": " statement = cached_find_by_statement(keys) { |params|\n",
"318": " wheres = keys.index_with { params.bind }\n",
"319": " where(wheres).limit(1)\n"
},
"context": "all"
},
{
"number": "69",
"file": "[PROJECT_ROOT]/app/controllers/application_controller.rb",
"method": "check_redirect",
"source": {
"67": "\n",
"68": " def check_redirect\n",
"69": " return unless (redirect = Redirect.find_by(slug: request.path.sub(%r{^/}, \"\")))\n",
"70": " redirect_to redirect.url\n",
"71": " end\n"
},
"application_file": "app/controllers/application_controller.rb",
"context": "app"
},
{
"number": "400",
"file": "[GEM_ROOT]/gems/activesupport-7.0.7.2/lib/active_support/callbacks.rb",
"method": "block in make_lambda",
"source": {
"398": " def make_lambda\n",
"399": " lambda do |target, value, &block|\n",
"400": " target.send(@method_name, &block)\n",
"401": " end\n",
"402": " end\n"
},
"context": "all"
},
{
"number": "180",
"file": "[GEM_ROOT]/gems/activesupport-7.0.7.2/lib/active_support/callbacks.rb",
"method": "block (2 levels) in halting_and_conditional",
"source": {
"178": "\n",
"179": " if !halted && user_conditions.all? { |c| c.call(target, value) }\n",
"180": " result_lambda = -> { user_callback.call target, value }\n",
"181": " env.halted = halted_lambda.call(target, result_lambda)\n",
"182": " if env.halted\n"
},
"context": "all"
},
{
"number": "34",
"file": "[GEM_ROOT]/gems/actionpack-7.0.7.2/lib/abstract_controller/callbacks.rb",
"method": "block (2 levels) in ",
"source": {
"32": " included do\n",
"33": " define_callbacks :process_action,\n",
"34": " terminator: ->(controller, result_lambda) { result_lambda.call; controller.performed? },\n",
"35": " skip_after_callbacks_if_terminated: true\n",
"36": " end\n"
},
"context": "all"
},
{
"number": "181",
"file": "[GEM_ROOT]/gems/activesupport-7.0.7.2/lib/active_support/callbacks.rb",
"method": "block in halting_and_conditional",
"source": {
"179": " if !halted && user_conditions.all? { |c| c.call(target, value) }\n",
"180": " result_lambda = -> { user_callback.call target, value }\n",
"181": " env.halted = halted_lambda.call(target, result_lambda)\n",
"182": " if env.halted\n",
"183": " target.send :halted_callback_hook, filter, name\n"
},
"context": "all"
},
{
"number": "595",
"file": "[GEM_ROOT]/gems/activesupport-7.0.7.2/lib/active_support/callbacks.rb",
"method": "block in invoke_before",
"source": {
"593": "\n",
"594": " def invoke_before(arg)\n",
"595": " @before.each { |b| b.call(arg) }\n",
"596": " end\n",
"597": "\n"
},
"context": "all"
},
{
"number": "595",
"file": "[GEM_ROOT]/gems/activesupport-7.0.7.2/lib/active_support/callbacks.rb",
"method": "each",
"source": {
"593": "\n",
"594": " def invoke_before(arg)\n",
"595": " @before.each { |b| b.call(arg) }\n",
"596": " end\n",
"597": "\n"
},
"context": "all"
},
{
"number": "595",
"file": "[GEM_ROOT]/gems/activesupport-7.0.7.2/lib/active_support/callbacks.rb",
"method": "invoke_before",
"source": {
"593": "\n",
"594": " def invoke_before(arg)\n",
"595": " @before.each { |b| b.call(arg) }\n",
"596": " end\n",
"597": "\n"
},
"context": "all"
},
{
"number": "106",
"file": "[GEM_ROOT]/gems/activesupport-7.0.7.2/lib/active_support/callbacks.rb",
"method": "run_callbacks",
"source": {
"104": " # Common case: no 'around' callbacks defined\n",
"105": " if next_sequence.final?\n",
"106": " next_sequence.invoke_before(env)\n",
"107": " env.value = !env.halted && (!block_given? || yield)\n",
"108": " next_sequence.invoke_after(env)\n"
},
"context": "all"
},
{
"number": "233",
"file": "[GEM_ROOT]/gems/actionpack-7.0.7.2/lib/abstract_controller/callbacks.rb",
"method": "process_action",
"source": {
"231": " # process_action callbacks around the normal behavior.\n",
"232": " def process_action(...)\n",
"233": " run_callbacks(:process_action) do\n",
"234": " super\n",
"235": " end\n"
},
"context": "all"
},
{
"number": "23",
"file": "[GEM_ROOT]/gems/actionpack-7.0.7.2/lib/action_controller/metal/rescue.rb",
"method": "process_action",
"source": {
"21": " private\n",
"22": " def process_action(*)\n",
"23": " super\n",
"24": " rescue Exception => exception\n",
"25": " request.env[\"action_dispatch.show_detailed_exceptions\"] ||= show_detailed_exceptions?\n"
},
"context": "all"
},
{
"number": "67",
"file": "[GEM_ROOT]/gems/actionpack-7.0.7.2/lib/action_controller/metal/instrumentation.rb",
"method": "block in process_action",
"source": {
"65": "\n",
"66": " ActiveSupport::Notifications.instrument(\"process_action.action_controller\", raw_payload) do |payload|\n",
"67": " result = super\n",
"68": " payload[:response] = response\n",
"69": " payload[:status] = response.status\n"
},
"context": "all"
},
{
"number": "206",
"file": "[GEM_ROOT]/gems/activesupport-7.0.7.2/lib/active_support/notifications.rb",
"method": "block in instrument",
"source": {
"204": " def instrument(name, payload = {})\n",
"205": " if notifier.listening?(name)\n",
"206": " instrumenter.instrument(name, payload) { yield payload if block_given? }\n",
"207": " else\n",
"208": " yield payload if block_given?\n"
},
"context": "all"
},
{
"number": "24",
"file": "[GEM_ROOT]/gems/activesupport-7.0.7.2/lib/active_support/notifications/instrumenter.rb",
"method": "instrument",
"source": {
"22": " listeners_state = start name, payload\n",
"23": " begin\n",
"24": " yield payload if block_given?\n",
"25": " rescue Exception => e\n",
"26": " payload[:exception] = [e.class.name, e.message]\n"
},
"context": "all"
},
{
"number": "206",
"file": "[GEM_ROOT]/gems/activesupport-7.0.7.2/lib/active_support/notifications.rb",
"method": "instrument",
"source": {
"204": " def instrument(name, payload = {})\n",
"205": " if notifier.listening?(name)\n",
"206": " instrumenter.instrument(name, payload) { yield payload if block_given? }\n",
"207": " else\n",
"208": " yield payload if block_given?\n"
},
"context": "all"
},
{
"number": "66",
"file": "[GEM_ROOT]/gems/actionpack-7.0.7.2/lib/action_controller/metal/instrumentation.rb",
"method": "process_action",
"source": {
"64": " ActiveSupport::Notifications.instrument(\"start_processing.action_controller\", raw_payload)\n",
"65": "\n",
"66": " ActiveSupport::Notifications.instrument(\"process_action.action_controller\", raw_payload) do |payload|\n",
"67": " result = super\n",
"68": " payload[:response] = response\n"
},
"context": "all"
},
{
"number": "259",
"file": "[GEM_ROOT]/gems/actionpack-7.0.7.2/lib/action_controller/metal/params_wrapper.rb",
"method": "process_action",
"source": {
"257": " def process_action(*)\n",
"258": " _perform_parameter_wrapping if _wrapper_enabled?\n",
"259": " super\n",
"260": " end\n",
"261": "\n"
},
"context": "all"
},
{
"number": "27",
"file": "[GEM_ROOT]/gems/activerecord-7.0.7.2/lib/active_record/railties/controller_runtime.rb",
"method": "process_action",
"source": {
"25": " # and it won't be cleaned up by the method below.\n",
"26": " ActiveRecord::LogSubscriber.reset_runtime\n",
"27": " super\n",
"28": " end\n",
"29": "\n"
},
"context": "all"
},
{
"number": "120",
"file": "[GEM_ROOT]/gems/scout_apm-5.3.5/lib/scout_apm/instruments/action_controller_rails_3_rails4.rb",
"method": "process_action",
"source": {
"118": " req.start_layer( ScoutApm::Layer.new(\"Controller\", \"#{controller_path}/#{resolved_name}\") )\n",
"119": " begin\n",
"120": " super\n",
"121": " rescue\n",
"122": " req.error!\n"
},
"context": "all"
},
{
"number": "151",
"file": "[GEM_ROOT]/gems/actionpack-7.0.7.2/lib/abstract_controller/base.rb",
"method": "process",
"source": {
"149": " @_response_body = nil\n",
"150": "\n",
"151": " process_action(action_name, *args)\n",
"152": " end\n",
"153": " ruby2_keywords(:process)\n"
},
"context": "all"
},
{
"number": "39",
"file": "[GEM_ROOT]/gems/actionview-7.0.7.2/lib/action_view/rendering.rb",
"method": "process",
"source": {
"37": " def process(...) # :nodoc:\n",
"38": " old_config, I18n.config = I18n.config, I18nProxy.new(I18n.config, lookup_context)\n",
"39": " super\n",
"40": " ensure\n",
"41": " I18n.config = old_config\n"
},
"context": "all"
},
{
"number": "188",
"file": "[GEM_ROOT]/gems/actionpack-7.0.7.2/lib/action_controller/metal.rb",
"method": "dispatch",
"source": {
"186": " set_request!(request)\n",
"187": " set_response!(response)\n",
"188": " process(name)\n",
"189": " request.commit_flash\n",
"190": " to_a\n"
},
"context": "all"
},
{
"number": "251",
"file": "[GEM_ROOT]/gems/actionpack-7.0.7.2/lib/action_controller/metal.rb",
"method": "dispatch",
"source": {
"249": " middleware_stack.build(name) { |env| new.dispatch(name, req, res) }.call req.env\n",
"250": " else\n",
"251": " new.dispatch(name, req, res)\n",
"252": " end\n",
"253": " end\n"
},
"context": "all"
},
{
"number": "49",
"file": "[GEM_ROOT]/gems/actionpack-7.0.7.2/lib/action_dispatch/routing/route_set.rb",
"method": "dispatch",
"source": {
"47": "\n",
"48": " def dispatch(controller, action, req, res)\n",
"49": " controller.dispatch(action, req, res)\n",
"50": " end\n",
"51": " end\n"
},
"context": "all"
},
{
"number": "32",
"file": "[GEM_ROOT]/gems/actionpack-7.0.7.2/lib/action_dispatch/routing/route_set.rb",
"method": "serve",
"source": {
"30": " controller = controller req\n",
"31": " res = controller.make_response! req\n",
"32": " dispatch(controller, params[:action], req, res)\n",
"33": " rescue ActionController::RoutingError\n",
"34": " if @raise_on_name_error\n"
},
"context": "all"
},
{
"number": "50",
"file": "[GEM_ROOT]/gems/actionpack-7.0.7.2/lib/action_dispatch/journey/router.rb",
"method": "block in serve",
"source": {
"48": " req.path_parameters = tmp_params\n",
"49": "\n",
"50": " status, headers, body = route.app.serve(req)\n",
"51": "\n",
"52": " if \"pass\" == headers[\"X-Cascade\"]\n"
},
"context": "all"
},
{
"number": "32",
"file": "[GEM_ROOT]/gems/actionpack-7.0.7.2/lib/action_dispatch/journey/router.rb",
"method": "each",
"source": {
"30": "\n",
"31": " def serve(req)\n",
"32": " find_routes(req).each do |match, parameters, route|\n",
"33": " set_params = req.path_parameters\n",
"34": " path_info = req.path_info\n"
},
"context": "all"
},
{
"number": "32",
"file": "[GEM_ROOT]/gems/actionpack-7.0.7.2/lib/action_dispatch/journey/router.rb",
"method": "serve",
"source": {
"30": "\n",
"31": " def serve(req)\n",
"32": " find_routes(req).each do |match, parameters, route|\n",
"33": " set_params = req.path_parameters\n",
"34": " path_info = req.path_info\n"
},
"context": "all"
},
{
"number": "852",
"file": "[GEM_ROOT]/gems/actionpack-7.0.7.2/lib/action_dispatch/routing/route_set.rb",
"method": "call",
"source": {
"850": " req = make_request(env)\n",
"851": " req.path_info = Journey::Router::Utils.normalize_path(req.path_info)\n",
"852": " @router.serve(req)\n",
"853": " end\n",
"854": "\n"
},
"context": "all"
},
{
"number": "29",
"file": "[GEM_ROOT]/gems/scout_apm-5.3.5/lib/scout_apm/instruments/rails_router.rb",
"method": "call_with_scout_instruments",
"source": {
"27": "\n",
"28": " begin\n",
"29": " call_without_scout_instruments(*args)\n",
"30": " ensure\n",
"31": " req.stop_layer\n"
},
"context": "all"
},
{
"number": "17",
"file": "[GEM_ROOT]/gems/scout_apm-5.3.5/lib/scout_apm/middleware.rb",
"method": "call",
"source": {
"15": " def call(env)\n",
"16": " if !@enabled || @started || @attempts > MAX_ATTEMPTS\n",
"17": " @app.call(env)\n",
"18": " else\n",
"19": " attempt_to_start_agent\n"
},
"context": "all"
},
{
"number": "36",
"file": "[GEM_ROOT]/gems/warden-1.2.9/lib/warden/manager.rb",
"method": "block in call",
"source": {
"34": " result = catch(:warden) do\n",
"35": " env['warden'].on_request\n",
"36": " @app.call(env)\n",
"37": " end\n",
"38": "\n"
},
"context": "all"
},
{
"number": "34",
"file": "[GEM_ROOT]/gems/warden-1.2.9/lib/warden/manager.rb",
"method": "catch",
"source": {
"32": "\n",
"33": " env['warden'] = Proxy.new(env, self)\n",
"34": " result = catch(:warden) do\n",
"35": " env['warden'].on_request\n",
"36": " @app.call(env)\n"
},
"context": "all"
},
{
"number": "34",
"file": "[GEM_ROOT]/gems/warden-1.2.9/lib/warden/manager.rb",
"method": "call",
"source": {
"32": "\n",
"33": " env['warden'] = Proxy.new(env, self)\n",
"34": " result = catch(:warden) do\n",
"35": " env['warden'].on_request\n",
"36": " @app.call(env)\n"
},
"context": "all"
},
{
"number": "15",
"file": "[GEM_ROOT]/gems/rack-2.2.8/lib/rack/tempfile_reaper.rb",
"method": "call",
"source": {
"13": " def call(env)\n",
"14": " env[RACK_TEMPFILES] ||= []\n",
"15": " status, headers, body = @app.call(env)\n",
"16": " body_proxy = BodyProxy.new(body) do\n",
"17": " env[RACK_TEMPFILES].each(&:close!) unless env[RACK_TEMPFILES].nil?\n"
},
"context": "all"
},
{
"number": "27",
"file": "[GEM_ROOT]/gems/rack-2.2.8/lib/rack/conditional_get.rb",
"method": "call",
"source": {
"25": " case env[REQUEST_METHOD]\n",
"26": " when \"GET\", \"HEAD\"\n",
"27": " status, headers, body = @app.call(env)\n",
"28": " headers = Utils::HeaderHash[headers]\n",
"29": " if status == 200 && fresh?(env, headers)\n"
},
"context": "all"
},
{
"number": "12",
"file": "[GEM_ROOT]/gems/rack-2.2.8/lib/rack/head.rb",
"method": "call",
"source": {
"10": "\n",
"11": " def call(env)\n",
"12": " status, headers, body = @app.call(env)\n",
"13": "\n",
"14": " if env[REQUEST_METHOD] == HEAD\n"
},
"context": "all"
},
{
"number": "38",
"file": "[GEM_ROOT]/gems/actionpack-7.0.7.2/lib/action_dispatch/http/permissions_policy.rb",
"method": "call",
"source": {
"36": " def call(env)\n",
"37": " request = ActionDispatch::Request.new(env)\n",
"38": " _, headers, _ = response = @app.call(env)\n",
"39": "\n",
"40": " return response unless html_response?(headers)\n"
},
"context": "all"
},
{
"number": "36",
"file": "[GEM_ROOT]/gems/actionpack-7.0.7.2/lib/action_dispatch/http/content_security_policy.rb",
"method": "call",
"source": {
"34": " def call(env)\n",
"35": " request = ActionDispatch::Request.new env\n",
"36": " status, headers, _ = response = @app.call(env)\n",
"37": "\n",
"38": " # Returning CSP headers with a 304 Not Modified is harmful, since nonces in the new\n"
},
"context": "all"
},
{
"number": "266",
"file": "[GEM_ROOT]/gems/rack-2.2.8/lib/rack/session/abstract/id.rb",
"method": "context",
"source": {
"264": " req = make_request env\n",
"265": " prepare_session(req)\n",
"266": " status, headers, body = app.call(req.env)\n",
"267": " res = Rack::Response::Raw.new status, headers\n",
"268": " commit_session(req, res)\n"
},
"context": "all"
},
{
"number": "260",
"file": "[GEM_ROOT]/gems/rack-2.2.8/lib/rack/session/abstract/id.rb",
"method": "call",
"source": {
"258": "\n",
"259": " def call(env)\n",
"260": " context(env)\n",
"261": " end\n",
"262": "\n"
},
"context": "all"
},
{
"number": "704",
"file": "[GEM_ROOT]/gems/actionpack-7.0.7.2/lib/action_dispatch/middleware/cookies.rb",
"method": "call",
"source": {
"702": " request = ActionDispatch::Request.new env\n",
"703": "\n",
"704": " status, headers, body = @app.call(env)\n",
"705": "\n",
"706": " if request.have_cookie_jar?\n"
},
"context": "all"
},
{
"number": "27",
"file": "[GEM_ROOT]/gems/actionpack-7.0.7.2/lib/action_dispatch/middleware/callbacks.rb",
"method": "block in call",
"source": {
"25": " error = nil\n",
"26": " result = run_callbacks :call do\n",
"27": " @app.call(env)\n",
"28": " rescue => error\n",
"29": " end\n"
},
"context": "all"
},
{
"number": "99",
"file": "[GEM_ROOT]/gems/activesupport-7.0.7.2/lib/active_support/callbacks.rb",
"method": "run_callbacks",
"source": {
"97": "\n",
"98": " if callbacks.empty?\n",
"99": " yield if block_given?\n",
"100": " else\n",
"101": " env = Filters::Environment.new(self, false, nil)\n"
},
"context": "all"
},
{
"number": "26",
"file": "[GEM_ROOT]/gems/actionpack-7.0.7.2/lib/action_dispatch/middleware/callbacks.rb",
"method": "call",
"source": {
"24": " def call(env)\n",
"25": " error = nil\n",
"26": " result = run_callbacks :call do\n",
"27": " @app.call(env)\n",
"28": " rescue => error\n"
},
"context": "all"
},
{
"number": "28",
"file": "[GEM_ROOT]/gems/actionpack-7.0.7.2/lib/action_dispatch/middleware/debug_exceptions.rb",
"method": "call",
"source": {
"26": " def call(env)\n",
"27": " request = ActionDispatch::Request.new env\n",
"28": " _, headers, body = response = @app.call(env)\n",
"29": "\n",
"30": " if headers[\"X-Cascade\"] == \"pass\"\n"
},
"context": "all"
},
{
"number": "29",
"file": "[GEM_ROOT]/gems/actionpack-7.0.7.2/lib/action_dispatch/middleware/show_exceptions.rb",
"method": "call",
"source": {
"27": " def call(env)\n",
"28": " request = ActionDispatch::Request.new env\n",
"29": " @app.call(env)\n",
"30": " rescue Exception => exception\n",
"31": " if request.show_exceptions?\n"
},
"context": "all"
},
{
"number": "18",
"file": "[GEM_ROOT]/gems/lograge-0.12.0/lib/lograge/rails_ext/rack/logger.rb",
"method": "call_app",
"source": {
"16": " def call_app(*args)\n",
"17": " env = args.last\n",
"18": " status, headers, body = @app.call(env)\n",
"19": " # needs to have same return type as the Rails builtins being overridden, see https://github.com/roidrage/lograge/pull/333\n",
"20": " # https://github.com/rails/rails/blob/be9d34b9bcb448b265114ebc28bef1a5b5e4c272/railties/lib/rails/rack/logger.rb#L37\n"
},
"context": "all"
},
{
"number": "25",
"file": "[GEM_ROOT]/gems/railties-7.0.7.2/lib/rails/rack/logger.rb",
"method": "block in call",
"source": {
"23": "\n",
"24": " if logger.respond_to?(:tagged)\n",
"25": " logger.tagged(compute_tags(request)) { call_app(request, env) }\n",
"26": " else\n",
"27": " call_app(request, env)\n"
},
"context": "all"
},
{
"number": "99",
"file": "[GEM_ROOT]/gems/activesupport-7.0.7.2/lib/active_support/tagged_logging.rb",
"method": "block in tagged",
"source": {
"97": " def tagged(*tags)\n",
"98": " if block_given?\n",
"99": " formatter.tagged(*tags) { yield self }\n",
"100": " else\n",
"101": " logger = ActiveSupport::TaggedLogging.new(self)\n"
},
"context": "all"
},
{
"number": "37",
"file": "[GEM_ROOT]/gems/activesupport-7.0.7.2/lib/active_support/tagged_logging.rb",
"method": "tagged",
"source": {
"35": " def tagged(*tags)\n",
"36": " new_tags = push_tags(*tags)\n",
"37": " yield self\n",
"38": " ensure\n",
"39": " pop_tags(new_tags.size)\n"
},
"context": "all"
},
{
"number": "99",
"file": "[GEM_ROOT]/gems/activesupport-7.0.7.2/lib/active_support/tagged_logging.rb",
"method": "tagged",
"source": {
"97": " def tagged(*tags)\n",
"98": " if block_given?\n",
"99": " formatter.tagged(*tags) { yield self }\n",
"100": " else\n",
"101": " logger = ActiveSupport::TaggedLogging.new(self)\n"
},
"context": "all"
},
{
"number": "25",
"file": "[GEM_ROOT]/gems/railties-7.0.7.2/lib/rails/rack/logger.rb",
"method": "call",
"source": {
"23": "\n",
"24": " if logger.respond_to?(:tagged)\n",
"25": " logger.tagged(compute_tags(request)) { call_app(request, env) }\n",
"26": " else\n",
"27": " call_app(request, env)\n"
},
"context": "all"
},
{
"number": "93",
"file": "[GEM_ROOT]/gems/actionpack-7.0.7.2/lib/action_dispatch/middleware/remote_ip.rb",
"method": "call",
"source": {
"91": " req = ActionDispatch::Request.new env\n",
"92": " req.remote_ip = GetIp.new(req, check_ip, proxies)\n",
"93": " @app.call(req.env)\n",
"94": " end\n",
"95": "\n"
},
"context": "all"
},
{
"number": "19",
"file": "[GEM_ROOT]/gems/request_store-1.5.1/lib/request_store/middleware.rb",
"method": "call",
"source": {
"17": " RequestStore.begin!\r\n",
"18": "\r\n",
"19": " status, headers, body = @app.call(env)\r\n",
"20": "\r\n",
"21": " body = Rack::BodyProxy.new(body) do\r\n"
},
"context": "all"
},
{
"number": "26",
"file": "[GEM_ROOT]/gems/actionpack-7.0.7.2/lib/action_dispatch/middleware/request_id.rb",
"method": "call",
"source": {
"24": " req = ActionDispatch::Request.new env\n",
"25": " req.request_id = make_request_id(req.headers[@header])\n",
"26": " @app.call(env).tap { |_status, headers, _body| headers[@header] = req.request_id }\n",
"27": " end\n",
"28": "\n"
},
"context": "all"
},
{
"number": "24",
"file": "[GEM_ROOT]/gems/rack-2.2.8/lib/rack/method_override.rb",
"method": "call",
"source": {
"22": " end\n",
"23": "\n",
"24": " @app.call(env)\n",
"25": " end\n",
"26": "\n"
},
"context": "all"
},
{
"number": "22",
"file": "[GEM_ROOT]/gems/rack-2.2.8/lib/rack/runtime.rb",
"method": "call",
"source": {
"20": " def call(env)\n",
"21": " start_time = Utils.clock_time\n",
"22": " status, headers, body = @app.call(env)\n",
"23": " headers = Utils::HeaderHash[headers]\n",
"24": "\n"
},
"context": "all"
},
{
"number": "148",
"file": "[GEM_ROOT]/gems/rack-timeout-0.6.3/lib/rack/timeout/core.rb",
"method": "block in call",
"source": {
"146": "\n",
"147": " response = timeout.timeout(info.timeout) do # perform request with timeout\n",
"148": " begin @app.call(env) # boom, send request down the middleware chain\n",
"149": " rescue RequestTimeoutException => e # will actually hardly ever get to this point because frameworks tend to catch this. see README for more\n",
"150": " raise RequestTimeoutError.new(env), e.message, e.backtrace # but in case it does get here, re-raise RequestTimeoutException as RequestTimeoutError\n"
},
"context": "all"
},
{
"number": "19",
"file": "[GEM_ROOT]/gems/rack-timeout-0.6.3/lib/rack/timeout/support/timeout.rb",
"method": "timeout",
"source": {
"17": " thr = Thread.current # reference to current thread to be used in timeout thread\n",
"18": " job = @scheduler.run_in(secs) { @on_timeout.call thr } # schedule this thread to be timed out; should get cancelled if block completes on time\n",
"19": " return block.call # do what you gotta do\n",
"20": " ensure #\n",
"21": " job.cancel! if job # cancel the scheduled timeout job; if the block completed on time, this\n"
},
"context": "all"
},
{
"number": "147",
"file": "[GEM_ROOT]/gems/rack-timeout-0.6.3/lib/rack/timeout/core.rb",
"method": "call",
"source": {
"145": " end\n",
"146": "\n",
"147": " response = timeout.timeout(info.timeout) do # perform request with timeout\n",
"148": " begin @app.call(env) # boom, send request down the middleware chain\n",
"149": " rescue RequestTimeoutException => e # will actually hardly ever get to this point because frameworks tend to catch this. see README for more\n"
},
"context": "all"
},
{
"number": "41",
"file": "[GEM_ROOT]/gems/judoscale-ruby-1.4.1/lib/judoscale/request_middleware.rb",
"method": "call",
"source": {
"39": " end\n",
"40": "\n",
"41": " @app.call(env)\n",
"42": " end\n",
"43": " end\n"
},
"context": "all"
},
{
"number": "29",
"file": "[GEM_ROOT]/gems/activesupport-7.0.7.2/lib/active_support/cache/strategy/local_cache_middleware.rb",
"method": "call",
"source": {
"27": " def call(env)\n",
"28": " LocalCacheRegistry.set_cache_for(local_cache_key, LocalStore.new)\n",
"29": " response = @app.call(env)\n",
"30": " response[2] = ::Rack::BodyProxy.new(response[2]) do\n",
"31": " LocalCacheRegistry.set_cache_for(local_cache_key, nil)\n"
},
"context": "all"
},
{
"number": "24",
"file": "[GEM_ROOT]/gems/rack-rewrite-1.5.1/lib/rack/rewrite.rb",
"method": "call",
"source": {
"22": " return rack_response unless rack_response === true\n",
"23": " end\n",
"24": " @app.call(env)\n",
"25": " end\n",
"26": " \n"
},
"context": "all"
},
{
"number": "14",
"file": "[GEM_ROOT]/gems/actionpack-7.0.7.2/lib/action_dispatch/middleware/executor.rb",
"method": "call",
"source": {
"12": " state = @executor.run!(reset: true)\n",
"13": " begin\n",
"14": " response = @app.call(env)\n",
"15": " returned = response << ::Rack::BodyProxy.new(response.pop) { state.complete! }\n",
"16": " rescue => error\n"
},
"context": "all"
},
{
"number": "23",
"file": "[GEM_ROOT]/gems/actionpack-7.0.7.2/lib/action_dispatch/middleware/static.rb",
"method": "call",
"source": {
"21": "\n",
"22": " def call(env)\n",
"23": " @file_handler.attempt(env) || @app.call(env)\n",
"24": " end\n",
"25": " end\n"
},
"context": "all"
},
{
"number": "110",
"file": "[GEM_ROOT]/gems/rack-2.2.8/lib/rack/sendfile.rb",
"method": "call",
"source": {
"108": "\n",
"109": " def call(env)\n",
"110": " status, headers, body = @app.call(env)\n",
"111": " if body.respond_to?(:to_path)\n",
"112": " case type = variation(env)\n"
},
"context": "all"
},
{
"number": "77",
"file": "[GEM_ROOT]/gems/actionpack-7.0.7.2/lib/action_dispatch/middleware/ssl.rb",
"method": "call",
"source": {
"75": "\n",
"76": " if request.ssl?\n",
"77": " @app.call(env).tap do |status, headers, body|\n",
"78": " set_hsts_header! headers\n",
"79": " flag_cookies_as_secure! headers if @secure_cookies && !@exclude.call(request)\n"
},
"context": "all"
},
{
"number": "131",
"file": "[GEM_ROOT]/gems/actionpack-7.0.7.2/lib/action_dispatch/middleware/host_authorization.rb",
"method": "call",
"source": {
"129": "\n",
"130": " def call(env)\n",
"131": " return @app.call(env) if @permissions.empty?\n",
"132": "\n",
"133": " request = Request.new(env)\n"
},
"context": "all"
},
{
"number": "58",
"file": "[GEM_ROOT]/gems/scout_apm-5.3.5/lib/scout_apm/instruments/middleware_summary.rb",
"method": "call",
"source": {
"56": " layer = ScoutApm::Layer.new(\"Middleware\", \"Summary\")\n",
"57": " req.start_layer(layer)\n",
"58": " @app.call(env)\n",
"59": " ensure\n",
"60": " req.stop_layer\n"
},
"context": "all"
},
{
"number": "530",
"file": "[GEM_ROOT]/gems/railties-7.0.7.2/lib/rails/engine.rb",
"method": "call",
"source": {
"528": " def call(env)\n",
"529": " req = build_request env\n",
"530": " app.call req.env\n",
"531": " end\n",
"532": "\n"
},
"context": "all"
},
{
"number": "270",
"file": "[GEM_ROOT]/gems/puma-6.3.1/lib/puma/configuration.rb",
"method": "call",
"source": {
"268": " def call(env)\n",
"269": " env[Const::PUMA_CONFIG] = @config\n",
"270": " @app.call(env)\n",
"271": " end\n",
"272": " end\n"
},
"context": "all"
},
{
"number": "100",
"file": "[GEM_ROOT]/gems/puma-6.3.1/lib/puma/request.rb",
"method": "block in handle_request",
"source": {
"98": " if @supported_http_methods == :any || @supported_http_methods.key?(env[REQUEST_METHOD])\n",
"99": " status, headers, app_body = @thread_pool.with_force_shutdown do\n",
"100": " @app.call(env)\n",
"101": " end\n",
"102": " else\n"
},
"context": "all"
},
{
"number": "344",
"file": "[GEM_ROOT]/gems/puma-6.3.1/lib/puma/thread_pool.rb",
"method": "with_force_shutdown",
"source": {
"342": " t[:with_force_shutdown] = true\n",
"343": " end\n",
"344": " yield\n",
"345": " ensure\n",
"346": " t[:with_force_shutdown] = false\n"
},
"context": "all"
},
{
"number": "99",
"file": "[GEM_ROOT]/gems/puma-6.3.1/lib/puma/request.rb",
"method": "handle_request",
"source": {
"97": " begin\n",
"98": " if @supported_http_methods == :any || @supported_http_methods.key?(env[REQUEST_METHOD])\n",
"99": " status, headers, app_body = @thread_pool.with_force_shutdown do\n",
"100": " @app.call(env)\n",
"101": " end\n"
},
"context": "all"
},
{
"number": "443",
"file": "[GEM_ROOT]/gems/puma-6.3.1/lib/puma/server.rb",
"method": "process_client",
"source": {
"441": " while true\n",
"442": " @requests_count += 1\n",
"443": " case handle_request(client, requests + 1)\n",
"444": " when false\n",
"445": " break\n"
},
"context": "all"
},
{
"number": "245",
"file": "[GEM_ROOT]/gems/puma-6.3.1/lib/puma/server.rb",
"method": "block in run",
"source": {
"243": " @status = :run\n",
"244": "\n",
"245": " @thread_pool = ThreadPool.new(thread_name, @options) { |client| process_client client }\n",
"246": "\n",
"247": " if @queue_requests\n"
},
"context": "all"
},
{
"number": "151",
"file": "[GEM_ROOT]/gems/puma-6.3.1/lib/puma/thread_pool.rb",
"method": "block in spawn_thread",
"source": {
"149": "\n",
"150": " begin\n",
"151": " @out_of_band_pending = true if block.call(work)\n",
"152": " rescue Exception => e\n",
"153": " STDERR.puts \"Error reached top of thread-pool: #{e.message} (#{e.class})\"\n"
},
"context": "all"
}
],
"application_trace": [
{
"number": "69",
"file": "[PROJECT_ROOT]/app/controllers/application_controller.rb",
"method": "check_redirect",
"source": {
"67": "\n",
"68": " def check_redirect\n",
"69": " return unless (redirect = Redirect.find_by(slug: request.path.sub(%r{^/}, \"\")))\n",
"70": " redirect_to redirect.url\n",
"71": " end\n"
},
"application_file": "app/controllers/application_controller.rb",
"context": "app"
}
],
"web_environment": {
"SERVER_SOFTWARE": "puma 6.3.1 Mugi No Toki Itaru",
"GATEWAY_INTERFACE": "CGI/1.2",
"REQUEST_METHOD": "GET",
"SERVER_PROTOCOL": "HTTP/1.1",
"HTTP_HOST": "example.com",
"HTTP_CONNECTION": "close",
"HTTP_USER_AGENT": "Amazon CloudFront",
"HTTP_X_AMZ_CF_ID": "yai2eezeewaipahthieN-Yt3y0gAunRuwBHH8A==",
"HTTP_IF_NONE_MATCH": "W/\"fde6ca645252fa81edfdae38dbeef178\"",
"HTTP_ACCEPT": "text/html,application/xhtml+xml,application/xml;q=0.9,image/avif,image/webp,image/apng,*/*;q=0.8,application/signed-exchange;v=b3;q=0.7",
"HTTP_X_FORWARDED_FOR": "199.175.219.155, 64.252.73.106",
"HTTP_VIA": "2.0 yai2eezeewaipahthieN.cloudfront.net (CloudFront), 1.1 vegur",
"HTTP_ACCEPT_ENCODING": "gzip",
"HTTP_IF_MODIFIED_SINCE": "Wed, 11 Oct 2023 20:51:58 GMT",
"HTTP_SEC_CH_UA": "\"Google Chrome\";v=\"117\", \"Not;A=Brand\";v=\"8\", \"Chromium\";v=\"117\"",
"HTTP_SEC_CH_UA_MOBILE": "?0",
"HTTP_SEC_CH_UA_PLATFORM": "\"Windows\"",
"HTTP_UPGRADE_INSECURE_REQUESTS": "1",
"HTTP_SEC_PURPOSE": "prefetch;prerender",
"HTTP_PURPOSE": "prefetch",
"HTTP_SEC_FETCH_SITE": "none",
"HTTP_SEC_FETCH_MODE": "navigate",
"HTTP_SEC_FETCH_USER": "?1",
"HTTP_SEC_FETCH_DEST": "document",
"HTTP_X_REQUEST_ID": "fb536bf3-76d0-4936-a354-2a3d023b2cf4",
"HTTP_X_FORWARDED_PROTO": "https",
"HTTP_X_FORWARDED_PORT": "443",
"HTTP_CONNECT_TIME": "1",
"HTTP_X_REQUEST_START": "1697220489932",
"HTTP_TOTAL_ROUTE_TIME": "0",
"SERVER_NAME": "example.com",
"SERVER_PORT": "443",
"REMOTE_ADDR": "10.1.5.53",
"HTTP_VERSION": "HTTP/1.1"
},
"deploy": {
"environment": "production",
"revision": "0eaf61a9ec756be9f4bb511ad71b37baaa9b73ba",
"repository": "https://github.com/spacely/testy-mctestface",
"local_username": "ben@example.com",
"created_at": "2023-10-06T20:52:51.878336Z",
"changelog": [],
"url": "https://github.com/spacely/testy-mctestface/compare/d4f90c876adf4a108ebb9a6f47b5562b59578d97...0eaf61a9ec756be9f4bb511ad71b37baaa9b73ba"
},
"url": "https://app.honeybadger.io/projects/123321/faults/101337516/01HCN3JWWXRQX511BB83WM2X95"
}
}
```
# Rate exceeded event payload
> Sent when error rate threshold is exceeded.
Sent when error rate threshold is exceeded.
```json
{
"event": "rate_exceeded",
"message": "[Testy McTestFace/production] ActiveRecord::NoDatabaseError has occurred time(s) in the past ",
"project": {
"id": 123321,
"name": "Testy McTestFace",
"created_at": "2017-08-30T12:54:33.156695Z",
"disable_public_links": false,
"pivotal_project_id": null,
"asana_workspace_id": null,
"token": "zzz111",
"github_project": "spacely/testy-mctestface",
"environments": [
{
"id": 68210,
"project_id": 123321,
"name": "production",
"notifications": true,
"created_at": "2017-09-05T06:10:19.057794Z",
"updated_at": "2017-09-05T06:10:19.057794Z"
},
{
"id": 68074,
"project_id": 123321,
"name": "development",
"notifications": true,
"created_at": "2017-08-30T12:55:29.297392Z",
"updated_at": "2017-08-30T12:55:29.297392Z"
}
],
"owner": {
"id": 1,
"email": "ben@example.com",
"name": "Spacely Sprockets"
},
"last_notice_at": "2023-10-30T19:29:08.000000Z",
"earliest_notice_at": "2023-05-03T19:37:25.519130Z",
"unresolved_fault_count": 102,
"fault_count": 925,
"active": true,
"users": [
{
"id": 1,
"email": "ben@example.com",
"name": "Ben"
},
{
"id": 99,
"email": "george@example.com",
"name": "George Jetson"
}
],
"sites": [
{
"id": "c42c4c0a-6e3d-4303-9769-549ed2a5818e",
"active": true,
"last_checked_at": "2023-10-30T19:34:08.150725Z",
"name": "Heroku",
"state": "up",
"url": "https://example.com"
}
],
"team_id": 1
},
"fault": {
"project_id": 123321,
"klass": "ActiveRecord::NoDatabaseError",
"component": "pages",
"action": "home",
"environment": "production",
"resolved": false,
"ignored": false,
"created_at": "2023-10-13T18:07:55.692256Z",
"comments_count": 0,
"message": "We could not find your database: d6ipl26lboesdi. Which can be found in the database configuration file located at config/database.yml.\n\nTo resolve this issue:\n\n- Did you create the database for this app, or delete it? You may need to create your database.\n- Has the database name changed? Check your database.yml config has the correct database name.\n\nTo create your database, run:\n\n bin/rails db:create",
"notices_count": 6,
"last_notice_at": "2023-10-13T18:08:10.000000Z",
"tags": [],
"id": 101337516,
"assignee": null,
"url": "https://app.honeybadger.io/projects/123321/faults/101337516",
"deploy": {
"environment": "production",
"revision": "0eaf61a9ec756be9f4bb511ad71b37baaa9b73ba",
"repository": "https://github.com/spacely/testy-mctestface",
"local_username": "ben@example.com",
"created_at": "2023-10-06T20:52:51.878336Z",
"changelog": [],
"url": "https://github.com/spacely/testy-mctestface/compare/d4f90c876adf4a108ebb9a6f47b5562b59578d97...0eaf61a9ec756be9f4bb511ad71b37baaa9b73ba"
}
},
"notice": {
"id": 1013375161697220500,
"environment": {},
"created_at": "2023-10-13T18:08:10.141219Z",
"message": null,
"token": "babe1d9d-67e3-4438-8c57-c544cea24ffb",
"fault_id": 101337516,
"request": {
"url": "https://example.com/",
"component": "pages",
"action": "home",
"params": {
"controller": "pages",
"action": "home"
},
"session": {},
"context": {}
},
"backtrace": [
{
"number": "81",
"file": "[GEM_ROOT]/gems/activerecord-7.0.7.2/lib/active_record/connection_adapters/postgresql_adapter.rb",
"method": "rescue in new_client",
"source": {
"79": " rescue ::PG::Error => error\n",
"80": " if conn_params && conn_params[:dbname] && error.message.include?(conn_params[:dbname])\n",
"81": " raise ActiveRecord::NoDatabaseError.db_error(conn_params[:dbname])\n",
"82": " elsif conn_params && conn_params[:user] && error.message.include?(conn_params[:user])\n",
"83": " raise ActiveRecord::DatabaseConnectionError.username_error(conn_params[:user])\n"
},
"context": "all"
},
{
"number": "77",
"file": "[GEM_ROOT]/gems/activerecord-7.0.7.2/lib/active_record/connection_adapters/postgresql_adapter.rb",
"method": "new_client",
"source": {
"75": "\n",
"76": " class << self\n",
"77": " def new_client(conn_params)\n",
"78": " PG.connect(**conn_params)\n",
"79": " rescue ::PG::Error => error\n"
},
"context": "all"
},
{
"number": "37",
"file": "[GEM_ROOT]/gems/activerecord-7.0.7.2/lib/active_record/connection_adapters/postgresql_adapter.rb",
"method": "postgresql_connection",
"source": {
"35": "\n",
"36": " ConnectionAdapters::PostgreSQLAdapter.new(\n",
"37": " ConnectionAdapters::PostgreSQLAdapter.new_client(conn_params),\n",
"38": " logger,\n",
"39": " conn_params,\n"
},
"context": "all"
},
{
"number": "656",
"file": "[GEM_ROOT]/gems/activerecord-7.0.7.2/lib/active_record/connection_adapters/abstract/connection_pool.rb",
"method": "public_send",
"source": {
"654": "\n",
"655": " def new_connection\n",
"656": " Base.public_send(db_config.adapter_method, db_config.configuration_hash).tap do |conn|\n",
"657": " conn.check_version\n",
"658": " end\n"
},
"context": "all"
},
{
"number": "656",
"file": "[GEM_ROOT]/gems/activerecord-7.0.7.2/lib/active_record/connection_adapters/abstract/connection_pool.rb",
"method": "new_connection",
"source": {
"654": "\n",
"655": " def new_connection\n",
"656": " Base.public_send(db_config.adapter_method, db_config.configuration_hash).tap do |conn|\n",
"657": " conn.check_version\n",
"658": " end\n"
},
"context": "all"
},
{
"number": "700",
"file": "[GEM_ROOT]/gems/activerecord-7.0.7.2/lib/active_record/connection_adapters/abstract/connection_pool.rb",
"method": "checkout_new_connection",
"source": {
"698": " def checkout_new_connection\n",
"699": " raise ConnectionNotEstablished unless @automatic_reconnect\n",
"700": " new_connection\n",
"701": " end\n",
"702": "\n"
},
"context": "all"
},
{
"number": "679",
"file": "[GEM_ROOT]/gems/activerecord-7.0.7.2/lib/active_record/connection_adapters/abstract/connection_pool.rb",
"method": "try_to_checkout_new_connection",
"source": {
"677": " # if successfully incremented @now_connecting establish new connection\n",
"678": " # outside of synchronized section\n",
"679": " conn = checkout_new_connection\n",
"680": " ensure\n",
"681": " synchronize do\n"
},
"context": "all"
},
{
"number": "640",
"file": "[GEM_ROOT]/gems/activerecord-7.0.7.2/lib/active_record/connection_adapters/abstract/connection_pool.rb",
"method": "acquire_connection",
"source": {
"638": " # and +try_to_checkout_new_connection+ we can piggyback on +synchronize+ sections\n",
"639": " # of the said methods and avoid an additional +synchronize+ overhead.\n",
"640": " if conn = @available.poll || try_to_checkout_new_connection\n",
"641": " conn\n",
"642": " else\n"
},
"context": "all"
},
{
"number": "341",
"file": "[GEM_ROOT]/gems/activerecord-7.0.7.2/lib/active_record/connection_adapters/abstract/connection_pool.rb",
"method": "checkout",
"source": {
"339": " # - ActiveRecord::ConnectionTimeoutError no connection can be obtained from the pool.\n",
"340": " def checkout(checkout_timeout = @checkout_timeout)\n",
"341": " checkout_and_verify(acquire_connection(checkout_timeout))\n",
"342": " end\n",
"343": "\n"
},
"context": "all"
},
{
"number": "181",
"file": "[GEM_ROOT]/gems/activerecord-7.0.7.2/lib/active_record/connection_adapters/abstract/connection_pool.rb",
"method": "connection",
"source": {
"179": " # held in a cache keyed by a thread.\n",
"180": " def connection\n",
"181": " @thread_cached_conns[connection_cache_key(current_thread)] ||= checkout\n",
"182": " end\n",
"183": "\n"
},
"context": "all"
},
{
"number": "211",
"file": "[GEM_ROOT]/gems/activerecord-7.0.7.2/lib/active_record/connection_adapters/abstract/connection_handler.rb",
"method": "retrieve_connection",
"source": {
"209": " end\n",
"210": "\n",
"211": " pool.connection\n",
"212": " end\n",
"213": "\n"
},
"context": "all"
},
{
"number": "313",
"file": "[GEM_ROOT]/gems/activerecord-7.0.7.2/lib/active_record/connection_handling.rb",
"method": "retrieve_connection",
"source": {
"311": "\n",
"312": " def retrieve_connection\n",
"313": " connection_handler.retrieve_connection(connection_specification_name, role: current_role, shard: current_shard)\n",
"314": " end\n",
"315": "\n"
},
"context": "all"
},
{
"number": "280",
"file": "[GEM_ROOT]/gems/activerecord-7.0.7.2/lib/active_record/connection_handling.rb",
"method": "connection",
"source": {
"278": " # to any of the specific Active Records.\n",
"279": " def connection\n",
"280": " retrieve_connection\n",
"281": " end\n",
"282": "\n"
},
"context": "all"
},
{
"number": "433",
"file": "[GEM_ROOT]/gems/activerecord-7.0.7.2/lib/active_record/core.rb",
"method": "cached_find_by_statement",
"source": {
"431": "\n",
"432": " def cached_find_by_statement(key, &block) # :nodoc:\n",
"433": " cache = @find_by_statement_cache[connection.prepared_statements]\n",
"434": " cache.compute_if_absent(key) { StatementCache.create(connection, &block) }\n",
"435": " end\n"
},
"context": "all"
},
{
"number": "317",
"file": "[GEM_ROOT]/gems/activerecord-7.0.7.2/lib/active_record/core.rb",
"method": "find_by",
"source": {
"315": "\n",
"316": " keys = hash.keys\n",
"317": " statement = cached_find_by_statement(keys) { |params|\n",
"318": " wheres = keys.index_with { params.bind }\n",
"319": " where(wheres).limit(1)\n"
},
"context": "all"
},
{
"number": "69",
"file": "[PROJECT_ROOT]/app/controllers/application_controller.rb",
"method": "check_redirect",
"source": {
"67": "\n",
"68": " def check_redirect\n",
"69": " return unless (redirect = Redirect.find_by(slug: request.path.sub(%r{^/}, \"\")))\n",
"70": " redirect_to redirect.url\n",
"71": " end\n"
},
"application_file": "app/controllers/application_controller.rb",
"context": "app"
},
{
"number": "400",
"file": "[GEM_ROOT]/gems/activesupport-7.0.7.2/lib/active_support/callbacks.rb",
"method": "block in make_lambda",
"source": {
"398": " def make_lambda\n",
"399": " lambda do |target, value, &block|\n",
"400": " target.send(@method_name, &block)\n",
"401": " end\n",
"402": " end\n"
},
"context": "all"
},
{
"number": "180",
"file": "[GEM_ROOT]/gems/activesupport-7.0.7.2/lib/active_support/callbacks.rb",
"method": "block (2 levels) in halting_and_conditional",
"source": {
"178": "\n",
"179": " if !halted && user_conditions.all? { |c| c.call(target, value) }\n",
"180": " result_lambda = -> { user_callback.call target, value }\n",
"181": " env.halted = halted_lambda.call(target, result_lambda)\n",
"182": " if env.halted\n"
},
"context": "all"
},
{
"number": "34",
"file": "[GEM_ROOT]/gems/actionpack-7.0.7.2/lib/abstract_controller/callbacks.rb",
"method": "block (2 levels) in ",
"source": {
"32": " included do\n",
"33": " define_callbacks :process_action,\n",
"34": " terminator: ->(controller, result_lambda) { result_lambda.call; controller.performed? },\n",
"35": " skip_after_callbacks_if_terminated: true\n",
"36": " end\n"
},
"context": "all"
},
{
"number": "181",
"file": "[GEM_ROOT]/gems/activesupport-7.0.7.2/lib/active_support/callbacks.rb",
"method": "block in halting_and_conditional",
"source": {
"179": " if !halted && user_conditions.all? { |c| c.call(target, value) }\n",
"180": " result_lambda = -> { user_callback.call target, value }\n",
"181": " env.halted = halted_lambda.call(target, result_lambda)\n",
"182": " if env.halted\n",
"183": " target.send :halted_callback_hook, filter, name\n"
},
"context": "all"
},
{
"number": "595",
"file": "[GEM_ROOT]/gems/activesupport-7.0.7.2/lib/active_support/callbacks.rb",
"method": "block in invoke_before",
"source": {
"593": "\n",
"594": " def invoke_before(arg)\n",
"595": " @before.each { |b| b.call(arg) }\n",
"596": " end\n",
"597": "\n"
},
"context": "all"
},
{
"number": "595",
"file": "[GEM_ROOT]/gems/activesupport-7.0.7.2/lib/active_support/callbacks.rb",
"method": "each",
"source": {
"593": "\n",
"594": " def invoke_before(arg)\n",
"595": " @before.each { |b| b.call(arg) }\n",
"596": " end\n",
"597": "\n"
},
"context": "all"
},
{
"number": "595",
"file": "[GEM_ROOT]/gems/activesupport-7.0.7.2/lib/active_support/callbacks.rb",
"method": "invoke_before",
"source": {
"593": "\n",
"594": " def invoke_before(arg)\n",
"595": " @before.each { |b| b.call(arg) }\n",
"596": " end\n",
"597": "\n"
},
"context": "all"
},
{
"number": "106",
"file": "[GEM_ROOT]/gems/activesupport-7.0.7.2/lib/active_support/callbacks.rb",
"method": "run_callbacks",
"source": {
"104": " # Common case: no 'around' callbacks defined\n",
"105": " if next_sequence.final?\n",
"106": " next_sequence.invoke_before(env)\n",
"107": " env.value = !env.halted && (!block_given? || yield)\n",
"108": " next_sequence.invoke_after(env)\n"
},
"context": "all"
},
{
"number": "233",
"file": "[GEM_ROOT]/gems/actionpack-7.0.7.2/lib/abstract_controller/callbacks.rb",
"method": "process_action",
"source": {
"231": " # process_action callbacks around the normal behavior.\n",
"232": " def process_action(...)\n",
"233": " run_callbacks(:process_action) do\n",
"234": " super\n",
"235": " end\n"
},
"context": "all"
},
{
"number": "23",
"file": "[GEM_ROOT]/gems/actionpack-7.0.7.2/lib/action_controller/metal/rescue.rb",
"method": "process_action",
"source": {
"21": " private\n",
"22": " def process_action(*)\n",
"23": " super\n",
"24": " rescue Exception => exception\n",
"25": " request.env[\"action_dispatch.show_detailed_exceptions\"] ||= show_detailed_exceptions?\n"
},
"context": "all"
},
{
"number": "67",
"file": "[GEM_ROOT]/gems/actionpack-7.0.7.2/lib/action_controller/metal/instrumentation.rb",
"method": "block in process_action",
"source": {
"65": "\n",
"66": " ActiveSupport::Notifications.instrument(\"process_action.action_controller\", raw_payload) do |payload|\n",
"67": " result = super\n",
"68": " payload[:response] = response\n",
"69": " payload[:status] = response.status\n"
},
"context": "all"
},
{
"number": "206",
"file": "[GEM_ROOT]/gems/activesupport-7.0.7.2/lib/active_support/notifications.rb",
"method": "block in instrument",
"source": {
"204": " def instrument(name, payload = {})\n",
"205": " if notifier.listening?(name)\n",
"206": " instrumenter.instrument(name, payload) { yield payload if block_given? }\n",
"207": " else\n",
"208": " yield payload if block_given?\n"
},
"context": "all"
},
{
"number": "24",
"file": "[GEM_ROOT]/gems/activesupport-7.0.7.2/lib/active_support/notifications/instrumenter.rb",
"method": "instrument",
"source": {
"22": " listeners_state = start name, payload\n",
"23": " begin\n",
"24": " yield payload if block_given?\n",
"25": " rescue Exception => e\n",
"26": " payload[:exception] = [e.class.name, e.message]\n"
},
"context": "all"
},
{
"number": "206",
"file": "[GEM_ROOT]/gems/activesupport-7.0.7.2/lib/active_support/notifications.rb",
"method": "instrument",
"source": {
"204": " def instrument(name, payload = {})\n",
"205": " if notifier.listening?(name)\n",
"206": " instrumenter.instrument(name, payload) { yield payload if block_given? }\n",
"207": " else\n",
"208": " yield payload if block_given?\n"
},
"context": "all"
},
{
"number": "66",
"file": "[GEM_ROOT]/gems/actionpack-7.0.7.2/lib/action_controller/metal/instrumentation.rb",
"method": "process_action",
"source": {
"64": " ActiveSupport::Notifications.instrument(\"start_processing.action_controller\", raw_payload)\n",
"65": "\n",
"66": " ActiveSupport::Notifications.instrument(\"process_action.action_controller\", raw_payload) do |payload|\n",
"67": " result = super\n",
"68": " payload[:response] = response\n"
},
"context": "all"
},
{
"number": "259",
"file": "[GEM_ROOT]/gems/actionpack-7.0.7.2/lib/action_controller/metal/params_wrapper.rb",
"method": "process_action",
"source": {
"257": " def process_action(*)\n",
"258": " _perform_parameter_wrapping if _wrapper_enabled?\n",
"259": " super\n",
"260": " end\n",
"261": "\n"
},
"context": "all"
},
{
"number": "27",
"file": "[GEM_ROOT]/gems/activerecord-7.0.7.2/lib/active_record/railties/controller_runtime.rb",
"method": "process_action",
"source": {
"25": " # and it won't be cleaned up by the method below.\n",
"26": " ActiveRecord::LogSubscriber.reset_runtime\n",
"27": " super\n",
"28": " end\n",
"29": "\n"
},
"context": "all"
},
{
"number": "120",
"file": "[GEM_ROOT]/gems/scout_apm-5.3.5/lib/scout_apm/instruments/action_controller_rails_3_rails4.rb",
"method": "process_action",
"source": {
"118": " req.start_layer( ScoutApm::Layer.new(\"Controller\", \"#{controller_path}/#{resolved_name}\") )\n",
"119": " begin\n",
"120": " super\n",
"121": " rescue\n",
"122": " req.error!\n"
},
"context": "all"
},
{
"number": "151",
"file": "[GEM_ROOT]/gems/actionpack-7.0.7.2/lib/abstract_controller/base.rb",
"method": "process",
"source": {
"149": " @_response_body = nil\n",
"150": "\n",
"151": " process_action(action_name, *args)\n",
"152": " end\n",
"153": " ruby2_keywords(:process)\n"
},
"context": "all"
},
{
"number": "39",
"file": "[GEM_ROOT]/gems/actionview-7.0.7.2/lib/action_view/rendering.rb",
"method": "process",
"source": {
"37": " def process(...) # :nodoc:\n",
"38": " old_config, I18n.config = I18n.config, I18nProxy.new(I18n.config, lookup_context)\n",
"39": " super\n",
"40": " ensure\n",
"41": " I18n.config = old_config\n"
},
"context": "all"
},
{
"number": "188",
"file": "[GEM_ROOT]/gems/actionpack-7.0.7.2/lib/action_controller/metal.rb",
"method": "dispatch",
"source": {
"186": " set_request!(request)\n",
"187": " set_response!(response)\n",
"188": " process(name)\n",
"189": " request.commit_flash\n",
"190": " to_a\n"
},
"context": "all"
},
{
"number": "251",
"file": "[GEM_ROOT]/gems/actionpack-7.0.7.2/lib/action_controller/metal.rb",
"method": "dispatch",
"source": {
"249": " middleware_stack.build(name) { |env| new.dispatch(name, req, res) }.call req.env\n",
"250": " else\n",
"251": " new.dispatch(name, req, res)\n",
"252": " end\n",
"253": " end\n"
},
"context": "all"
},
{
"number": "49",
"file": "[GEM_ROOT]/gems/actionpack-7.0.7.2/lib/action_dispatch/routing/route_set.rb",
"method": "dispatch",
"source": {
"47": "\n",
"48": " def dispatch(controller, action, req, res)\n",
"49": " controller.dispatch(action, req, res)\n",
"50": " end\n",
"51": " end\n"
},
"context": "all"
},
{
"number": "32",
"file": "[GEM_ROOT]/gems/actionpack-7.0.7.2/lib/action_dispatch/routing/route_set.rb",
"method": "serve",
"source": {
"30": " controller = controller req\n",
"31": " res = controller.make_response! req\n",
"32": " dispatch(controller, params[:action], req, res)\n",
"33": " rescue ActionController::RoutingError\n",
"34": " if @raise_on_name_error\n"
},
"context": "all"
},
{
"number": "50",
"file": "[GEM_ROOT]/gems/actionpack-7.0.7.2/lib/action_dispatch/journey/router.rb",
"method": "block in serve",
"source": {
"48": " req.path_parameters = tmp_params\n",
"49": "\n",
"50": " status, headers, body = route.app.serve(req)\n",
"51": "\n",
"52": " if \"pass\" == headers[\"X-Cascade\"]\n"
},
"context": "all"
},
{
"number": "32",
"file": "[GEM_ROOT]/gems/actionpack-7.0.7.2/lib/action_dispatch/journey/router.rb",
"method": "each",
"source": {
"30": "\n",
"31": " def serve(req)\n",
"32": " find_routes(req).each do |match, parameters, route|\n",
"33": " set_params = req.path_parameters\n",
"34": " path_info = req.path_info\n"
},
"context": "all"
},
{
"number": "32",
"file": "[GEM_ROOT]/gems/actionpack-7.0.7.2/lib/action_dispatch/journey/router.rb",
"method": "serve",
"source": {
"30": "\n",
"31": " def serve(req)\n",
"32": " find_routes(req).each do |match, parameters, route|\n",
"33": " set_params = req.path_parameters\n",
"34": " path_info = req.path_info\n"
},
"context": "all"
},
{
"number": "852",
"file": "[GEM_ROOT]/gems/actionpack-7.0.7.2/lib/action_dispatch/routing/route_set.rb",
"method": "call",
"source": {
"850": " req = make_request(env)\n",
"851": " req.path_info = Journey::Router::Utils.normalize_path(req.path_info)\n",
"852": " @router.serve(req)\n",
"853": " end\n",
"854": "\n"
},
"context": "all"
},
{
"number": "29",
"file": "[GEM_ROOT]/gems/scout_apm-5.3.5/lib/scout_apm/instruments/rails_router.rb",
"method": "call_with_scout_instruments",
"source": {
"27": "\n",
"28": " begin\n",
"29": " call_without_scout_instruments(*args)\n",
"30": " ensure\n",
"31": " req.stop_layer\n"
},
"context": "all"
},
{
"number": "17",
"file": "[GEM_ROOT]/gems/scout_apm-5.3.5/lib/scout_apm/middleware.rb",
"method": "call",
"source": {
"15": " def call(env)\n",
"16": " if !@enabled || @started || @attempts > MAX_ATTEMPTS\n",
"17": " @app.call(env)\n",
"18": " else\n",
"19": " attempt_to_start_agent\n"
},
"context": "all"
},
{
"number": "36",
"file": "[GEM_ROOT]/gems/warden-1.2.9/lib/warden/manager.rb",
"method": "block in call",
"source": {
"34": " result = catch(:warden) do\n",
"35": " env['warden'].on_request\n",
"36": " @app.call(env)\n",
"37": " end\n",
"38": "\n"
},
"context": "all"
},
{
"number": "34",
"file": "[GEM_ROOT]/gems/warden-1.2.9/lib/warden/manager.rb",
"method": "catch",
"source": {
"32": "\n",
"33": " env['warden'] = Proxy.new(env, self)\n",
"34": " result = catch(:warden) do\n",
"35": " env['warden'].on_request\n",
"36": " @app.call(env)\n"
},
"context": "all"
},
{
"number": "34",
"file": "[GEM_ROOT]/gems/warden-1.2.9/lib/warden/manager.rb",
"method": "call",
"source": {
"32": "\n",
"33": " env['warden'] = Proxy.new(env, self)\n",
"34": " result = catch(:warden) do\n",
"35": " env['warden'].on_request\n",
"36": " @app.call(env)\n"
},
"context": "all"
},
{
"number": "15",
"file": "[GEM_ROOT]/gems/rack-2.2.8/lib/rack/tempfile_reaper.rb",
"method": "call",
"source": {
"13": " def call(env)\n",
"14": " env[RACK_TEMPFILES] ||= []\n",
"15": " status, headers, body = @app.call(env)\n",
"16": " body_proxy = BodyProxy.new(body) do\n",
"17": " env[RACK_TEMPFILES].each(&:close!) unless env[RACK_TEMPFILES].nil?\n"
},
"context": "all"
},
{
"number": "27",
"file": "[GEM_ROOT]/gems/rack-2.2.8/lib/rack/conditional_get.rb",
"method": "call",
"source": {
"25": " case env[REQUEST_METHOD]\n",
"26": " when \"GET\", \"HEAD\"\n",
"27": " status, headers, body = @app.call(env)\n",
"28": " headers = Utils::HeaderHash[headers]\n",
"29": " if status == 200 && fresh?(env, headers)\n"
},
"context": "all"
},
{
"number": "12",
"file": "[GEM_ROOT]/gems/rack-2.2.8/lib/rack/head.rb",
"method": "call",
"source": {
"10": "\n",
"11": " def call(env)\n",
"12": " status, headers, body = @app.call(env)\n",
"13": "\n",
"14": " if env[REQUEST_METHOD] == HEAD\n"
},
"context": "all"
},
{
"number": "38",
"file": "[GEM_ROOT]/gems/actionpack-7.0.7.2/lib/action_dispatch/http/permissions_policy.rb",
"method": "call",
"source": {
"36": " def call(env)\n",
"37": " request = ActionDispatch::Request.new(env)\n",
"38": " _, headers, _ = response = @app.call(env)\n",
"39": "\n",
"40": " return response unless html_response?(headers)\n"
},
"context": "all"
},
{
"number": "36",
"file": "[GEM_ROOT]/gems/actionpack-7.0.7.2/lib/action_dispatch/http/content_security_policy.rb",
"method": "call",
"source": {
"34": " def call(env)\n",
"35": " request = ActionDispatch::Request.new env\n",
"36": " status, headers, _ = response = @app.call(env)\n",
"37": "\n",
"38": " # Returning CSP headers with a 304 Not Modified is harmful, since nonces in the new\n"
},
"context": "all"
},
{
"number": "266",
"file": "[GEM_ROOT]/gems/rack-2.2.8/lib/rack/session/abstract/id.rb",
"method": "context",
"source": {
"264": " req = make_request env\n",
"265": " prepare_session(req)\n",
"266": " status, headers, body = app.call(req.env)\n",
"267": " res = Rack::Response::Raw.new status, headers\n",
"268": " commit_session(req, res)\n"
},
"context": "all"
},
{
"number": "260",
"file": "[GEM_ROOT]/gems/rack-2.2.8/lib/rack/session/abstract/id.rb",
"method": "call",
"source": {
"258": "\n",
"259": " def call(env)\n",
"260": " context(env)\n",
"261": " end\n",
"262": "\n"
},
"context": "all"
},
{
"number": "704",
"file": "[GEM_ROOT]/gems/actionpack-7.0.7.2/lib/action_dispatch/middleware/cookies.rb",
"method": "call",
"source": {
"702": " request = ActionDispatch::Request.new env\n",
"703": "\n",
"704": " status, headers, body = @app.call(env)\n",
"705": "\n",
"706": " if request.have_cookie_jar?\n"
},
"context": "all"
},
{
"number": "27",
"file": "[GEM_ROOT]/gems/actionpack-7.0.7.2/lib/action_dispatch/middleware/callbacks.rb",
"method": "block in call",
"source": {
"25": " error = nil\n",
"26": " result = run_callbacks :call do\n",
"27": " @app.call(env)\n",
"28": " rescue => error\n",
"29": " end\n"
},
"context": "all"
},
{
"number": "99",
"file": "[GEM_ROOT]/gems/activesupport-7.0.7.2/lib/active_support/callbacks.rb",
"method": "run_callbacks",
"source": {
"97": "\n",
"98": " if callbacks.empty?\n",
"99": " yield if block_given?\n",
"100": " else\n",
"101": " env = Filters::Environment.new(self, false, nil)\n"
},
"context": "all"
},
{
"number": "26",
"file": "[GEM_ROOT]/gems/actionpack-7.0.7.2/lib/action_dispatch/middleware/callbacks.rb",
"method": "call",
"source": {
"24": " def call(env)\n",
"25": " error = nil\n",
"26": " result = run_callbacks :call do\n",
"27": " @app.call(env)\n",
"28": " rescue => error\n"
},
"context": "all"
},
{
"number": "28",
"file": "[GEM_ROOT]/gems/actionpack-7.0.7.2/lib/action_dispatch/middleware/debug_exceptions.rb",
"method": "call",
"source": {
"26": " def call(env)\n",
"27": " request = ActionDispatch::Request.new env\n",
"28": " _, headers, body = response = @app.call(env)\n",
"29": "\n",
"30": " if headers[\"X-Cascade\"] == \"pass\"\n"
},
"context": "all"
},
{
"number": "29",
"file": "[GEM_ROOT]/gems/actionpack-7.0.7.2/lib/action_dispatch/middleware/show_exceptions.rb",
"method": "call",
"source": {
"27": " def call(env)\n",
"28": " request = ActionDispatch::Request.new env\n",
"29": " @app.call(env)\n",
"30": " rescue Exception => exception\n",
"31": " if request.show_exceptions?\n"
},
"context": "all"
},
{
"number": "18",
"file": "[GEM_ROOT]/gems/lograge-0.12.0/lib/lograge/rails_ext/rack/logger.rb",
"method": "call_app",
"source": {
"16": " def call_app(*args)\n",
"17": " env = args.last\n",
"18": " status, headers, body = @app.call(env)\n",
"19": " # needs to have same return type as the Rails builtins being overridden, see https://github.com/roidrage/lograge/pull/333\n",
"20": " # https://github.com/rails/rails/blob/be9d34b9bcb448b265114ebc28bef1a5b5e4c272/railties/lib/rails/rack/logger.rb#L37\n"
},
"context": "all"
},
{
"number": "25",
"file": "[GEM_ROOT]/gems/railties-7.0.7.2/lib/rails/rack/logger.rb",
"method": "block in call",
"source": {
"23": "\n",
"24": " if logger.respond_to?(:tagged)\n",
"25": " logger.tagged(compute_tags(request)) { call_app(request, env) }\n",
"26": " else\n",
"27": " call_app(request, env)\n"
},
"context": "all"
},
{
"number": "99",
"file": "[GEM_ROOT]/gems/activesupport-7.0.7.2/lib/active_support/tagged_logging.rb",
"method": "block in tagged",
"source": {
"97": " def tagged(*tags)\n",
"98": " if block_given?\n",
"99": " formatter.tagged(*tags) { yield self }\n",
"100": " else\n",
"101": " logger = ActiveSupport::TaggedLogging.new(self)\n"
},
"context": "all"
},
{
"number": "37",
"file": "[GEM_ROOT]/gems/activesupport-7.0.7.2/lib/active_support/tagged_logging.rb",
"method": "tagged",
"source": {
"35": " def tagged(*tags)\n",
"36": " new_tags = push_tags(*tags)\n",
"37": " yield self\n",
"38": " ensure\n",
"39": " pop_tags(new_tags.size)\n"
},
"context": "all"
},
{
"number": "99",
"file": "[GEM_ROOT]/gems/activesupport-7.0.7.2/lib/active_support/tagged_logging.rb",
"method": "tagged",
"source": {
"97": " def tagged(*tags)\n",
"98": " if block_given?\n",
"99": " formatter.tagged(*tags) { yield self }\n",
"100": " else\n",
"101": " logger = ActiveSupport::TaggedLogging.new(self)\n"
},
"context": "all"
},
{
"number": "25",
"file": "[GEM_ROOT]/gems/railties-7.0.7.2/lib/rails/rack/logger.rb",
"method": "call",
"source": {
"23": "\n",
"24": " if logger.respond_to?(:tagged)\n",
"25": " logger.tagged(compute_tags(request)) { call_app(request, env) }\n",
"26": " else\n",
"27": " call_app(request, env)\n"
},
"context": "all"
},
{
"number": "93",
"file": "[GEM_ROOT]/gems/actionpack-7.0.7.2/lib/action_dispatch/middleware/remote_ip.rb",
"method": "call",
"source": {
"91": " req = ActionDispatch::Request.new env\n",
"92": " req.remote_ip = GetIp.new(req, check_ip, proxies)\n",
"93": " @app.call(req.env)\n",
"94": " end\n",
"95": "\n"
},
"context": "all"
},
{
"number": "19",
"file": "[GEM_ROOT]/gems/request_store-1.5.1/lib/request_store/middleware.rb",
"method": "call",
"source": {
"17": " RequestStore.begin!\r\n",
"18": "\r\n",
"19": " status, headers, body = @app.call(env)\r\n",
"20": "\r\n",
"21": " body = Rack::BodyProxy.new(body) do\r\n"
},
"context": "all"
},
{
"number": "26",
"file": "[GEM_ROOT]/gems/actionpack-7.0.7.2/lib/action_dispatch/middleware/request_id.rb",
"method": "call",
"source": {
"24": " req = ActionDispatch::Request.new env\n",
"25": " req.request_id = make_request_id(req.headers[@header])\n",
"26": " @app.call(env).tap { |_status, headers, _body| headers[@header] = req.request_id }\n",
"27": " end\n",
"28": "\n"
},
"context": "all"
},
{
"number": "24",
"file": "[GEM_ROOT]/gems/rack-2.2.8/lib/rack/method_override.rb",
"method": "call",
"source": {
"22": " end\n",
"23": "\n",
"24": " @app.call(env)\n",
"25": " end\n",
"26": "\n"
},
"context": "all"
},
{
"number": "22",
"file": "[GEM_ROOT]/gems/rack-2.2.8/lib/rack/runtime.rb",
"method": "call",
"source": {
"20": " def call(env)\n",
"21": " start_time = Utils.clock_time\n",
"22": " status, headers, body = @app.call(env)\n",
"23": " headers = Utils::HeaderHash[headers]\n",
"24": "\n"
},
"context": "all"
},
{
"number": "148",
"file": "[GEM_ROOT]/gems/rack-timeout-0.6.3/lib/rack/timeout/core.rb",
"method": "block in call",
"source": {
"146": "\n",
"147": " response = timeout.timeout(info.timeout) do # perform request with timeout\n",
"148": " begin @app.call(env) # boom, send request down the middleware chain\n",
"149": " rescue RequestTimeoutException => e # will actually hardly ever get to this point because frameworks tend to catch this. see README for more\n",
"150": " raise RequestTimeoutError.new(env), e.message, e.backtrace # but in case it does get here, re-raise RequestTimeoutException as RequestTimeoutError\n"
},
"context": "all"
},
{
"number": "19",
"file": "[GEM_ROOT]/gems/rack-timeout-0.6.3/lib/rack/timeout/support/timeout.rb",
"method": "timeout",
"source": {
"17": " thr = Thread.current # reference to current thread to be used in timeout thread\n",
"18": " job = @scheduler.run_in(secs) { @on_timeout.call thr } # schedule this thread to be timed out; should get cancelled if block completes on time\n",
"19": " return block.call # do what you gotta do\n",
"20": " ensure #\n",
"21": " job.cancel! if job # cancel the scheduled timeout job; if the block completed on time, this\n"
},
"context": "all"
},
{
"number": "147",
"file": "[GEM_ROOT]/gems/rack-timeout-0.6.3/lib/rack/timeout/core.rb",
"method": "call",
"source": {
"145": " end\n",
"146": "\n",
"147": " response = timeout.timeout(info.timeout) do # perform request with timeout\n",
"148": " begin @app.call(env) # boom, send request down the middleware chain\n",
"149": " rescue RequestTimeoutException => e # will actually hardly ever get to this point because frameworks tend to catch this. see README for more\n"
},
"context": "all"
},
{
"number": "41",
"file": "[GEM_ROOT]/gems/judoscale-ruby-1.4.1/lib/judoscale/request_middleware.rb",
"method": "call",
"source": {
"39": " end\n",
"40": "\n",
"41": " @app.call(env)\n",
"42": " end\n",
"43": " end\n"
},
"context": "all"
},
{
"number": "29",
"file": "[GEM_ROOT]/gems/activesupport-7.0.7.2/lib/active_support/cache/strategy/local_cache_middleware.rb",
"method": "call",
"source": {
"27": " def call(env)\n",
"28": " LocalCacheRegistry.set_cache_for(local_cache_key, LocalStore.new)\n",
"29": " response = @app.call(env)\n",
"30": " response[2] = ::Rack::BodyProxy.new(response[2]) do\n",
"31": " LocalCacheRegistry.set_cache_for(local_cache_key, nil)\n"
},
"context": "all"
},
{
"number": "24",
"file": "[GEM_ROOT]/gems/rack-rewrite-1.5.1/lib/rack/rewrite.rb",
"method": "call",
"source": {
"22": " return rack_response unless rack_response === true\n",
"23": " end\n",
"24": " @app.call(env)\n",
"25": " end\n",
"26": " \n"
},
"context": "all"
},
{
"number": "14",
"file": "[GEM_ROOT]/gems/actionpack-7.0.7.2/lib/action_dispatch/middleware/executor.rb",
"method": "call",
"source": {
"12": " state = @executor.run!(reset: true)\n",
"13": " begin\n",
"14": " response = @app.call(env)\n",
"15": " returned = response << ::Rack::BodyProxy.new(response.pop) { state.complete! }\n",
"16": " rescue => error\n"
},
"context": "all"
},
{
"number": "23",
"file": "[GEM_ROOT]/gems/actionpack-7.0.7.2/lib/action_dispatch/middleware/static.rb",
"method": "call",
"source": {
"21": "\n",
"22": " def call(env)\n",
"23": " @file_handler.attempt(env) || @app.call(env)\n",
"24": " end\n",
"25": " end\n"
},
"context": "all"
},
{
"number": "110",
"file": "[GEM_ROOT]/gems/rack-2.2.8/lib/rack/sendfile.rb",
"method": "call",
"source": {
"108": "\n",
"109": " def call(env)\n",
"110": " status, headers, body = @app.call(env)\n",
"111": " if body.respond_to?(:to_path)\n",
"112": " case type = variation(env)\n"
},
"context": "all"
},
{
"number": "77",
"file": "[GEM_ROOT]/gems/actionpack-7.0.7.2/lib/action_dispatch/middleware/ssl.rb",
"method": "call",
"source": {
"75": "\n",
"76": " if request.ssl?\n",
"77": " @app.call(env).tap do |status, headers, body|\n",
"78": " set_hsts_header! headers\n",
"79": " flag_cookies_as_secure! headers if @secure_cookies && !@exclude.call(request)\n"
},
"context": "all"
},
{
"number": "131",
"file": "[GEM_ROOT]/gems/actionpack-7.0.7.2/lib/action_dispatch/middleware/host_authorization.rb",
"method": "call",
"source": {
"129": "\n",
"130": " def call(env)\n",
"131": " return @app.call(env) if @permissions.empty?\n",
"132": "\n",
"133": " request = Request.new(env)\n"
},
"context": "all"
},
{
"number": "58",
"file": "[GEM_ROOT]/gems/scout_apm-5.3.5/lib/scout_apm/instruments/middleware_summary.rb",
"method": "call",
"source": {
"56": " layer = ScoutApm::Layer.new(\"Middleware\", \"Summary\")\n",
"57": " req.start_layer(layer)\n",
"58": " @app.call(env)\n",
"59": " ensure\n",
"60": " req.stop_layer\n"
},
"context": "all"
},
{
"number": "530",
"file": "[GEM_ROOT]/gems/railties-7.0.7.2/lib/rails/engine.rb",
"method": "call",
"source": {
"528": " def call(env)\n",
"529": " req = build_request env\n",
"530": " app.call req.env\n",
"531": " end\n",
"532": "\n"
},
"context": "all"
},
{
"number": "270",
"file": "[GEM_ROOT]/gems/puma-6.3.1/lib/puma/configuration.rb",
"method": "call",
"source": {
"268": " def call(env)\n",
"269": " env[Const::PUMA_CONFIG] = @config\n",
"270": " @app.call(env)\n",
"271": " end\n",
"272": " end\n"
},
"context": "all"
},
{
"number": "100",
"file": "[GEM_ROOT]/gems/puma-6.3.1/lib/puma/request.rb",
"method": "block in handle_request",
"source": {
"98": " if @supported_http_methods == :any || @supported_http_methods.key?(env[REQUEST_METHOD])\n",
"99": " status, headers, app_body = @thread_pool.with_force_shutdown do\n",
"100": " @app.call(env)\n",
"101": " end\n",
"102": " else\n"
},
"context": "all"
},
{
"number": "344",
"file": "[GEM_ROOT]/gems/puma-6.3.1/lib/puma/thread_pool.rb",
"method": "with_force_shutdown",
"source": {
"342": " t[:with_force_shutdown] = true\n",
"343": " end\n",
"344": " yield\n",
"345": " ensure\n",
"346": " t[:with_force_shutdown] = false\n"
},
"context": "all"
},
{
"number": "99",
"file": "[GEM_ROOT]/gems/puma-6.3.1/lib/puma/request.rb",
"method": "handle_request",
"source": {
"97": " begin\n",
"98": " if @supported_http_methods == :any || @supported_http_methods.key?(env[REQUEST_METHOD])\n",
"99": " status, headers, app_body = @thread_pool.with_force_shutdown do\n",
"100": " @app.call(env)\n",
"101": " end\n"
},
"context": "all"
},
{
"number": "443",
"file": "[GEM_ROOT]/gems/puma-6.3.1/lib/puma/server.rb",
"method": "process_client",
"source": {
"441": " while true\n",
"442": " @requests_count += 1\n",
"443": " case handle_request(client, requests + 1)\n",
"444": " when false\n",
"445": " break\n"
},
"context": "all"
},
{
"number": "245",
"file": "[GEM_ROOT]/gems/puma-6.3.1/lib/puma/server.rb",
"method": "block in run",
"source": {
"243": " @status = :run\n",
"244": "\n",
"245": " @thread_pool = ThreadPool.new(thread_name, @options) { |client| process_client client }\n",
"246": "\n",
"247": " if @queue_requests\n"
},
"context": "all"
},
{
"number": "151",
"file": "[GEM_ROOT]/gems/puma-6.3.1/lib/puma/thread_pool.rb",
"method": "block in spawn_thread",
"source": {
"149": "\n",
"150": " begin\n",
"151": " @out_of_band_pending = true if block.call(work)\n",
"152": " rescue Exception => e\n",
"153": " STDERR.puts \"Error reached top of thread-pool: #{e.message} (#{e.class})\"\n"
},
"context": "all"
}
],
"application_trace": [
{
"number": "69",
"file": "[PROJECT_ROOT]/app/controllers/application_controller.rb",
"method": "check_redirect",
"source": {
"67": "\n",
"68": " def check_redirect\n",
"69": " return unless (redirect = Redirect.find_by(slug: request.path.sub(%r{^/}, \"\")))\n",
"70": " redirect_to redirect.url\n",
"71": " end\n"
},
"application_file": "app/controllers/application_controller.rb",
"context": "app"
}
],
"web_environment": {
"SERVER_SOFTWARE": "puma 6.3.1 Mugi No Toki Itaru",
"GATEWAY_INTERFACE": "CGI/1.2",
"REQUEST_METHOD": "GET",
"SERVER_PROTOCOL": "HTTP/1.1",
"HTTP_HOST": "example.com",
"HTTP_CONNECTION": "close",
"HTTP_USER_AGENT": "Amazon CloudFront",
"HTTP_X_AMZ_CF_ID": "yai2eezeewaipahthieN-Yt3y0gAunRuwBHH8A==",
"HTTP_IF_NONE_MATCH": "W/\"fde6ca645252fa81edfdae38dbeef178\"",
"HTTP_ACCEPT": "text/html,application/xhtml+xml,application/xml;q=0.9,image/avif,image/webp,image/apng,*/*;q=0.8,application/signed-exchange;v=b3;q=0.7",
"HTTP_X_FORWARDED_FOR": "199.175.219.155, 64.252.73.106",
"HTTP_VIA": "2.0 yai2eezeewaipahthieN.cloudfront.net (CloudFront), 1.1 vegur",
"HTTP_ACCEPT_ENCODING": "gzip",
"HTTP_IF_MODIFIED_SINCE": "Wed, 11 Oct 2023 20:51:58 GMT",
"HTTP_SEC_CH_UA": "\"Google Chrome\";v=\"117\", \"Not;A=Brand\";v=\"8\", \"Chromium\";v=\"117\"",
"HTTP_SEC_CH_UA_MOBILE": "?0",
"HTTP_SEC_CH_UA_PLATFORM": "\"Windows\"",
"HTTP_UPGRADE_INSECURE_REQUESTS": "1",
"HTTP_SEC_PURPOSE": "prefetch;prerender",
"HTTP_PURPOSE": "prefetch",
"HTTP_SEC_FETCH_SITE": "none",
"HTTP_SEC_FETCH_MODE": "navigate",
"HTTP_SEC_FETCH_USER": "?1",
"HTTP_SEC_FETCH_DEST": "document",
"HTTP_X_REQUEST_ID": "fb536bf3-76d0-4936-a354-2a3d023b2cf4",
"HTTP_X_FORWARDED_PROTO": "https",
"HTTP_X_FORWARDED_PORT": "443",
"HTTP_CONNECT_TIME": "1",
"HTTP_X_REQUEST_START": "1697220489932",
"HTTP_TOTAL_ROUTE_TIME": "0",
"SERVER_NAME": "example.com",
"SERVER_PORT": "443",
"REMOTE_ADDR": "10.1.5.53",
"HTTP_VERSION": "HTTP/1.1"
},
"deploy": {
"environment": "production",
"revision": "0eaf61a9ec756be9f4bb511ad71b37baaa9b73ba",
"repository": "https://github.com/spacely/testy-mctestface",
"local_username": "ben@example.com",
"created_at": "2023-10-06T20:52:51.878336Z",
"changelog": [],
"url": "https://github.com/spacely/testy-mctestface/compare/d4f90c876adf4a108ebb9a6f47b5562b59578d97...0eaf61a9ec756be9f4bb511ad71b37baaa9b73ba"
},
"url": "https://app.honeybadger.io/projects/123321/faults/101337516/01HCN3JWWXRQX511BB83WM2X95"
}
}
```
# Error resolved event payload
> Sent when an error is marked as resolved.
Sent when an error is marked as resolved.
```json
{
"event": "resolved",
"message": "[Testy McTestFace/production] ActiveRecord::NoDatabaseError resolved by ",
"fault": {
"project_id": 123321,
"klass": "ActiveRecord::NoDatabaseError",
"component": "pages",
"action": "home",
"environment": "production",
"resolved": false,
"ignored": false,
"created_at": "2023-10-13T18:07:55.692256Z",
"comments_count": 0,
"message": "We could not find your database: d6ipl26lboesdi. Which can be found in the database configuration file located at config/database.yml.\n\nTo resolve this issue:\n\n- Did you create the database for this app, or delete it? You may need to create your database.\n- Has the database name changed? Check your database.yml config has the correct database name.\n\nTo create your database, run:\n\n bin/rails db:create",
"notices_count": 6,
"last_notice_at": "2023-10-13T18:08:10.000000Z",
"tags": [],
"id": 101337516,
"assignee": null,
"url": "https://app.honeybadger.io/projects/123321/faults/101337516",
"deploy": {
"environment": "production",
"revision": "0eaf61a9ec756be9f4bb511ad71b37baaa9b73ba",
"repository": "https://github.com/spacely/testy-mctestface",
"local_username": "ben@example.com",
"created_at": "2023-10-06T20:52:51.878336Z",
"changelog": [],
"url": "https://github.com/spacely/testy-mctestface/compare/d4f90c876adf4a108ebb9a6f47b5562b59578d97...0eaf61a9ec756be9f4bb511ad71b37baaa9b73ba"
}
}
}
```
# Error unresolved event payload
> Sent when a resolved error occurs again.
Sent when a resolved error occurs again.
```json
{
"event": "unresolved",
"message": "[Testy McTestFace/production] ActiveRecord::NoDatabaseError unresolved by ",
"fault": {
"project_id": 123321,
"klass": "ActiveRecord::NoDatabaseError",
"component": "pages",
"action": "home",
"environment": "production",
"resolved": false,
"ignored": false,
"created_at": "2023-10-13T18:07:55.692256Z",
"comments_count": 0,
"message": "We could not find your database: d6ipl26lboesdi. Which can be found in the database configuration file located at config/database.yml.\n\nTo resolve this issue:\n\n- Did you create the database for this app, or delete it? You may need to create your database.\n- Has the database name changed? Check your database.yml config has the correct database name.\n\nTo create your database, run:\n\n bin/rails db:create",
"notices_count": 6,
"last_notice_at": "2023-10-13T18:08:10.000000Z",
"tags": [],
"id": 101337516,
"assignee": null,
"url": "https://app.honeybadger.io/projects/123321/faults/101337516",
"deploy": {
"environment": "production",
"revision": "0eaf61a9ec756be9f4bb511ad71b37baaa9b73ba",
"repository": "https://github.com/spacely/testy-mctestface",
"local_username": "ben@example.com",
"created_at": "2023-10-06T20:52:51.878336Z",
"changelog": [],
"url": "https://github.com/spacely/testy-mctestface/compare/d4f90c876adf4a108ebb9a6f47b5562b59578d97...0eaf61a9ec756be9f4bb511ad71b37baaa9b73ba"
}
}
}
```
# Site up event payload
> Sent when an uptime check succeeds after being down.
Sent when an uptime check succeeds after being down.
```json
{
"event": "up",
"message": "[Testy McTestFace] Heroku is back up after 0m.",
"project": {
"id": 123321,
"name": "Testy McTestFace",
"created_at": "2017-08-30T12:54:33.156695Z",
"disable_public_links": false,
"pivotal_project_id": null,
"asana_workspace_id": null,
"token": "zzz111",
"github_project": "spacely/testy-mctestface",
"environments": [
{
"id": 68210,
"project_id": 123321,
"name": "production",
"notifications": true,
"created_at": "2017-09-05T06:10:19.057794Z",
"updated_at": "2017-09-05T06:10:19.057794Z"
},
{
"id": 68074,
"project_id": 123321,
"name": "development",
"notifications": true,
"created_at": "2017-08-30T12:55:29.297392Z",
"updated_at": "2017-08-30T12:55:29.297392Z"
}
],
"owner": {
"id": 1,
"email": "ben@example.com",
"name": "Spacely Sprockets"
},
"last_notice_at": "2023-10-30T19:29:08.000000Z",
"earliest_notice_at": "2023-05-03T19:38:14.971778Z",
"unresolved_fault_count": 102,
"fault_count": 925,
"active": true,
"users": [
{
"id": 1,
"email": "ben@example.com",
"name": "Ben"
},
{
"id": 99,
"email": "george@example.com",
"name": "George Jetson"
}
],
"sites": [
{
"id": "c42c4c0a-6e3d-4303-9769-549ed2a5818e",
"active": true,
"last_checked_at": "2023-10-30T19:34:08.150725Z",
"name": "Heroku",
"state": "up",
"url": "https://example.com"
}
],
"team_id": 1
},
"site": {
"id": "c42c4c0a-6e3d-4303-9769-549ed2a5818e",
"name": "Heroku",
"url": "https://example.com",
"frequency": 5,
"match_type": "success",
"match": null,
"state": "up",
"active": true,
"last_checked_at": "2023-10-30T19:34:08.150725Z",
"retries": 0,
"proxy": 4,
"cert_will_expire_at": null,
"details_url": "https://app.honeybadger.io/projects/123321/sites/c42c4c0a-6e3d-4303-9769-549ed2a5818e"
},
"outage": {
"down_at": "2023-07-17T15:46:52.384701Z",
"up_at": "2023-07-17T15:51:56.063948Z",
"status": null,
"reason": "Connection timed out",
"headers": null,
"details_url": "https://app.honeybadger.io/projects/123321/sites/c42c4c0a-6e3d-4303-9769-549ed2a5818e"
}
}
```
# Volume spike event payload
> Sent when a project's error volume spikes above its learned baseline.
Sent when a project’s total error volume spikes above its learned baseline. See [Error volume anomaly detection](/guides/integrations/#error-volume-anomaly-detection) for details on how spikes are detected. The subject of this event is the **project** (not an individual error), so the payload has no `fault`. Spike facts are in the `volume_spike` object: * `observed` — the number of errors in the most recent one-hour window * `baseline_median` — the project’s typical errors-per-hour (median of the trailing baseline window) * `factor` — the observed volume as a multiple of the baseline median (e.g. `4.7` means 4.7× the typical rate); `null` when the baseline is near zero * `z_score` — the modified z-score that triggered the alert * `window_minutes` — the length of the observed window, in minutes
```json
{
"event": "volume_spike",
"message": "[Testy McTestFace] Errors are 4.7× your normal rate (412 in the last hour vs ~87/hr typical)",
"project": {
"id": 123321,
"name": "Testy McTestFace",
"created_at": "2017-08-30T12:54:33.156695Z",
"disable_public_links": false,
"pivotal_project_id": null,
"asana_workspace_id": null,
"token": "zzz111",
"github_project": "spacely/testy-mctestface",
"environments": [
{
"id": 68210,
"project_id": 123321,
"name": "production",
"notifications": true,
"created_at": "2017-09-05T06:10:19.057794Z",
"updated_at": "2017-09-05T06:10:19.057794Z"
}
],
"owner": {
"id": 1,
"email": "ben@example.com",
"name": "Spacely Sprockets"
},
"last_notice_at": "2023-10-30T19:29:08.000000Z",
"earliest_notice_at": "2023-05-03T19:37:25.519130Z",
"unresolved_fault_count": 102,
"fault_count": 925,
"active": true,
"users": [
{
"id": 1,
"email": "ben@example.com",
"name": "Ben"
}
],
"sites": [],
"team_id": 1
},
"volume_spike": {
"observed": 412,
"baseline_median": 87,
"factor": 4.7,
"z_score": 6.2,
"window_minutes": 60
}
}
```
# Redmine
> Connect Honeybadger to Redmine to automatically create issues from errors and track bug fixes in your project.
Users with administrative privileges can find this integration below the list of personal alert integrations on the Alerts & Integrations tab of the Project Settings page. ## Setup [Section titled “Setup”](#setup) ### 1. Select the Redmine integration [Section titled “1. Select the Redmine integration”](#1-select-the-redmine-integration)  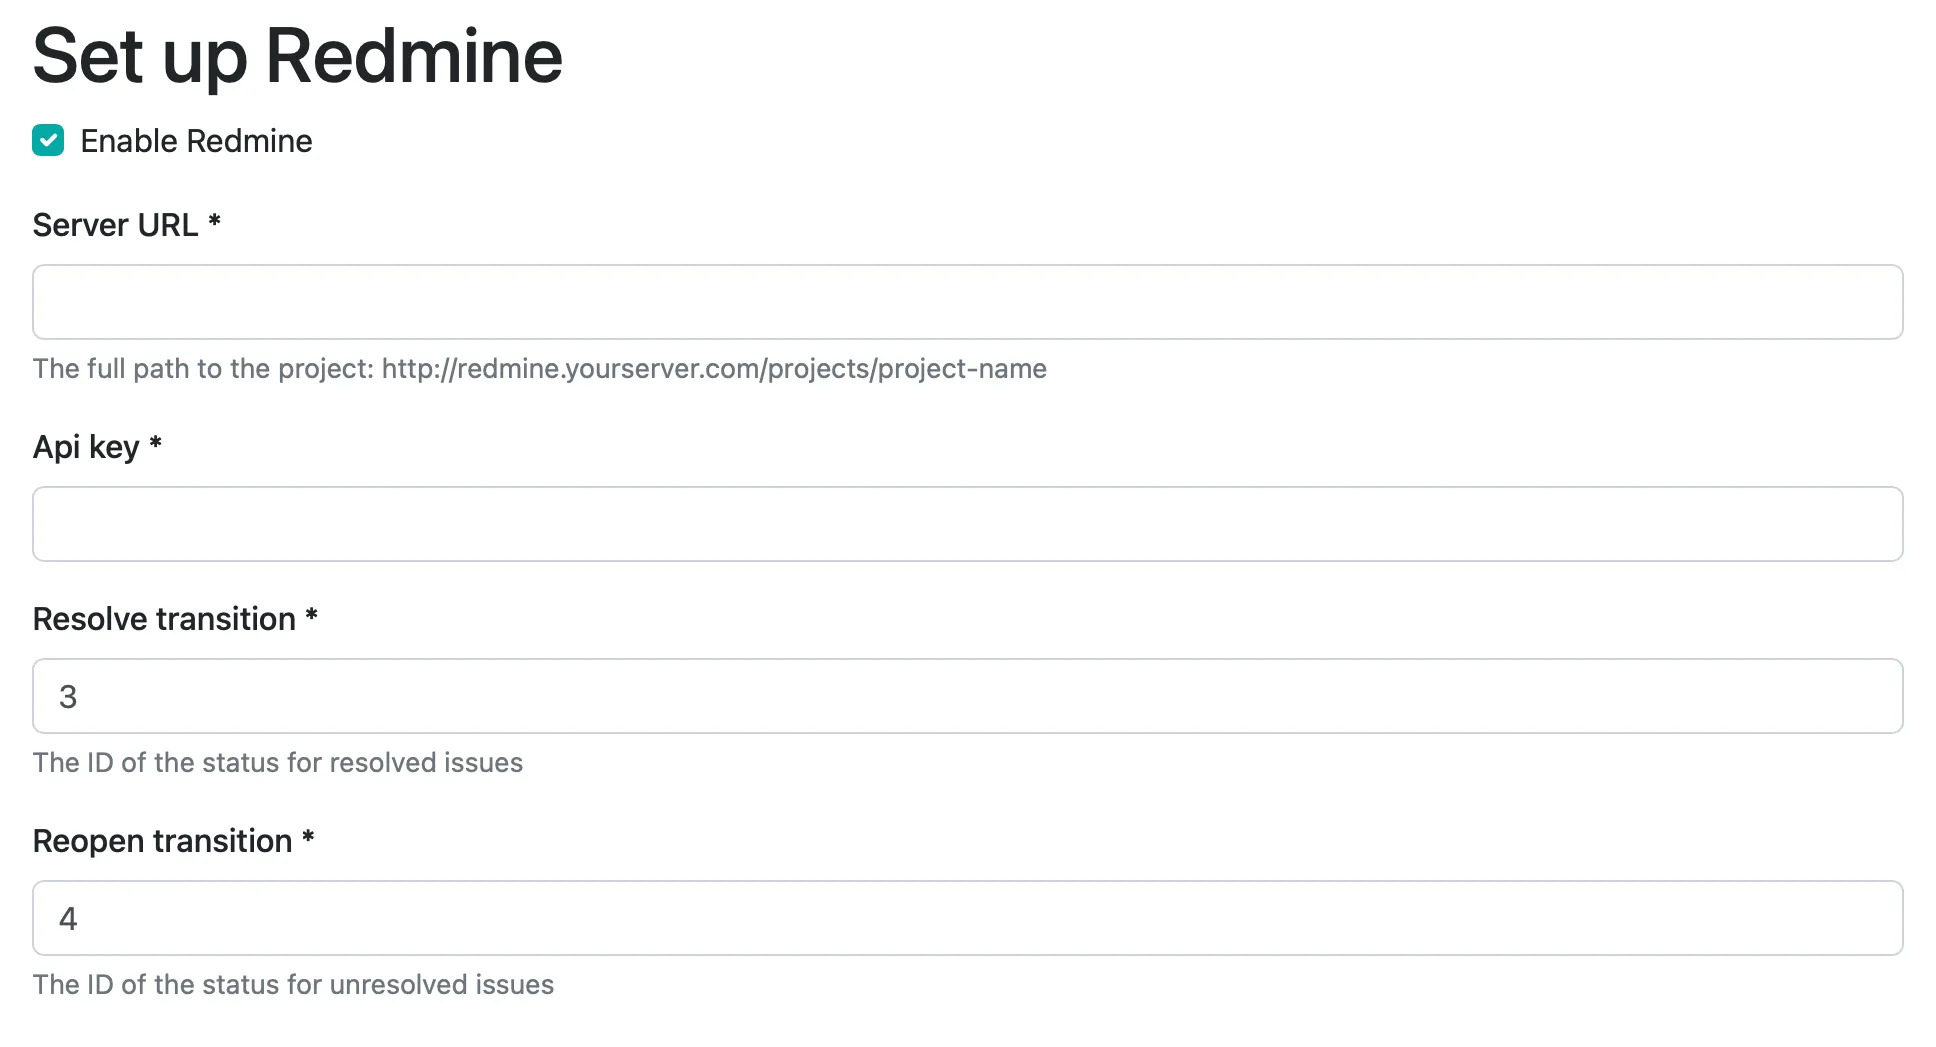 ### 2. Set the server & API key [Section titled “2. Set the server & API key”](#2-set-the-server--api-key) The server URL is the full URL of your server - including `https://`. You can find your API key on your account page when logged into Redmine ### 3. Configure transitions (optional) [Section titled “3. Configure transitions (optional)”](#3-configure-transitions-optional) You can specify the ids of transitions to be run when issues are resolved and reopened. ### 4. Save [Section titled “4. Save”](#4-save) That’s it! You can test the integration by clicking “Test”. Otherwise, just save it and you’re ready to go.
# Rootly
> Connect Honeybadger to Rootly to automatically trigger incidents from critical errors and application events, and streamline your response workflow.
Users with administrative privileges can find this integration below the list of personal alert integrations on the Alerts & Integrations tab of the Project Settings page. ## Setup [Section titled “Setup”](#setup) ### 1. Create a generic webhook alert source in Rootly. [Section titled “1. Create a generic webhook alert source in Rootly.”](#1-create-a-generic-webhook-alert-source-in-rootly) Navigate to the [Alert Sources](https://rootly.com/account/alerts?tab=alert-sources) page in your Rootly account. Locate the **Generic Webhook** alert source and click **Add Source**. Set the Alert Source Name to “Honeybadger”.  ### 2. Locate the authorization header - credentials [Section titled “2. Locate the authorization header - credentials”](#2-locate-the-authorization-header---credentials) Rootly will generate a webhook token. Copy this value.  ### 3. In Honeybadger, locate the Rootly integration. [Section titled “3. In Honeybadger, locate the Rootly integration.”](#3-in-honeybadger-locate-the-rootly-integration) In the project settings, click on the **Integrations** tab where you’ll find the Rootly integration.  ### 4. Fill in the required fields and save. [Section titled “4. Fill in the required fields and save.”](#4-fill-in-the-required-fields-and-save) Fill in the Webhook authorization token field with the generated token you copied from step 2. You may optionally specify a target type and target ID. Save the integration. ### 5. Test the integration. [Section titled “5. Test the integration.”](#5-test-the-integration) Click on the “Test this integration” button to send a test notification to your Rootly account. This will send a test payload to the Rootly webhook alert source. ### 6. Configure the Rootly alert source. [Section titled “6. Configure the Rootly alert source.”](#6-configure-the-rootly-alert-source) Now that Rootly has a sample payload, you can easily configure the alert. In your Rootly account, find the configuration settings for the Webhook alert source. Edit the Alert Content and set the following values: * Alert Title: `{{ alert.data.title }}` * Alert Description: `{{ alert.data.description }}` * Link to Alert: `{{ alert.data.url }}` 
# Shortcut
> Connect Honeybadger to Shortcut to automatically create stories from errors and track bug fixes in your project workflow.
Users with administrative privileges can find this integration below the list of personal alert integrations on the Alerts & Integrations tab of the Project Settings page.  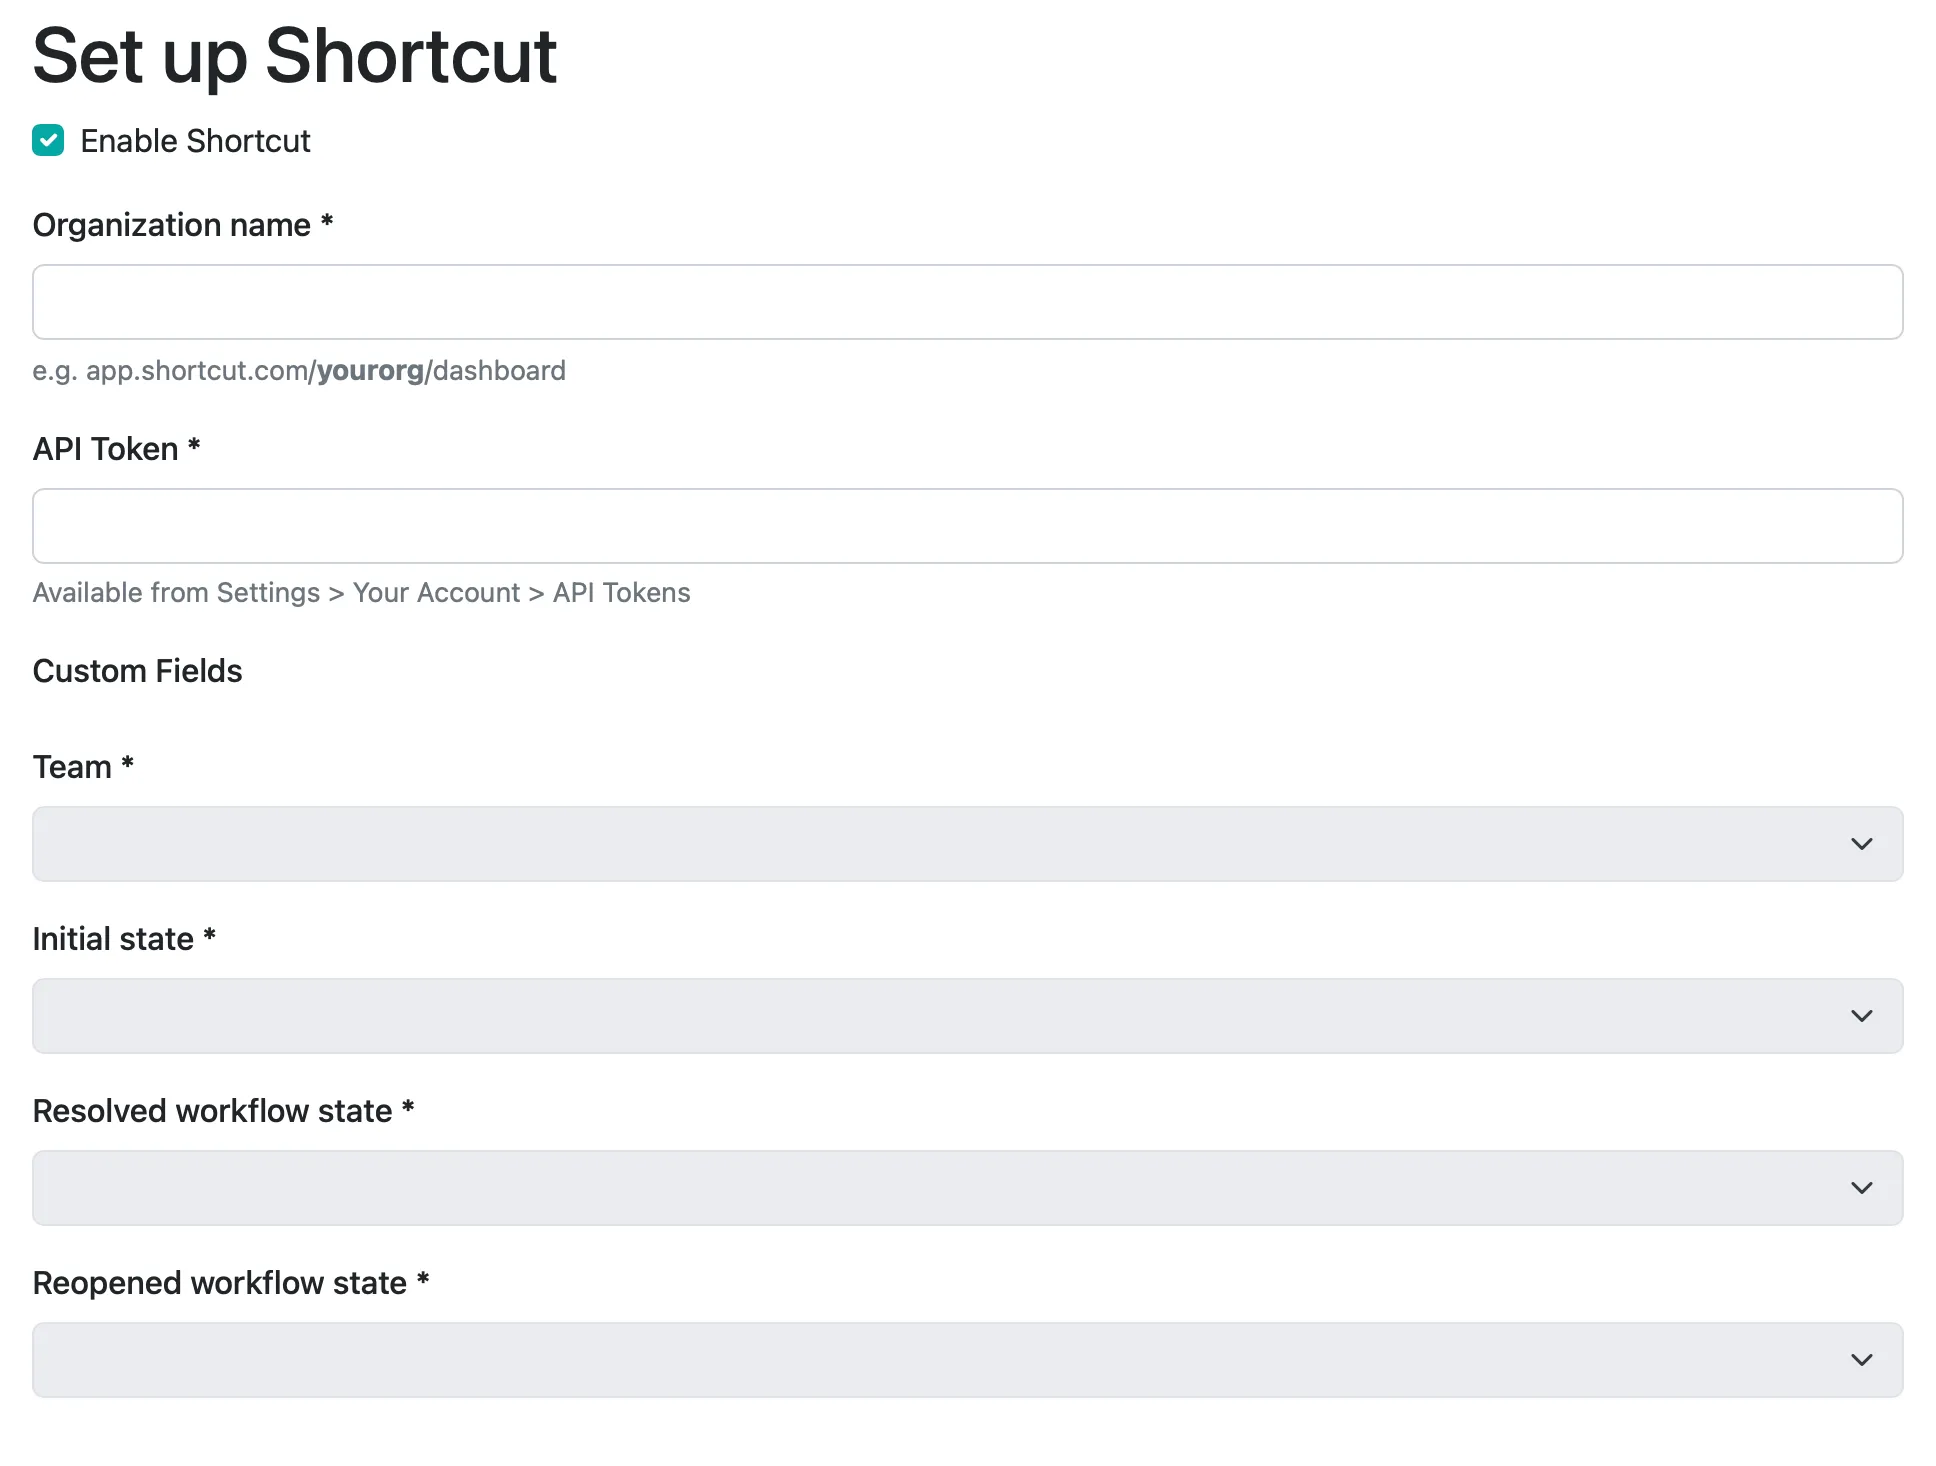 ## Setup [Section titled “Setup”](#setup) ### 1. Set the organization [Section titled “1. Set the organization”](#1-set-the-organization) This is the name of the organization that you created when you set up your account. You can find this immediately after the domain name in the URL: e.g., for the organization name is honeybadger. ### 2. Set the API token [Section titled “2. Set the API token”](#2-set-the-api-token) Your API Token can be found in the Shortcut UI by clicking on the gear icon for settings, choosing the Your Account link, then choosing the API Tokens link. Choose a name for your token (like Honeybadger) and click Generate Token. Copy the highlighted token, and paste that in the API Token field. ### 3. Fetch custom fields and workflow data [Section titled “3. Fetch custom fields and workflow data”](#3-fetch-custom-fields-and-workflow-data) Click the Fetch custom fields and workflow data button to make a request to the Shortcut API to get your list of teams, custom fields, and workflow states. This will populate and enable the remaining dropdowns on the form. ### 4. Choose the team, custom fields, and workflow states [Section titled “4. Choose the team, custom fields, and workflow states”](#4-choose-the-team-custom-fields-and-workflow-states) Each Honeybadger project is associated with one Shortcut team, and you can make that choice here. In addition, you may also specify custom field choices to apply to your stories. You can also choose which of your Shortcut workflow states will be chosen for stories when they are marked as resolved or unresolved. The stories will be updated to those states if you also enable the respective Error Events options. ## Creating stories from the UI [Section titled “Creating stories from the UI”](#creating-stories-from-the-ui) Users can create stories in Shortcut by clicking the Create Story button on the error detail page in the Honeybadger UI. By default, these stories will be created as the Shortcut user whose API Token is configured in the integration settings. Users can have stories associated with their own Shortcut account by getting an API Token as described previously and adding it to their [authentication settings](https://app.honeybadger.io/users/edit#authentication).
# Slack
> Connect Honeybadger to Slack to receive real-time application monitoring alerts and resolve issues directly from your team's channels.
Users with administrative privileges can find this integration below the list of personal alert integrations on the Alerts & Integrations tab of the Project Settings page. ## Setup [Section titled “Setup”](#setup) ### 1. Select the integration for Slack [Section titled “1. Select the integration for Slack”](#1-select-the-integration-for-slack)  When you click on the link to add Slack to your project, you will be redirected to Slack to approve the connection to your Slack team. After you choose the channel to receive Honeybadger messages and click the Authorize button, you will be redirected back to Honeybadger to finish editing the optional channel settings. ### 2. Save [Section titled “2. Save”](#2-save) That’s it! You can test the integration by clicking “Test”. Otherwise, just save it and you’re ready to go. ## Interactive messages [Section titled “Interactive messages”](#interactive-messages) Messages about errors include a button to resolve or reopen the error:  The first time you click one of the buttons, you will be given a link that will allow you to connect your Slack account to your Honeybadger account. This connection only needs to be done once, and then you will be able to use the buttons and interact with the bot. ## Using the bot [Section titled “Using the bot”](#using-the-bot) Once you have installed the Honeybadger app for Slack, you will have a Honeybadger bot available to your Slack team. You can message the bot directly or you can invite it to join a channel and address it… either way, it understands the following commands: | Command | Description | | ---------------------------------- | ------------------------------------------------------------------------------------------- | | **help** | Get help :) | | **show project *\*** | Returns a list of faults that occurred recently in the *Project Name* project. | | **show fault *\*** | See details about the requested fault. The fault number can be found in the Honeybadger UI. | | **resolve fault *\*** | Mark the specified fault as resolved. | | **reopen fault *\*** | Mark the specified fault as reopened. |
# Splunk On-Call
> Connect Honeybadger to Splunk On-Call to route critical errors and application monitoring alerts through your incident response and on-call workflow.
Users with administrative privileges can find this integration below the list of personal alert integrations on the Alerts & Integrations tab of the Project Settings page. ## Setup [Section titled “Setup”](#setup) ### 1. Select the Splunk On-Call integration [Section titled “1. Select the Splunk On-Call integration”](#1-select-the-splunk-on-call-integration)   ### 2. Set the API key [Section titled “2. Set the API key”](#2-set-the-api-key) You can generate a Splunk On-Call API key on the Splunk On-Call integrations page. ### 3. Set the routing key (optional) [Section titled “3. Set the routing key (optional)”](#3-set-the-routing-key-optional) If you like, you can specify an arbitrary routing key for use by Splunk On-Call. ### 4. Save [Section titled “4. Save”](#4-save) That’s it! You can test the integration by clicking “Test”. Otherwise, just save it and you’re ready to go.
# Sprintly
> Connect Honeybadger to Sprintly to automatically create defects from errors and track bug fixes in your workflow.
Users with administrative privileges can find this integration below the list of personal alert integrations on the Alerts & Integrations tab of the Project Settings page. ## Setup [Section titled “Setup”](#setup) ### 1. Select the Sprintly integration [Section titled “1. Select the Sprintly integration”](#1-select-the-sprintly-integration)   ### 2. Set the email & API key [Section titled “2. Set the email & API key”](#2-set-the-email--api-key) You can get your Sprintly API key by logging into Sprintly and going to your Profile page. The key is at the bottom. ### 3. Set the product ID [Section titled “3. Set the product ID”](#3-set-the-product-id) You can find your product’s id by examining the URL. If your product’s url is `sprint.ly/product/777` then the product id is “777”. ### 4. Save [Section titled “4. Save”](#4-save) That’s it! You can test the integration by clicking “Test”. Otherwise, just save it and you’re ready to go.
# Trello
> Connect Honeybadger to Trello to automatically create cards from errors and track bug fixes on your Trello boards.
Users with administrative privileges can find this integration below the list of personal alert integrations on the Alerts & Integrations tab of the Project Settings page. ## Setup [Section titled “Setup”](#setup) ### 1. Select the Trello integration [Section titled “1. Select the Trello integration”](#1-select-the-trello-integration)   ### 2. Connect your Trello account [Section titled “2. Connect your Trello account”](#2-connect-your-trello-account) Just click the button to connect to trello via OAuth. ### 3. Select the board and list [Section titled “3. Select the board and list”](#3-select-the-board-and-list) These two dropdowns will be populated when you connect your account. ### 4. Save [Section titled “4. Save”](#4-save) That’s it! Hit save and you’re good to go.
# Webhook
> Configure custom webhooks to send Honeybadger error notifications and events to any third-party service or API.
Honeybadger sends webhooks when certain events occur in your Honeybadger projects. Each event type has a specific payload structure with relevant data about the event. Users with administrative privileges can find this integration below the list of personal alert integrations on the Alerts & Integrations tab of the Project Settings page. ## Setup [Section titled “Setup”](#setup) ### 1. Select the Webhook integration [Section titled “1. Select the Webhook integration”](#1-select-the-webhook-integration)   ### 2. Set the URL for your webhook [Section titled “2. Set the URL for your webhook”](#2-set-the-url-for-your-webhook) We’ll post notifications to this URL. Make sure to include the protocol: e.g., `https://mysite.com/hook`. Make sure you have a service running that can accept POST requests, and hopefully do something interesting with JSON payloads like this one:
```plaintext
{
"event":"occurred",
"message":"[Crywolf/test] RuntimeError - oops",
"fault":{
"id":3151009,
"project_id":1717,
"klass":"RuntimeError",
"component":null,
"action":null,
"environment":"development",
"resolved":true,
"ignored":false,
"created_at":"2014-01-08T18:55:48Z",
"comments_count":1,
"message":"oops",
"notices_count":9,
"last_notice_at":"2014-01-08T19:02:21Z"
}
}
```
See [Event Payloads](#payload-structure) for all available events and their structure. ### 3. Save [Section titled “3. Save”](#3-save) That’s it! Hit save and you’re good to go. ## Payload structure [Section titled “Payload structure”](#payload-structure) Each event payload is sent as a JSON object with the following properties: * `event` - The type of event (e.g., `occurred`, `resolved`, `deployed`) * `message` - A human-readable description of the event * Additional event-specific data (varies by event type) ## Event payloads [Section titled “Event payloads”](#event-payloads) The following events are supported by the Webhook integration: ### [`assigned`](/guides/integrations/payloads/assigned/) [Section titled “assigned”](#assigned) Sent when an error is assigned to a user. **Top-level properties:** `event`, `message`, `actor`, `fault`, `assignee` ### [`cert_will_expire`](/guides/integrations/payloads/cert_will_expire/) [Section titled “cert\_will\_expire”](#cert_will_expire) Sent when an SSL certificate is about to expire. **Top-level properties:** `event`, `message`, `project`, `site` ### [`check_in_missing`](/guides/integrations/payloads/check_in_missing/) [Section titled “check\_in\_missing”](#check_in_missing) Sent when an expected check-in is missing. **Top-level properties:** `event`, `message`, `project`, `check_in` ### [`check_in_reporting`](/guides/integrations/payloads/check_in_reporting/) [Section titled “check\_in\_reporting”](#check_in_reporting) Sent when a check-in reports successfully. **Top-level properties:** `event`, `message`, `project`, `check_in` ### [`commented`](/guides/integrations/payloads/commented/) [Section titled “commented”](#commented) Sent when a comment is added to an error. **Top-level properties:** `event`, `message`, `actor`, `fault`, `comment` ### [`deployed`](/guides/integrations/payloads/deployed/) [Section titled “deployed”](#deployed) Sent when a deployment is recorded. **Top-level properties:** `event`, `message`, `project`, `deploy` ### [`down`](/guides/integrations/payloads/down/) [Section titled “down”](#down) Sent when an uptime check fails. **Top-level properties:** `event`, `message`, `project`, `site`, `outage` ### [`occurred`](/guides/integrations/payloads/occurred/) [Section titled “occurred”](#occurred) Sent when an error occurs. **Top-level properties:** `event`, `message`, `project`, `fault`, `notice` ### [`rate_exceeded`](/guides/integrations/payloads/rate_exceeded/) [Section titled “rate\_exceeded”](#rate_exceeded) Sent when error rate threshold is exceeded. **Top-level properties:** `event`, `message`, `project`, `fault` ### [`resolved`](/guides/integrations/payloads/resolved/) [Section titled “resolved”](#resolved) Sent when an error is marked as resolved. **Top-level properties:** `event`, `message`, `project`, `fault` ### [`unresolved`](/guides/integrations/payloads/unresolved/) [Section titled “unresolved”](#unresolved) Sent when a resolved error occurs again. **Top-level properties:** `event`, `message`, `project`, `fault` ### [`up`](/guides/integrations/payloads/up/) [Section titled “up”](#up) Sent when an uptime check succeeds after being down. **Top-level properties:** `event`, `message`, `project`, `site`, `outage` ### [`volume_spike`](/guides/integrations/payloads/volume_spike/) [Section titled “volume\_spike”](#volume_spike) Sent when a project’s error volume spikes above its learned baseline. **Top-level properties:** `event`, `message`, `project`, `volume_spike`
# Zulip
> Connect Honeybadger to Zulip to receive real-time application monitoring alerts directly in your team's streams.
Users with administrative privileges can find this integration below the list of personal alert integrations on the Alerts & Integrations tab of the Project Settings page. ## Setup [Section titled “Setup”](#setup) ### 1. In Zulip, create a new incoming webhook bot. [Section titled “1. In Zulip, create a new incoming webhook bot.”](#1-in-zulip-create-a-new-incoming-webhook-bot) You’ll need to create a new Incoming Webhook Bot in Zulip. This is done by going to the **Settings** page of your Zulip organization and selecting **Bots** from the left-hand menu.  ### 2. In Honeybadger, locate the Zulip integration. [Section titled “2. In Honeybadger, locate the Zulip integration.”](#2-in-honeybadger-locate-the-zulip-integration) In the project settings, click on the **Integrations** tab where you’ll find the Zulip integration.  ### 3. Fill in the required fields and save. [Section titled “3. Fill in the required fields and save.”](#3-fill-in-the-required-fields-and-save) Fill in the required fields which you generated in step 1. Configure which notifications you wish to receive and then save. You can also click on the “Test this integration” button to send a test notification to your Zulip stream. This is a great way to ensure that everything is set up correctly before you start receiving real notifications. 
# Projects
> Projects contain your errors, check-ins & uptime.
Almost everything in Honeybadger is scoped to a project. We have some powerful configuration features to help you manage your errors. At the top of the project page, there are tabs for the windows containing all aspects of the project.  ## General project settings [Section titled “General project settings”](#general-project-settings) 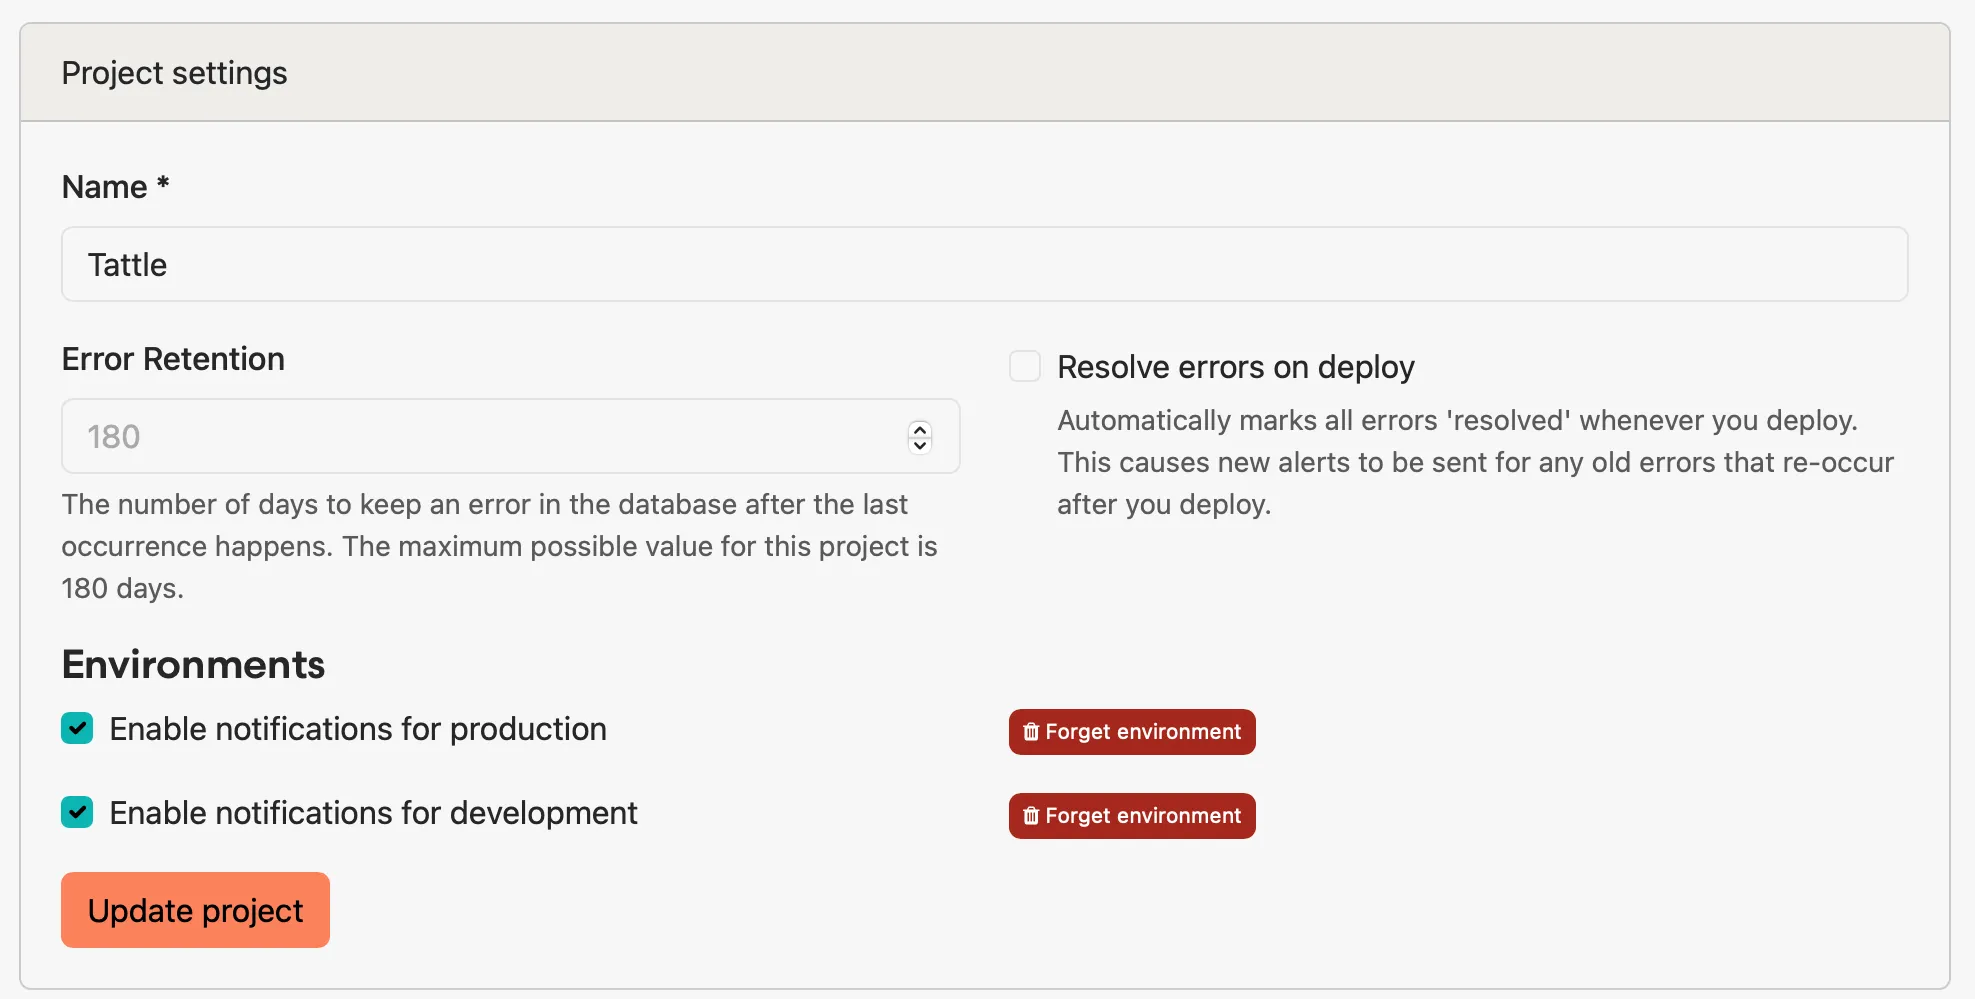 The General tab of the project settings page includes changing the name of the project and how long error occurrence data is retained. You can also enable or disable notifications by project environment. Environments are added to this list as errors are reported to our API from those environments. The *Resolve errors on deploy* setting automatically marks all errors “resolved” when you [report a deployment](/api/reporting-deployments/), causing new alerts to be sent for any errors that re-occur. When turned off, you can resolve individual errors on the next deploy from the [actions area](/guides/errors/#resolve-on-deploy) on the error page. Below that is the project delete button - deleting a project cannot be undone! 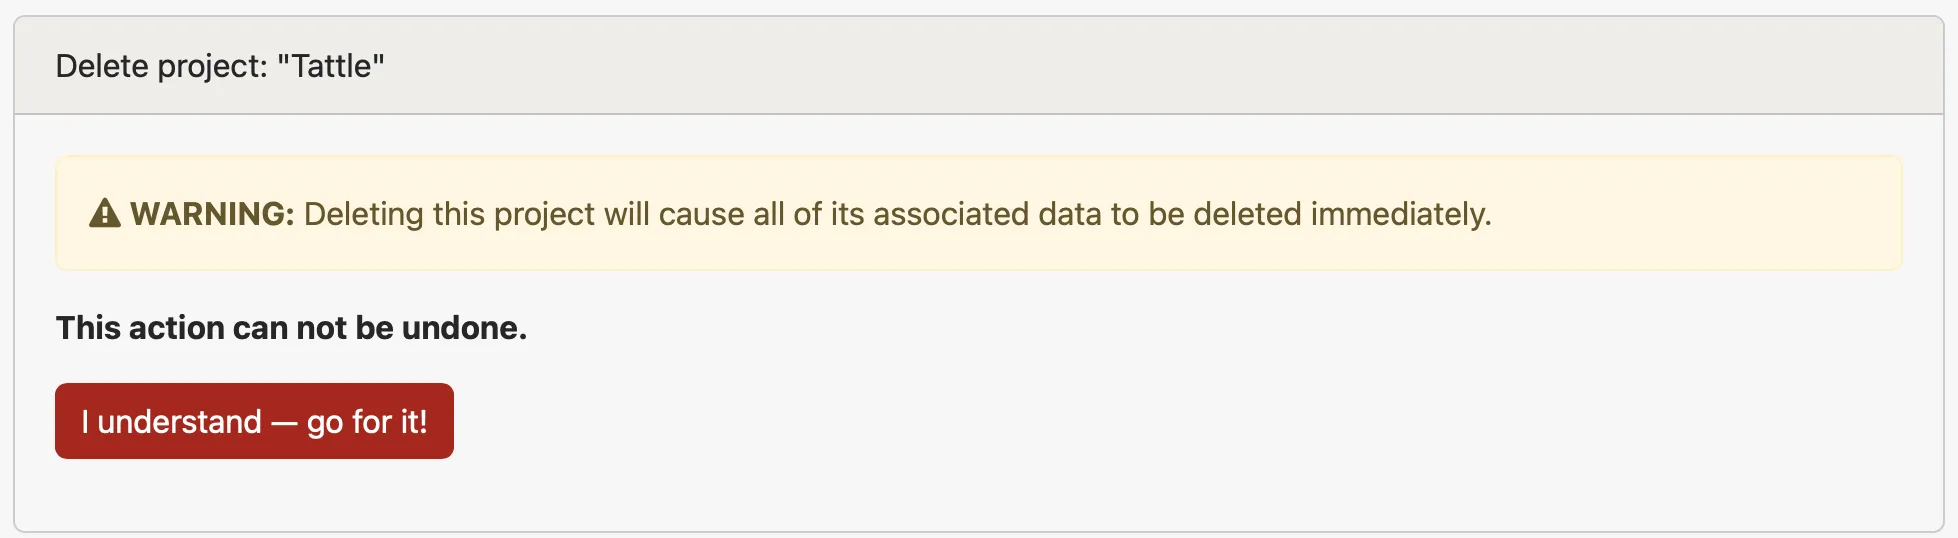 ## Insights [Section titled “Insights”](#insights) The Insights tab shows your current Insights data limits and has a link to the Insights stats page, which can also be found by navigating to the API stats for a project. To read more about configuring Insights, check out the [Insights](/guides/insights) documentation page. ## Users [Section titled “Users”](#users) From the Users settings tab, you can see and manage which users have access to the project and what teams are assigned to the project. This page also lets you see the members of each team currently assigned to the project. Users can have admin privileges for a project if you add them individually while specifying the admin permission or if they have admin privileges on a team that is assigned to the project. Users having admin privileges at the account level (managed via the Users tab of the Account Settings page) will also have admin rights on the project. To read more about user management, check out the [User Management](/guides/user-management) documentation page. ## Alerts & integrations [Section titled “Alerts & integrations”](#alerts--integrations) The Alerts and Integrations tab allows you to edit the notifications you receive as a user for the project. If you have admin privileges for the project, you can also manage the integrations (such as GitHub, Slack, etc.) that are connected to the project. To read more about managing integrations, check out the [Integrations](/guides/integrations) documentation page. ## API keys [Section titled “API keys”](#api-keys) Project API keys grant access to our reporting APIs. The list of reporting endpoints is in our [API docs](/api/). If an API key is leaked or misused, you can rotate your key by adding a new key and removing the old one. ## Project actions [Section titled “Project actions”](#project-actions) Project Actions let you customize your errors as we receive them. Through actions, you can automatically: * Assign errors to yourself or another team member * Add tags * Pause notifications * Share errors publicly One exciting usage example for Project Actions is assigning errors to specific code owners. For example, Ben takes care of most of the billing code here at Honeybadger. It would make sense that he should be assigned any errors related to billing. Here is a simple setup to route `StripeController` errors to Ben: 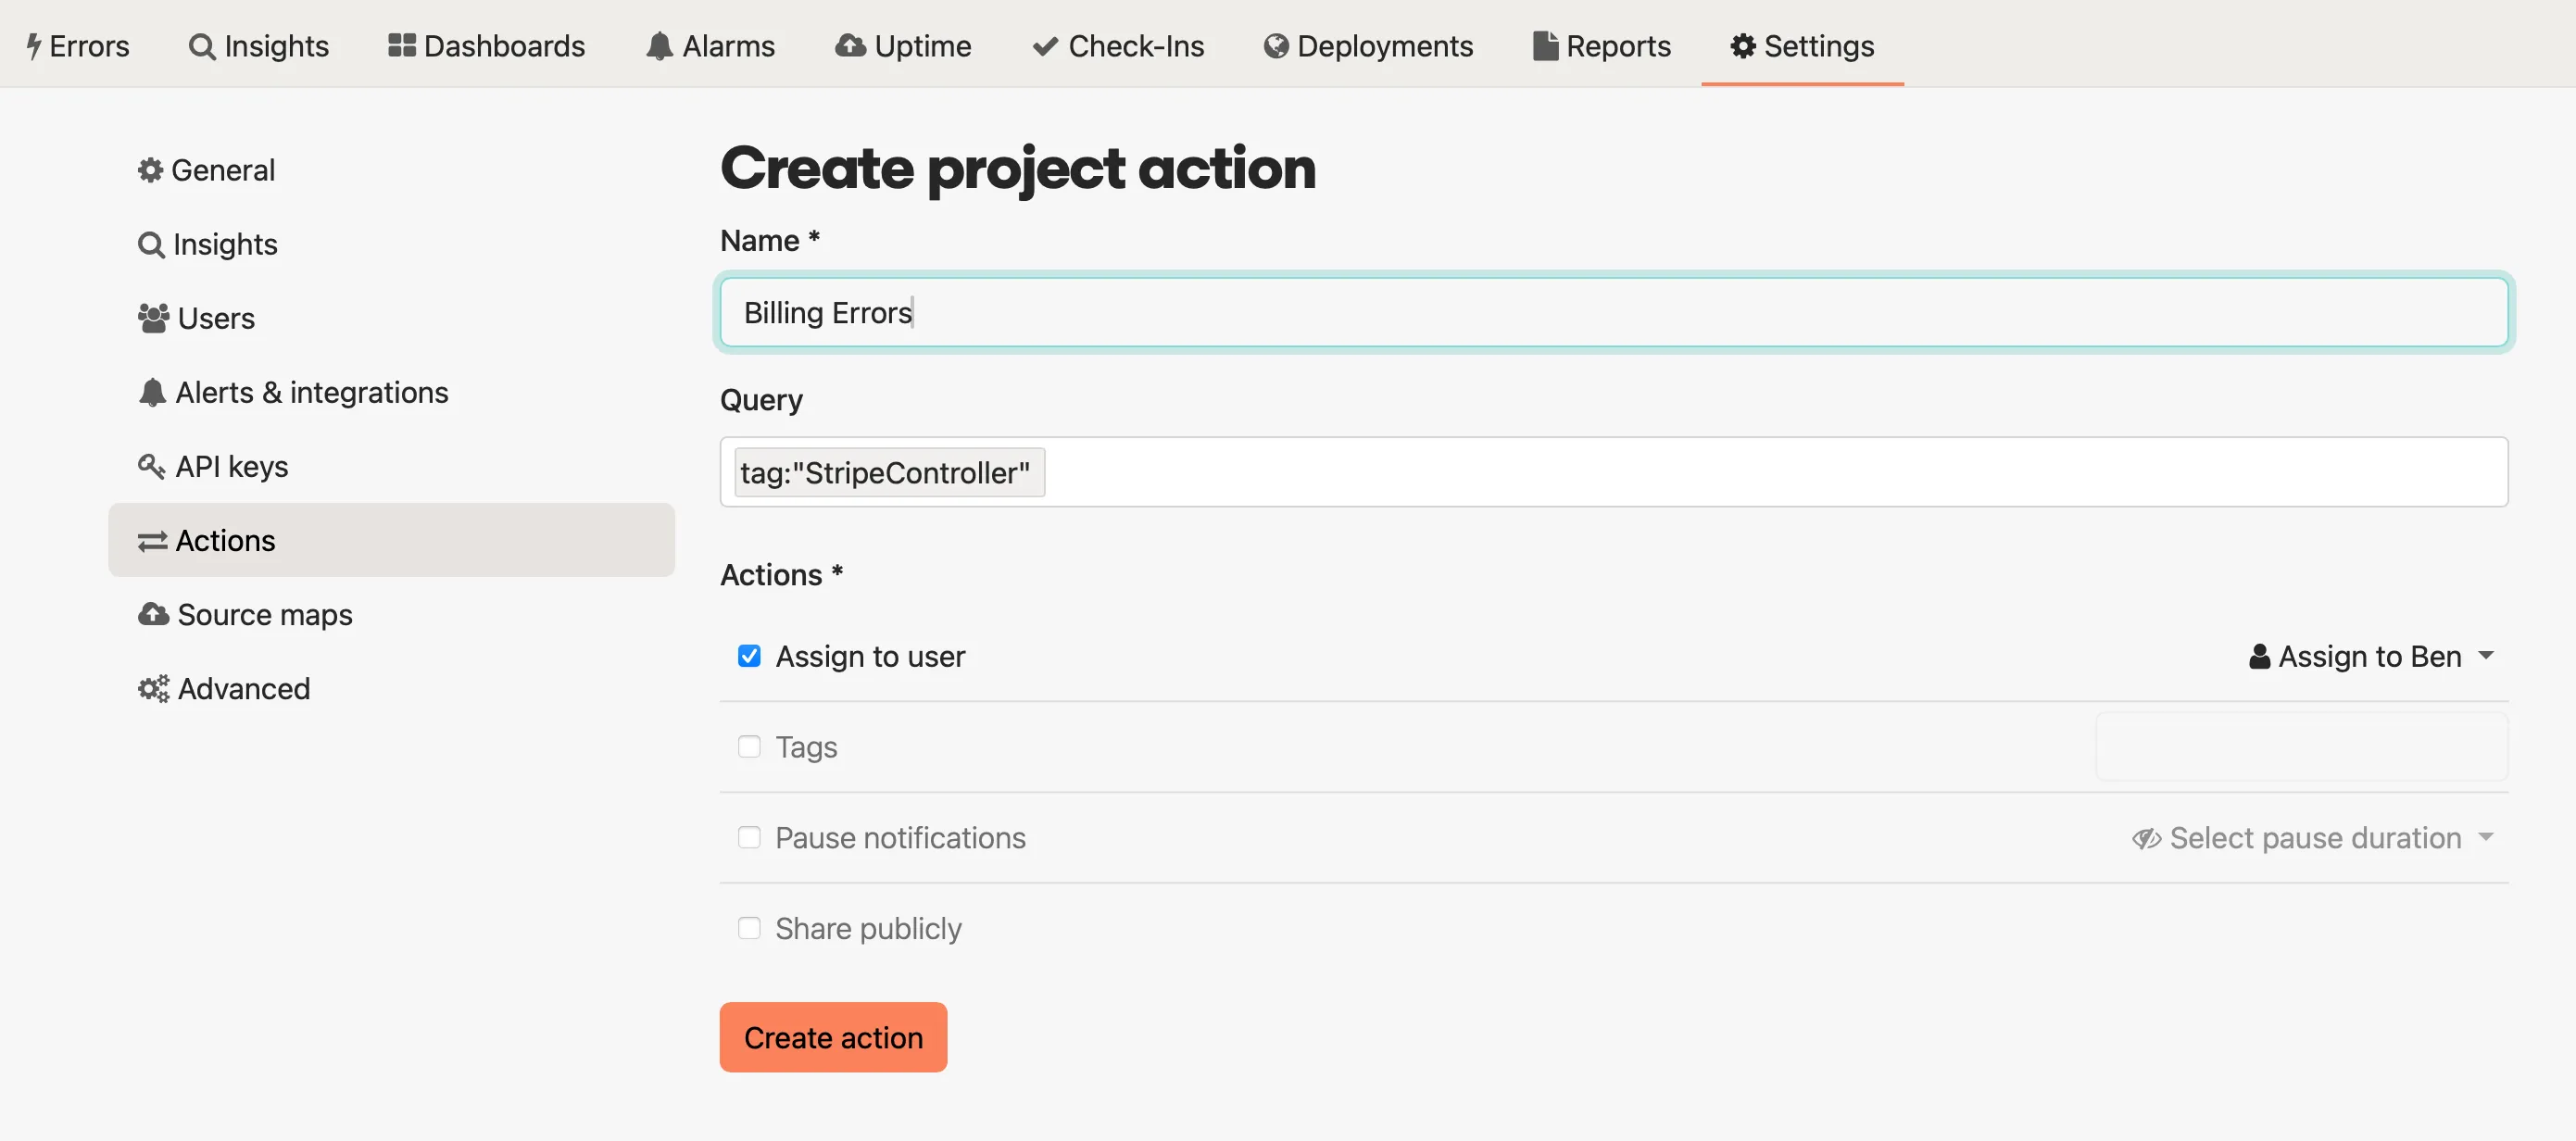 You can run all your incoming errors through the actions, or you can use the query box to constrain which errors have actions applied to them. The query box works identically to the search box when navigating on the error tab. ## Source maps [Section titled “Source maps”](#source-maps) Honeybadger can automatically un-minify your code if you provide a source map along with your minified JavaScript files. The tab for Source Maps in Project Settings allows you to choose whether or not to download your source maps. It also contains a list of the currently stored source maps and a debugging tool that you can use to diagnose problems with source map processing. For more on source maps, check out the [Source Maps](/lib/javascript/errors/using-source-maps/) documentation page. ## Advanced settings [Section titled “Advanced settings”](#advanced-settings) Here you can manage some settings that modify the Honeybadger UI and the processing of your errors. The User URL field can be used to add a link in the Honeybadger UI to a URL you specify (such as an internal admin tool) with the user ID populated from the `context.user_id` data in your error report. When this field is populated and an error notification includes the user\_id data, a button labeled “View user” is added to the error detail page that you can use to click through to the User URL: 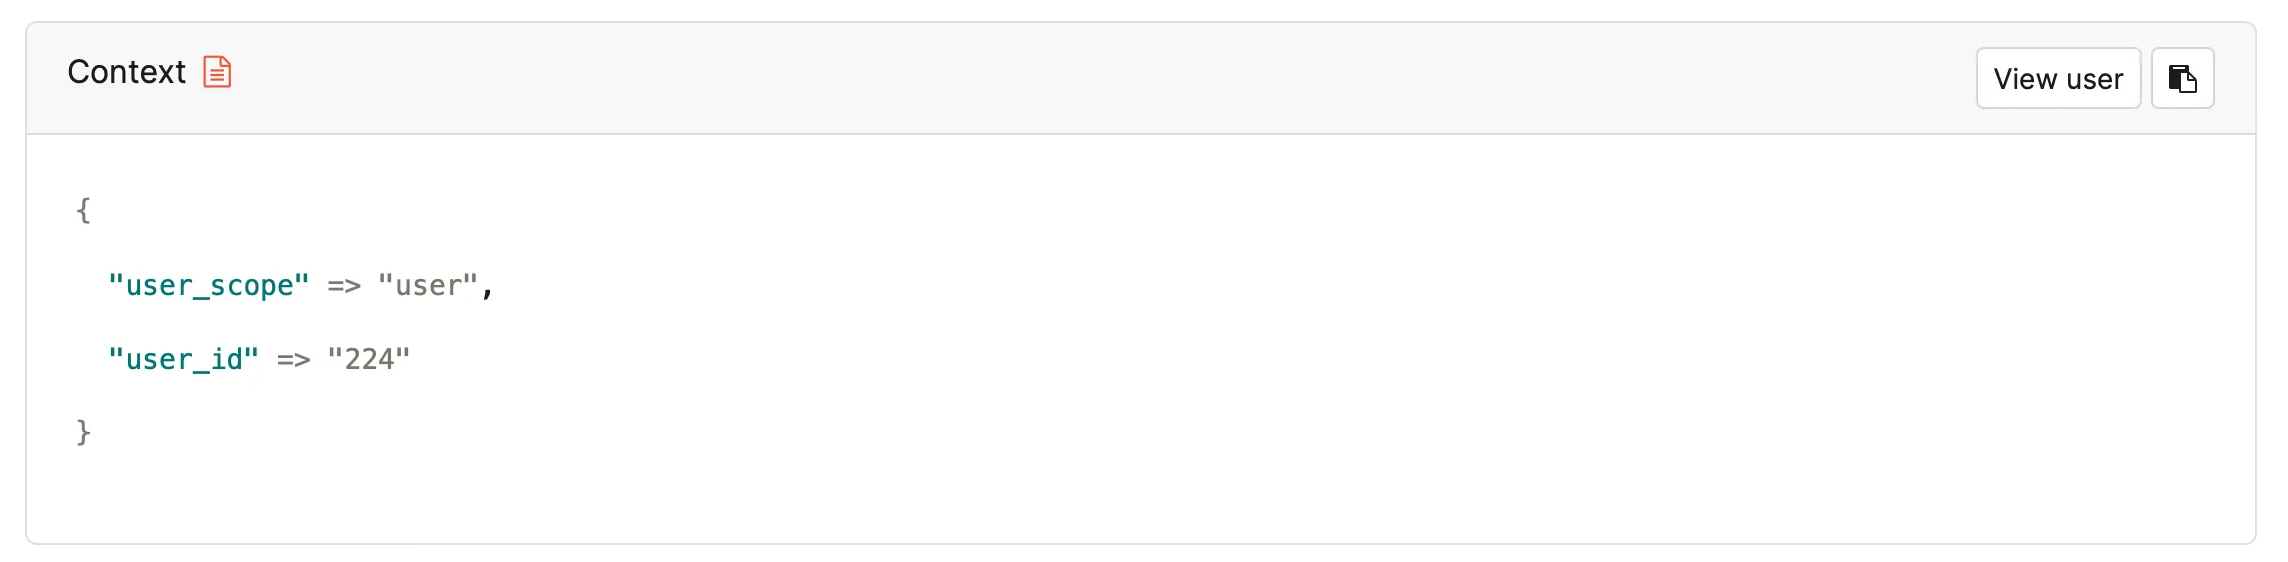 If your context includes the user ID in a field other than `context.user_id`, you can use the User search field setting to specify where in your payload the user ID exists. You can also use this to override what field should be used as your user ID — e.g., you could specify `context.user_email` if you’d prefer to use email addresses rather than IDs. Regardless of the field you use, that field’s value will be stored as the **user** in the search index and displayed in the notice timeline list and elsewhere in the UI.  The throttle field allows you to set a limit for the number of errors the project can receive per minute. This can be useful for preventing a noisy project (like one dedicated to a QA or staging environment) from consuming too much of your quota. ### Public error pages [Section titled “Public error pages”](#public-error-pages) You can make an error public by clicking “Share URL” in the [actions area](/guides/errors/#error-actions) of the error you want to share. We provide you with a unique URL to give to collaborators. This is great but can be cumbersome when sharing multiple errors. Public Error Pages are a place where collaborators can view shared errors. Once you enable the Public Error Page (**Project Settings > Advanced > Enable public dashboard**), collaborators can find shared errors in a similar view as the error listing page (with some restrictions). This can be especially useful if you pair this feature with [Project Actions](#project-actions). ## One language per project [Section titled “One language per project”](#one-language-per-project) We often get asked if users can have multiple programming languages in a project. While it is technically possible, we recommend that you create a separate project for each application or repository.
# Reports
> Viewing and understanding reports.
The Reports page of a project includes summary charts of error data grouped by location, class, day, and affected user, as well as a summary of the project’s uptime checks. 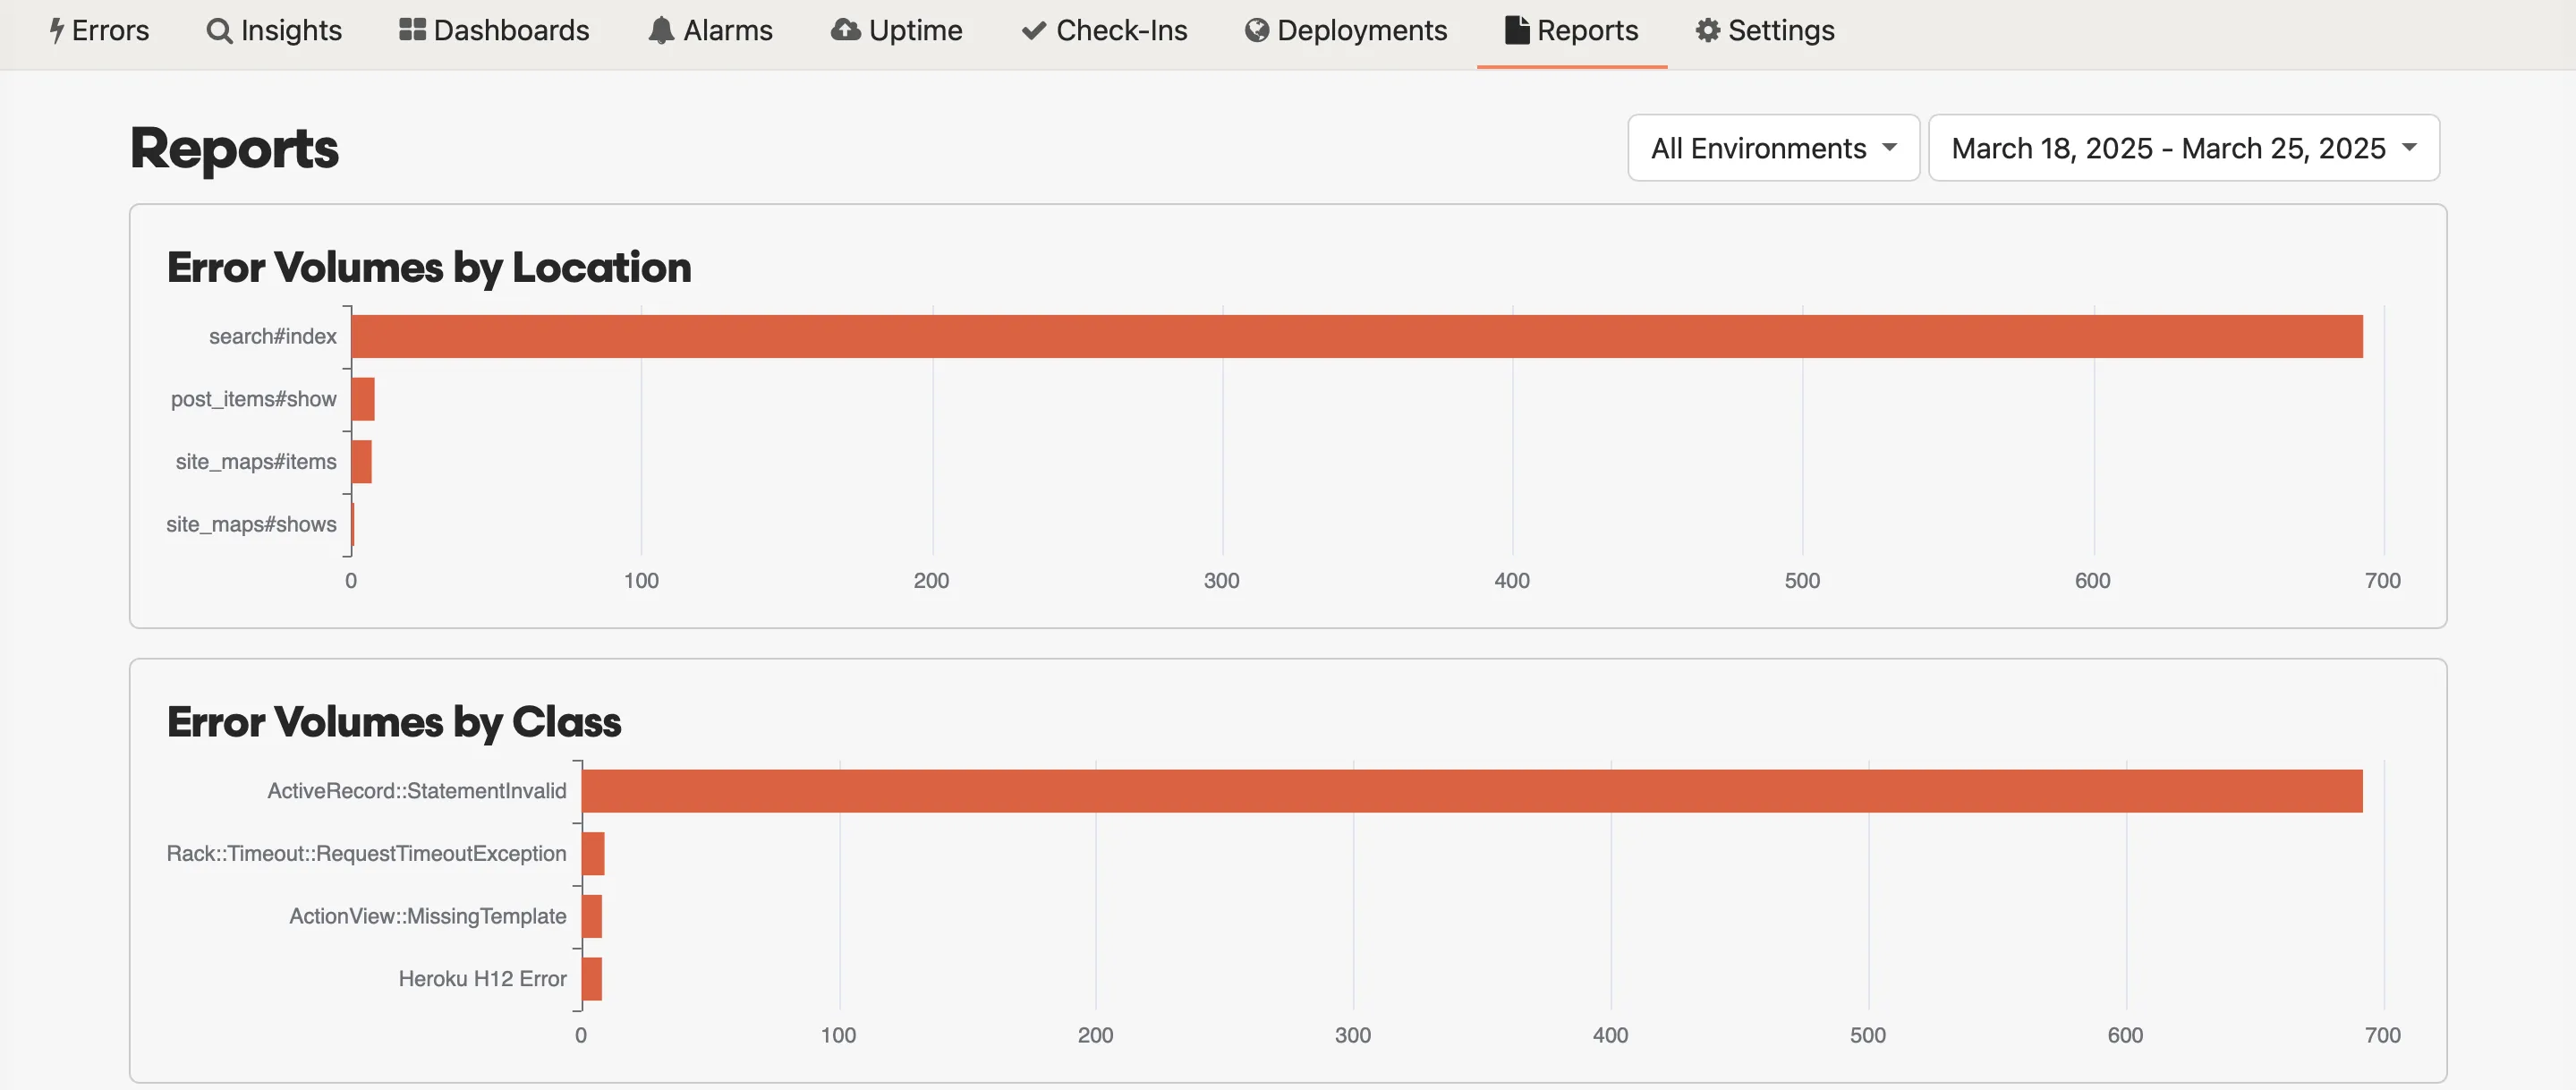 Clicking on a bar in one of the bar charts will take you to a search for errors matching the selected location, class, or user.
# Status pages
> Give users insight into your system status.
Your Honeybadger account comes with customizable status pages. Give your users insights into the working state of your system by connecting uptime checks or providing updates during problems via incidents. Here’s a [live example](https://uptime.honeybadger.io/) of our Honeybadger status page. ## Customizing your status page [Section titled “Customizing your status page”](#customizing-your-status-page) You can customize your status page with your company logo and favicon from *Status Pages* → *Your Status Page* → *Edit*. If you upload a dark logo variant, we’ll use that version with our built-in dark mode theme. 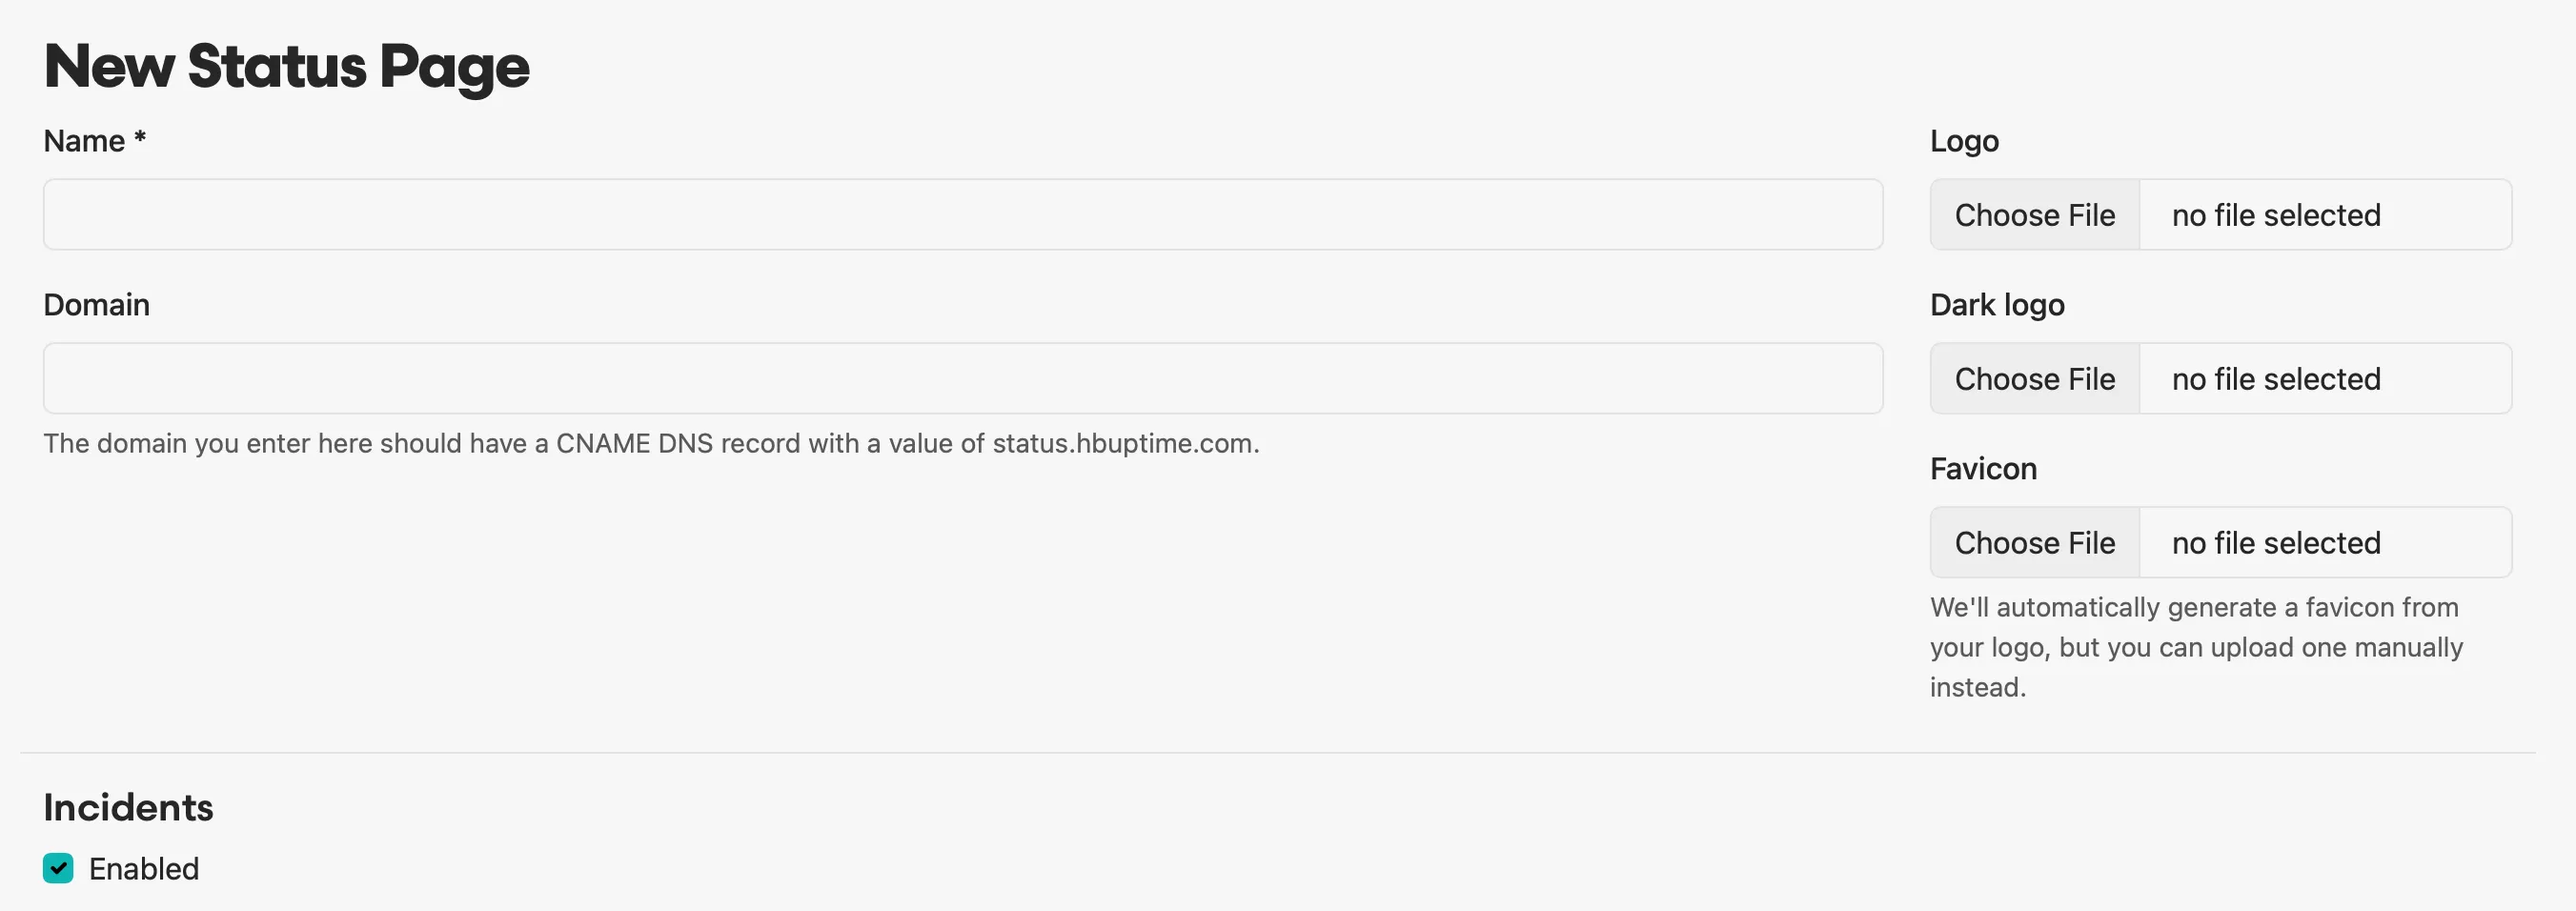 For more control over the look and feel of your status page, see the “Custom CSS” option under *Customization* at the bottom of the settings form. ## Adding a custom domain [Section titled “Adding a custom domain”](#adding-a-custom-domain) To add a custom domain, enter the domain (without the http(s)://) when editing your status page. To verify your domain, add a CNAME DNS record with a value of **status.hbuptime.com**. For example, if your domain is status.example.com, then you should add the following CNAME through your DNS provider (Google Domains, Amazon Route 53, GoDaddy, etc.): | Record type | Label/Host field | Time To Live (TTL) | Destination/value | | ----------- | ------------------ | --------------------------- | ------------------- | | CNAME | status.example.com | default is fine (i.e. 3600) | status.hbuptime.com | **Once the record has been created, click the “Verify” button under your status page back in Honeybadger:**  Now you can visit your domain in a browser. We automatically generate SSL certificates; it should be ready to go on the first visit, but in some cases you may need to refresh a few times. If you have trouble, don’t hesitate to [get in touch](https://www.honeybadger.io/contact/). ## Uptime checks [Section titled “Uptime checks”](#uptime-checks) Connect any currently running uptime checks to your status page if you’d like to share your uptime status with the world. Status pages may include uptime checks across all of the projects in your account. 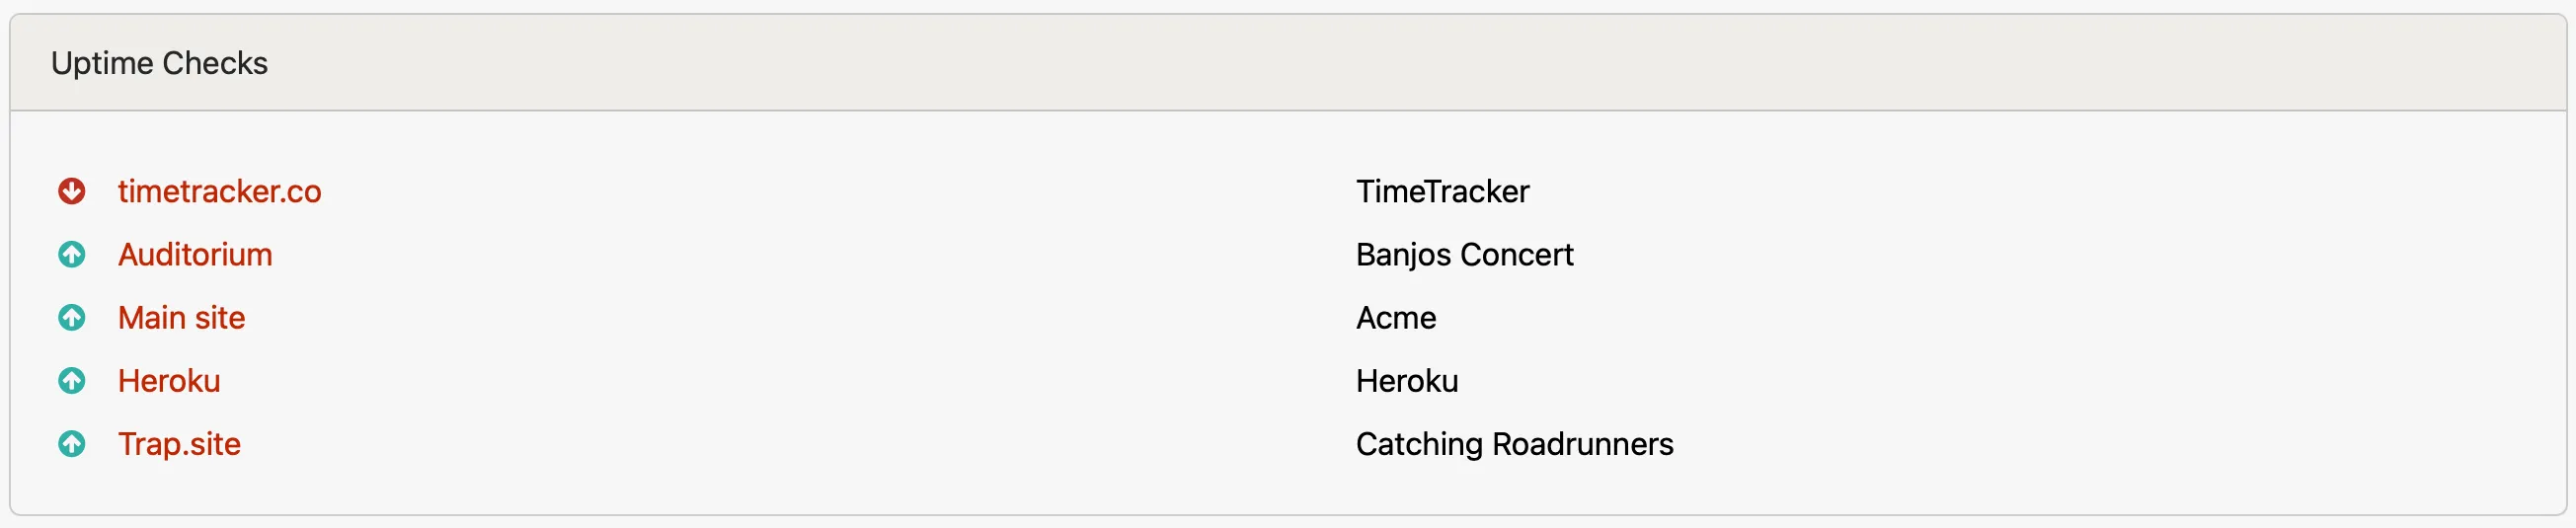 ### Connecting checks [Section titled “Connecting checks”](#connecting-checks) While editing your status page, toggle which uptime checks you would like included with your status page. 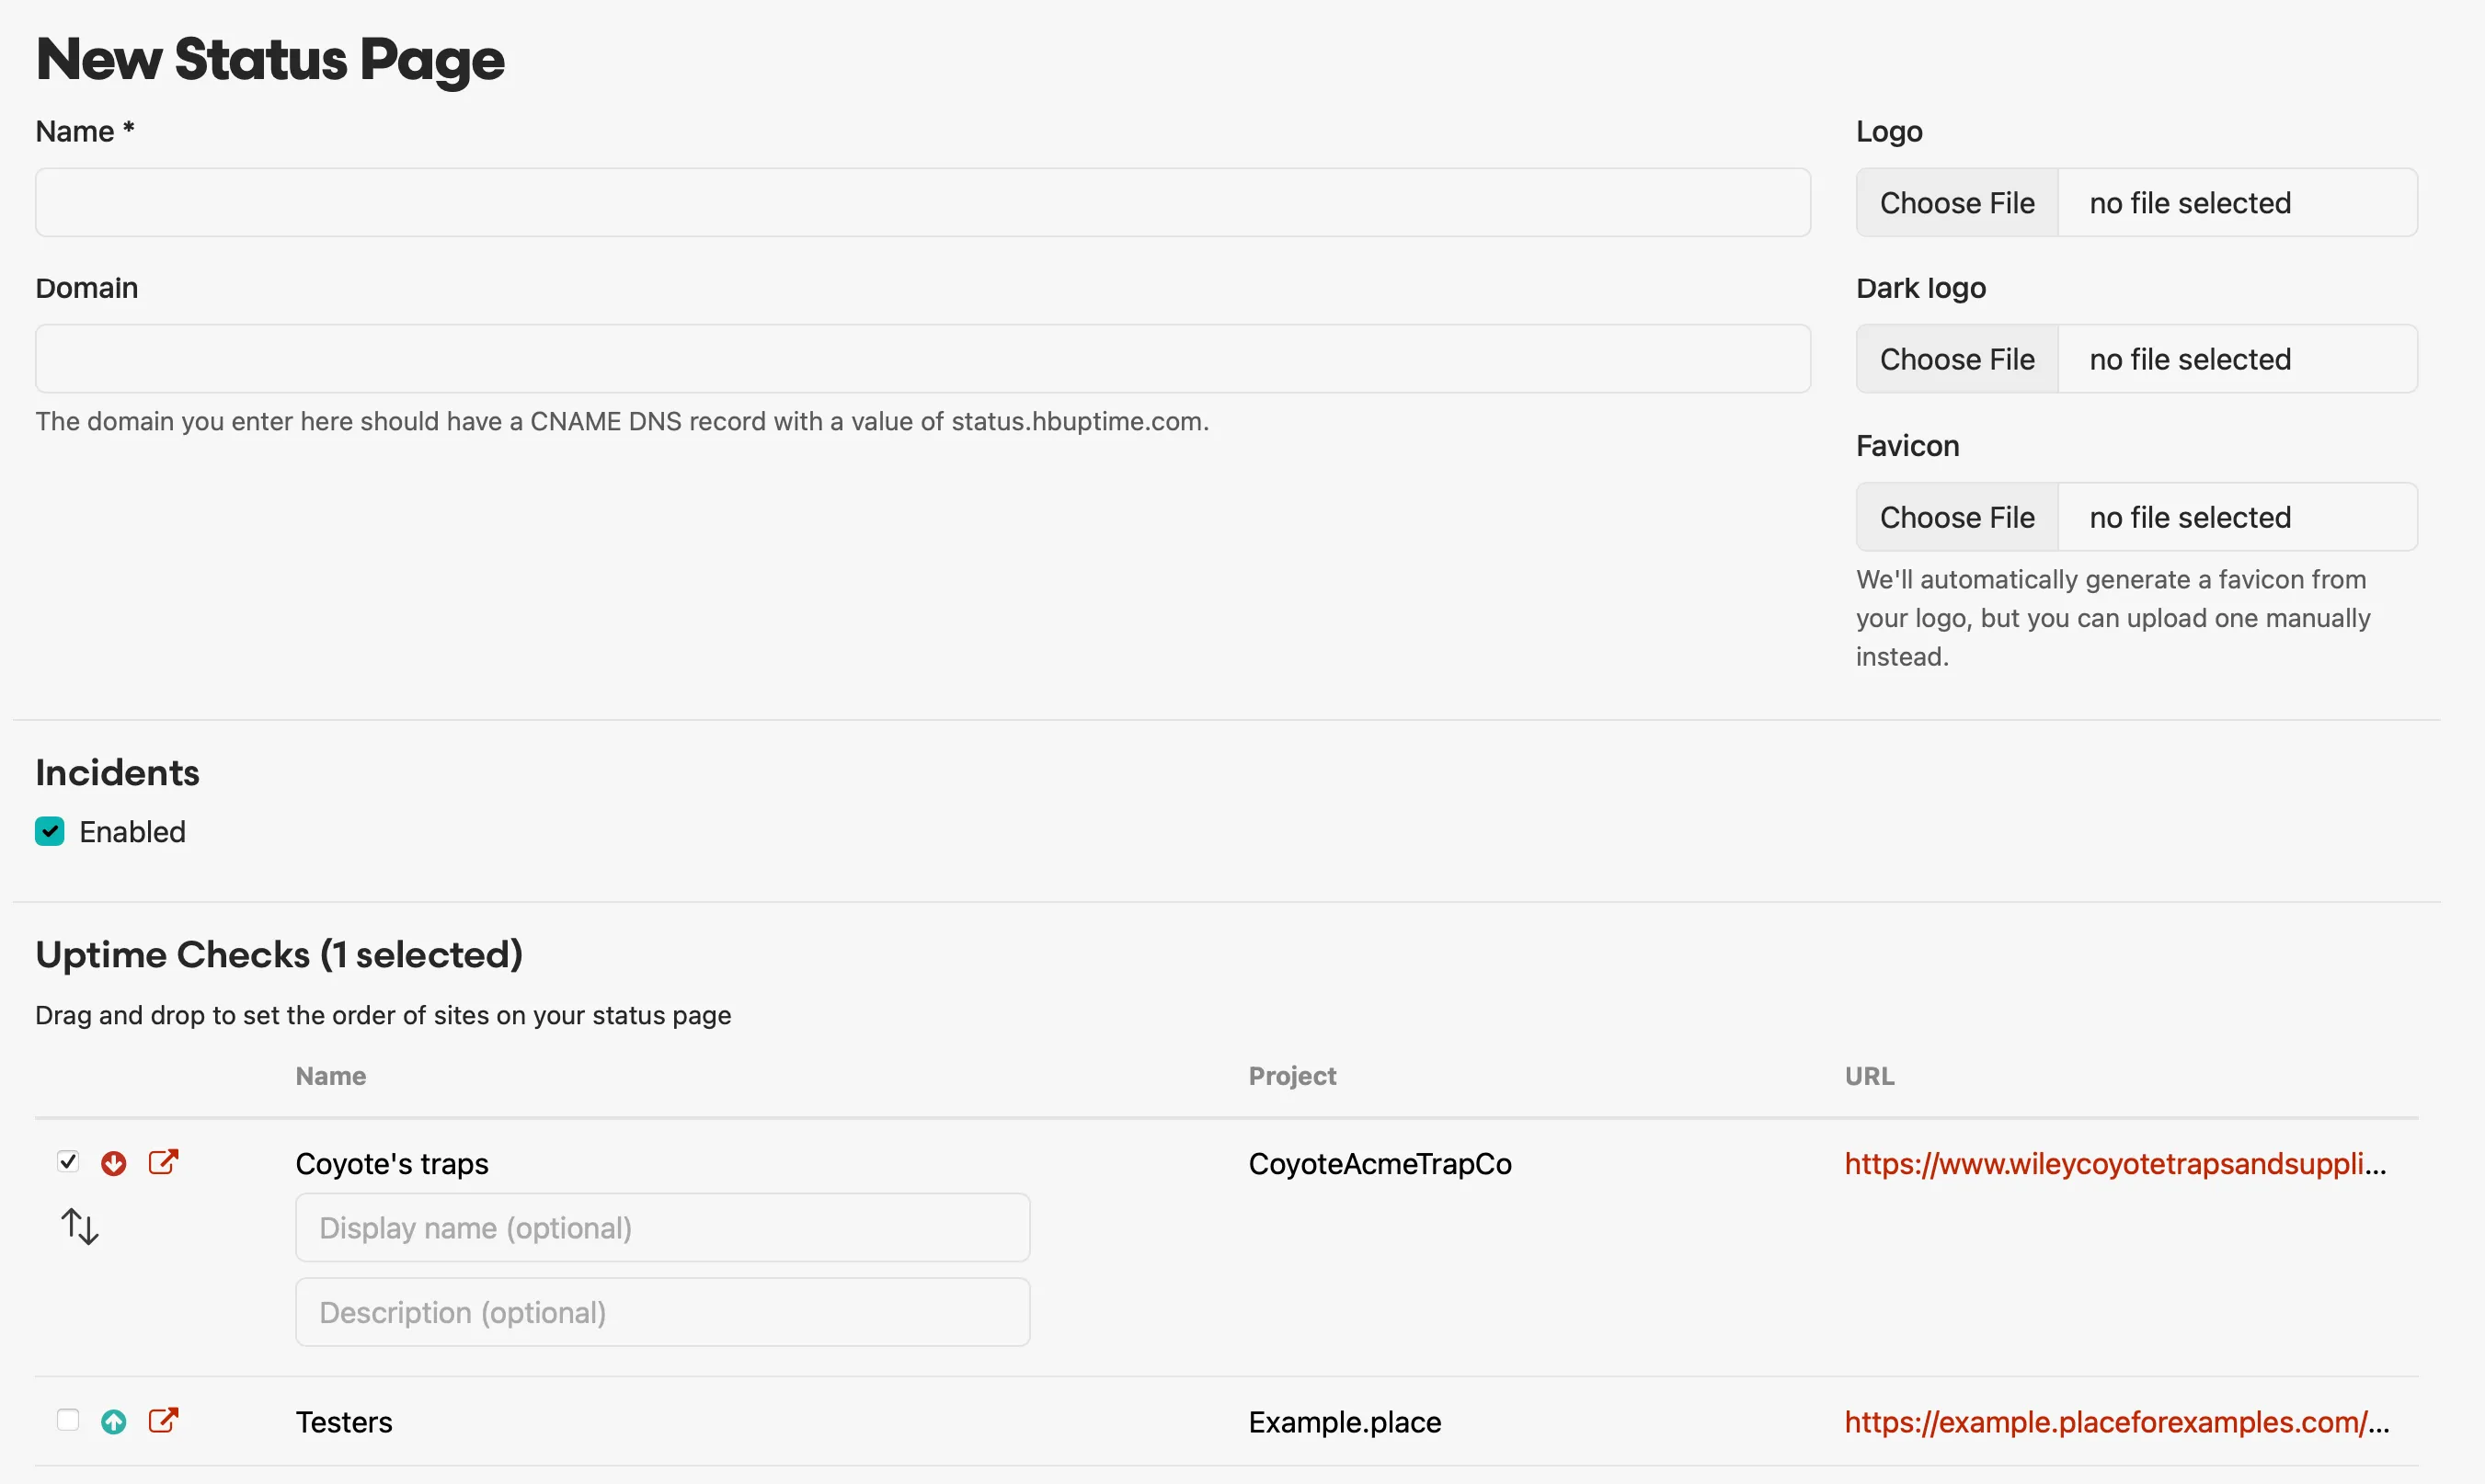 Give each uptime check an optional display name if you want to customize the name displayed publicly. That’s it! We will show each uptime check’s current status and history on your public status page. ## Incidents [Section titled “Incidents”](#incidents)  An incident is an effective way to communicate system issues to your users. It can also inform your users of upcoming planned maintenance or downtime. Conceptually, an incident is a container for timestamped updates that describe the context surrounding a problem affecting your system. An incident can be as simple as a single update that explains some minor downtime, or it can span multiple days with many updates, each representing the changing severity and status of the incident. ### Creating incidents [Section titled “Creating incidents”](#creating-incidents) We provide three scenarios when creating incidents: `Current`, `Scheduled Maintenance`, and `Retroactive`: #### Current [Section titled “Current”](#current)  Current incidents start with one update and are typically open after creation (meaning you would not select “Resolved” as the starting status.) #### Scheduled maintenance [Section titled “Scheduled maintenance”](#scheduled-maintenance)  Scheduled Maintenance incidents are notable because you can queue updates for later posting. You can create up to three future updates, which we will post at the supplied `Start Time`. Typically you will send out a `Maintenance scheduled` update that describes the type of maintenance you will perform and when. After that, we have both `In Maintenance` and `Maintenence complete` statuses that you can queue up as individual updates. It’s up to you how much lead time to give your users, based on how you stagger the timing of each update.  If you complete your maintenance sooner than expected, you can always edit the queued update and use the “send now?” button to post the update immediately. #### Retroactive [Section titled “Retroactive”](#retroactive) 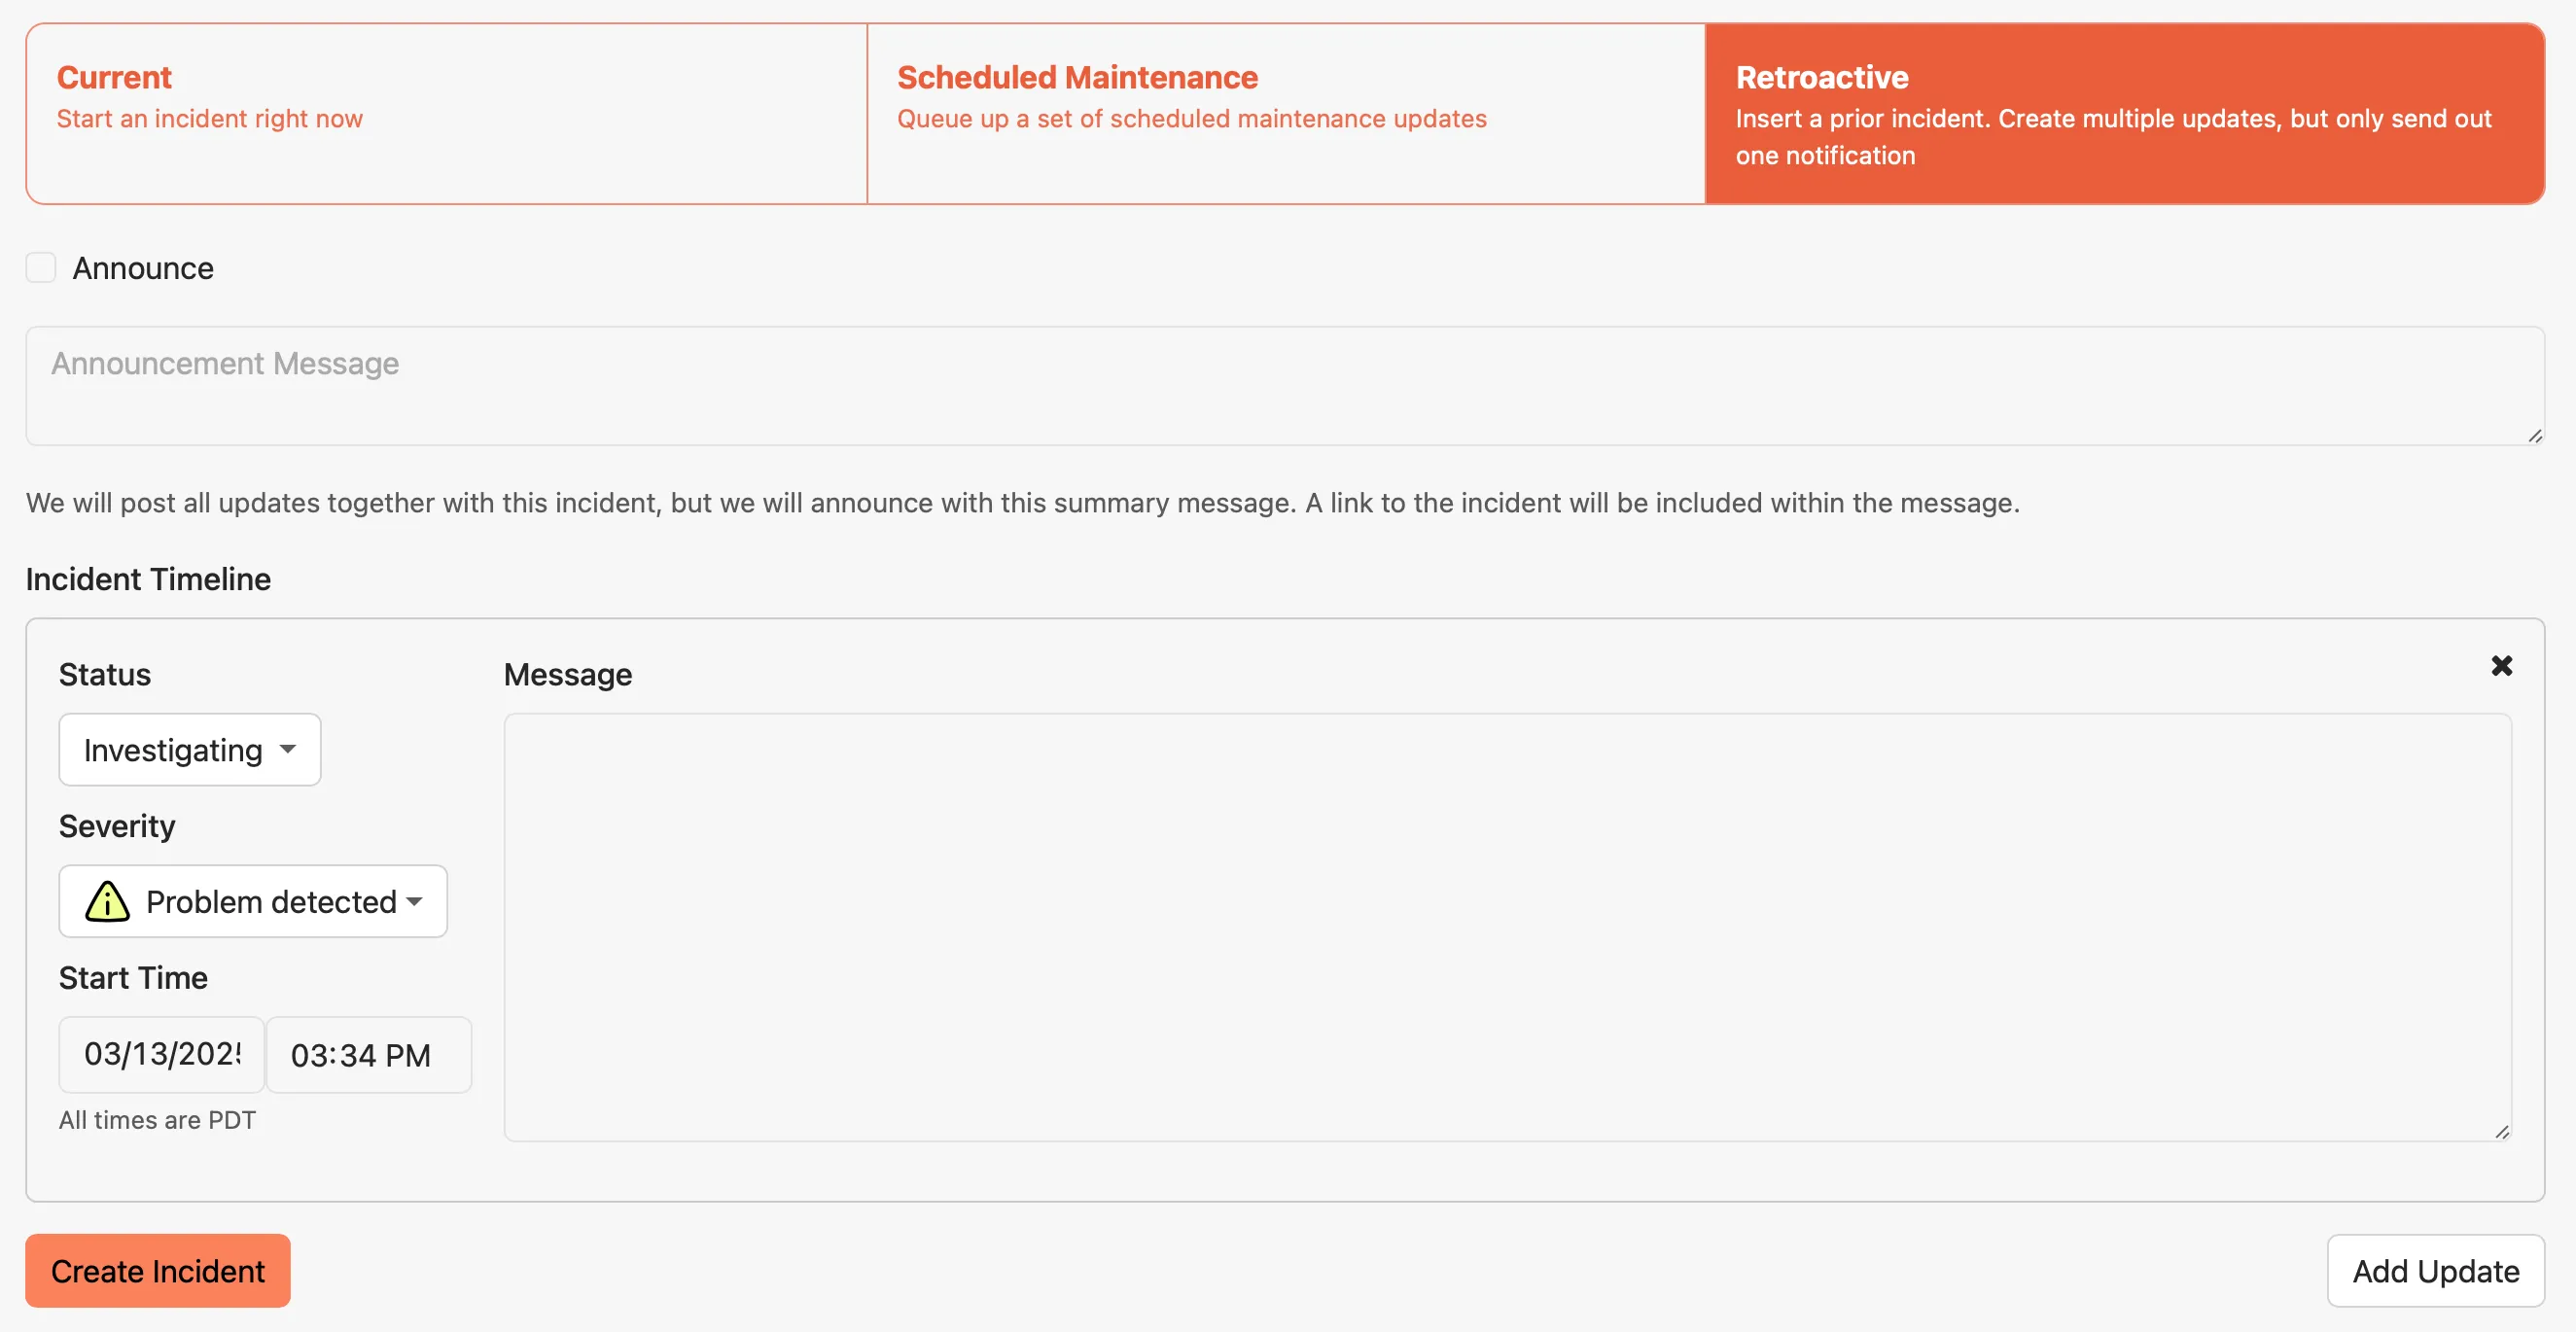 Retroactive incidents give you a tool to create multiple incident updates in one operation. You can create a closed incident from months ago or an open incident that started minutes ago. If you don’t end with a [closing update](#open-and-closed-incidents), the incident will be considered open. A retroactive incident also allows you to craft a single [announcement](#announcing-updates) message to accompany your incident updates. This way, you have the option to summarize the incident yet keep each event as separate updates. ### Posting an update [Section titled “Posting an update”](#posting-an-update) 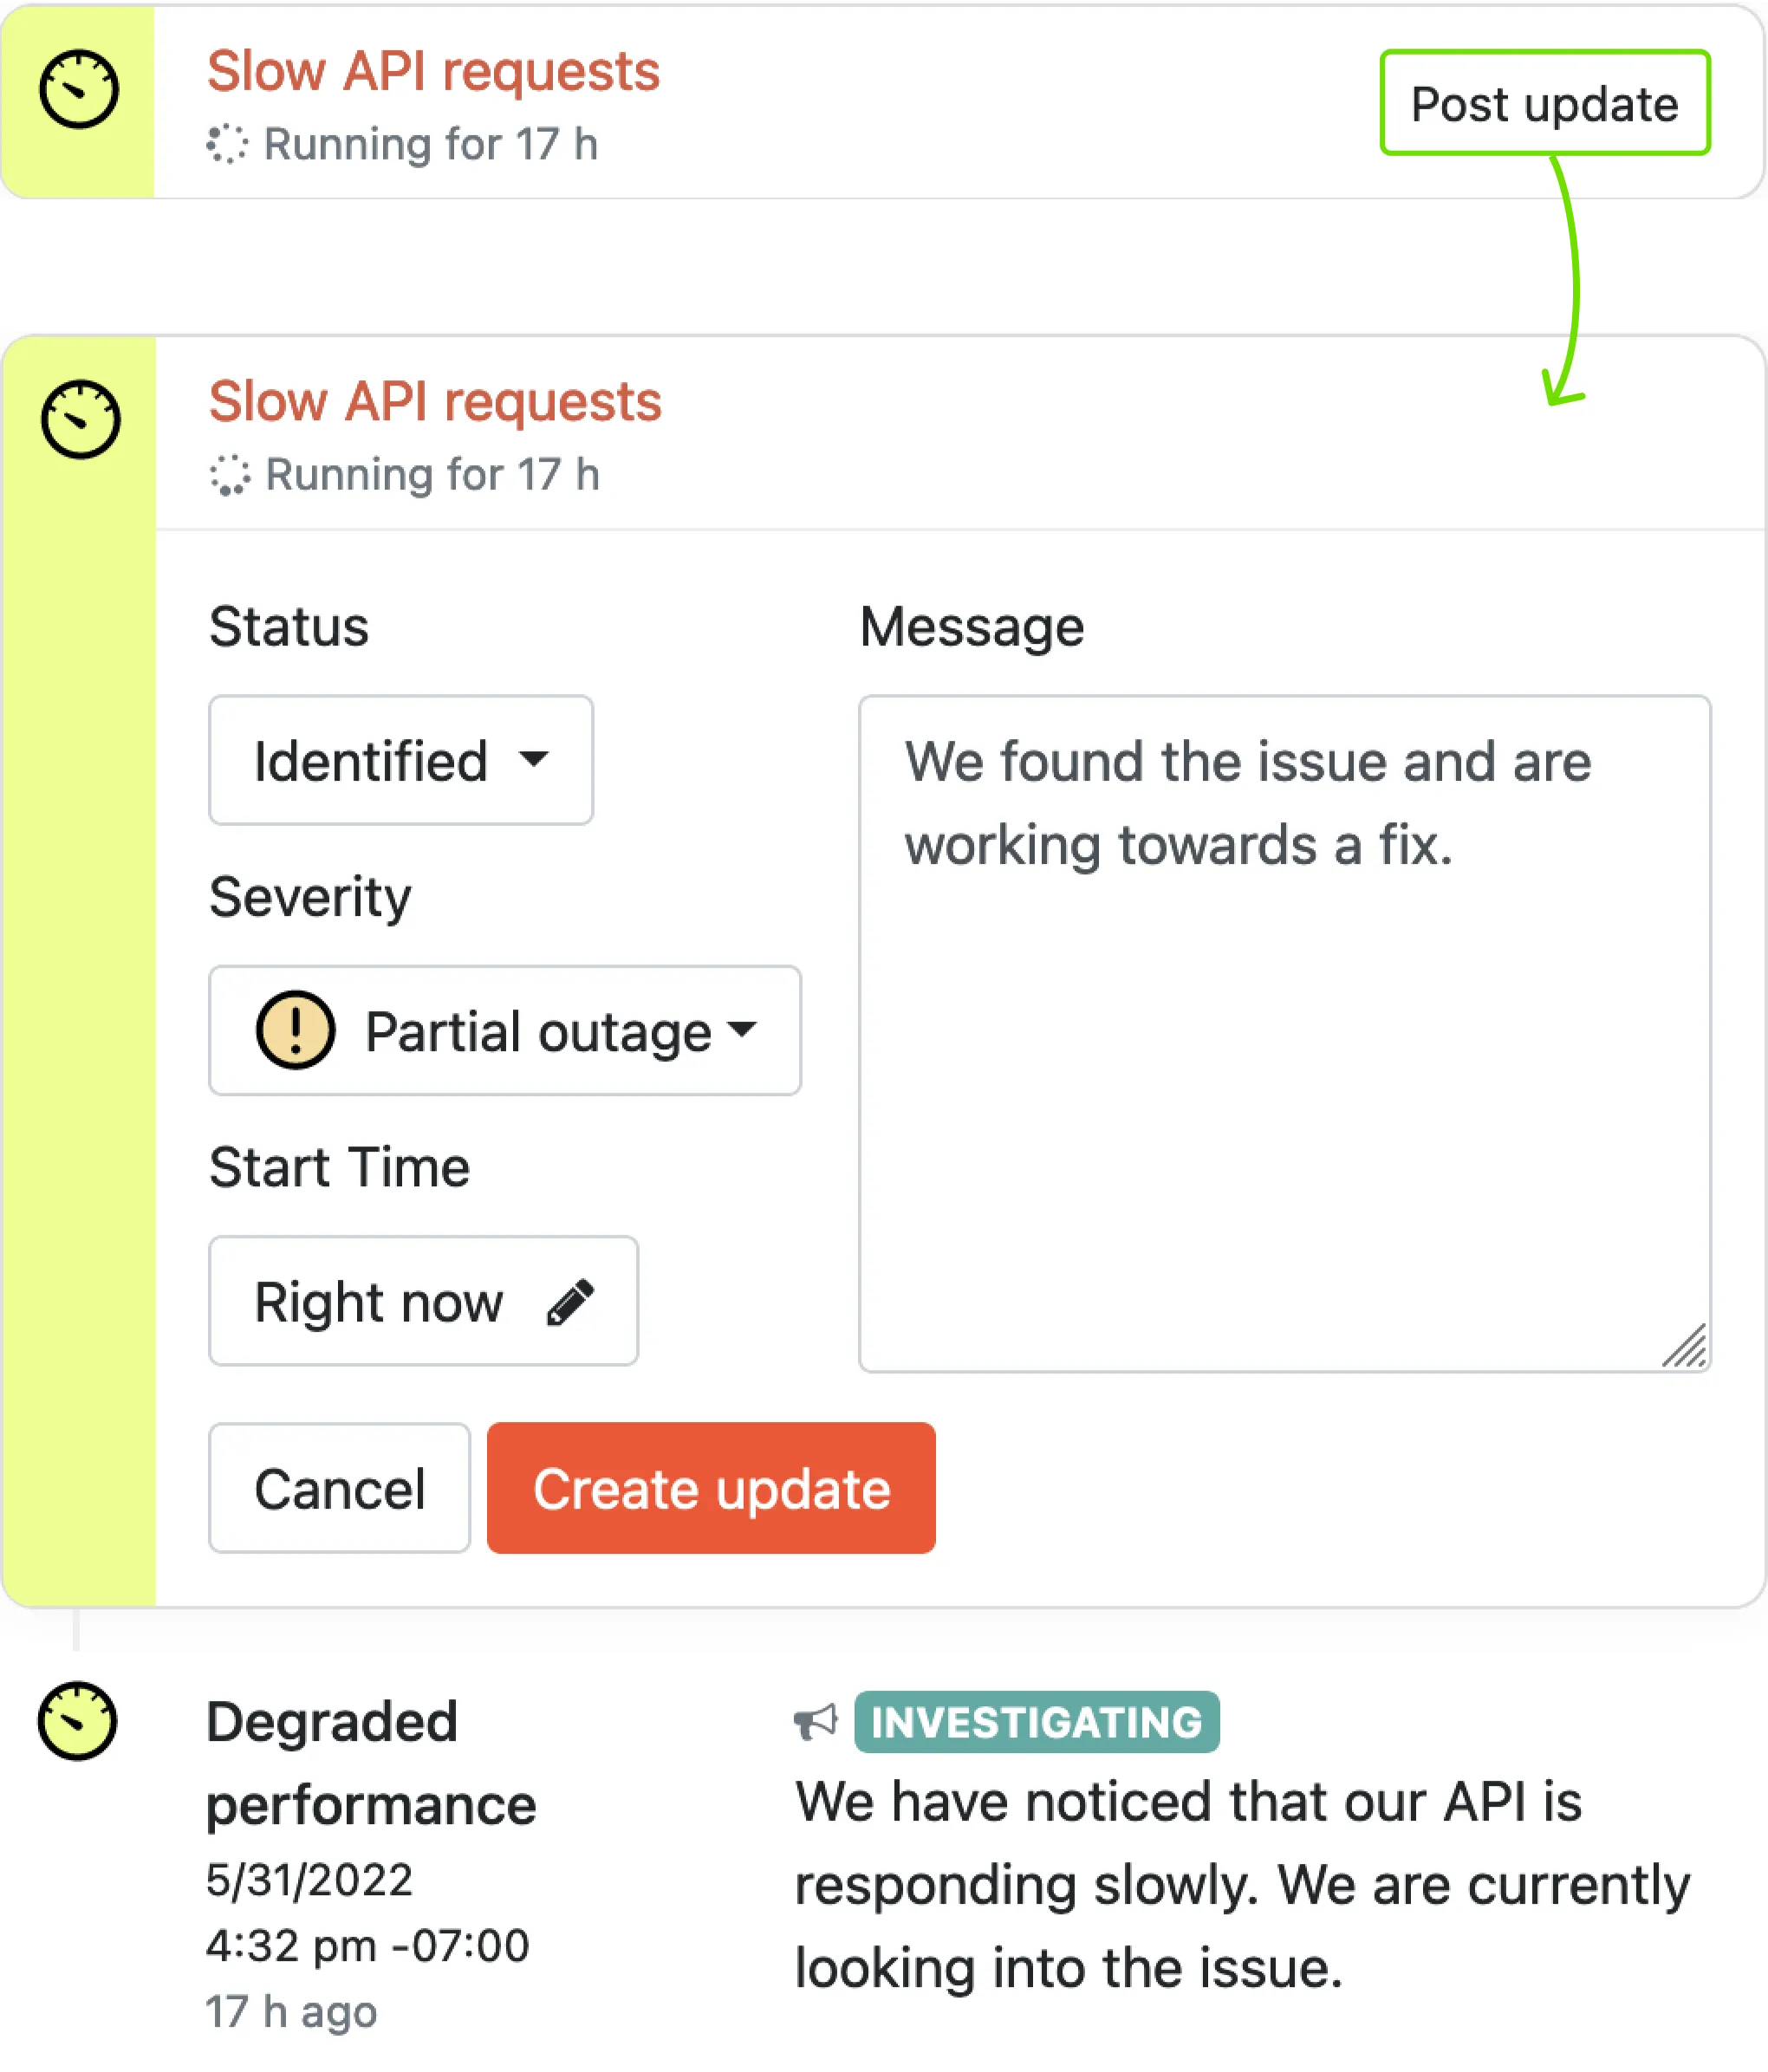 When you are ready to inform your users with an update to your incident, click the button in the incident header and fill in your update inline. ### Severity and status [Section titled “Severity and status”](#severity-and-status) When you create an incident or post a new update, you choose a `status` and `severity`. `status` describes where you are in the process of resolving your incident and `severity` describes how your system is currently affected by the incident. Scheduled maintenance incidents have a special set of statuses. You can, however, post an update during scheduled maintenance with an incident status, say if things go awry. ### Open and closed incidents [Section titled “Open and closed incidents”](#open-and-closed-incidents) An incident, when created, is considered “open.” It will be prominently displayed on your internal status page and made visible as an “active incident” on your public status page. When you provide an update containing a status that closes the incident, it will be “closed” and moved to the historical list of closed incidents. Even if you have closed an incident with an update, you can always re-open it by posting an update with a new status. While this is possible and useful if something comes up right after closing an incident, we recommend you open a new incident if a significant amount of time has passed. ### Announcing updates [Section titled “Announcing updates”](#announcing-updates) 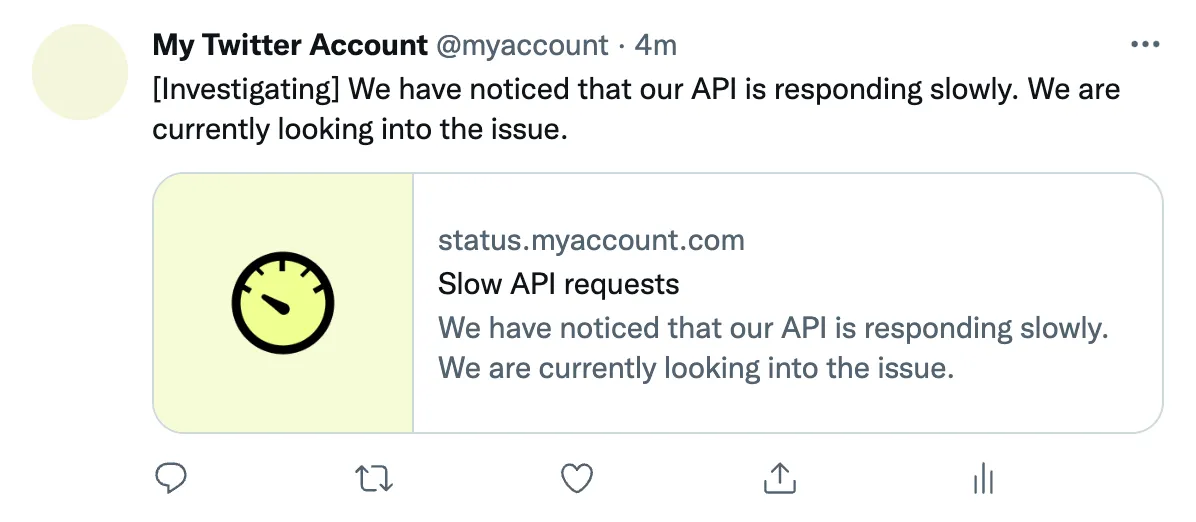 We provide the option to connect your status page to a Twitter account (while editing the status page). Linking your Twitter enables us to announce your incident updates to the world. Once connected, a new “Announce” option will be available while crafting any incident updates. 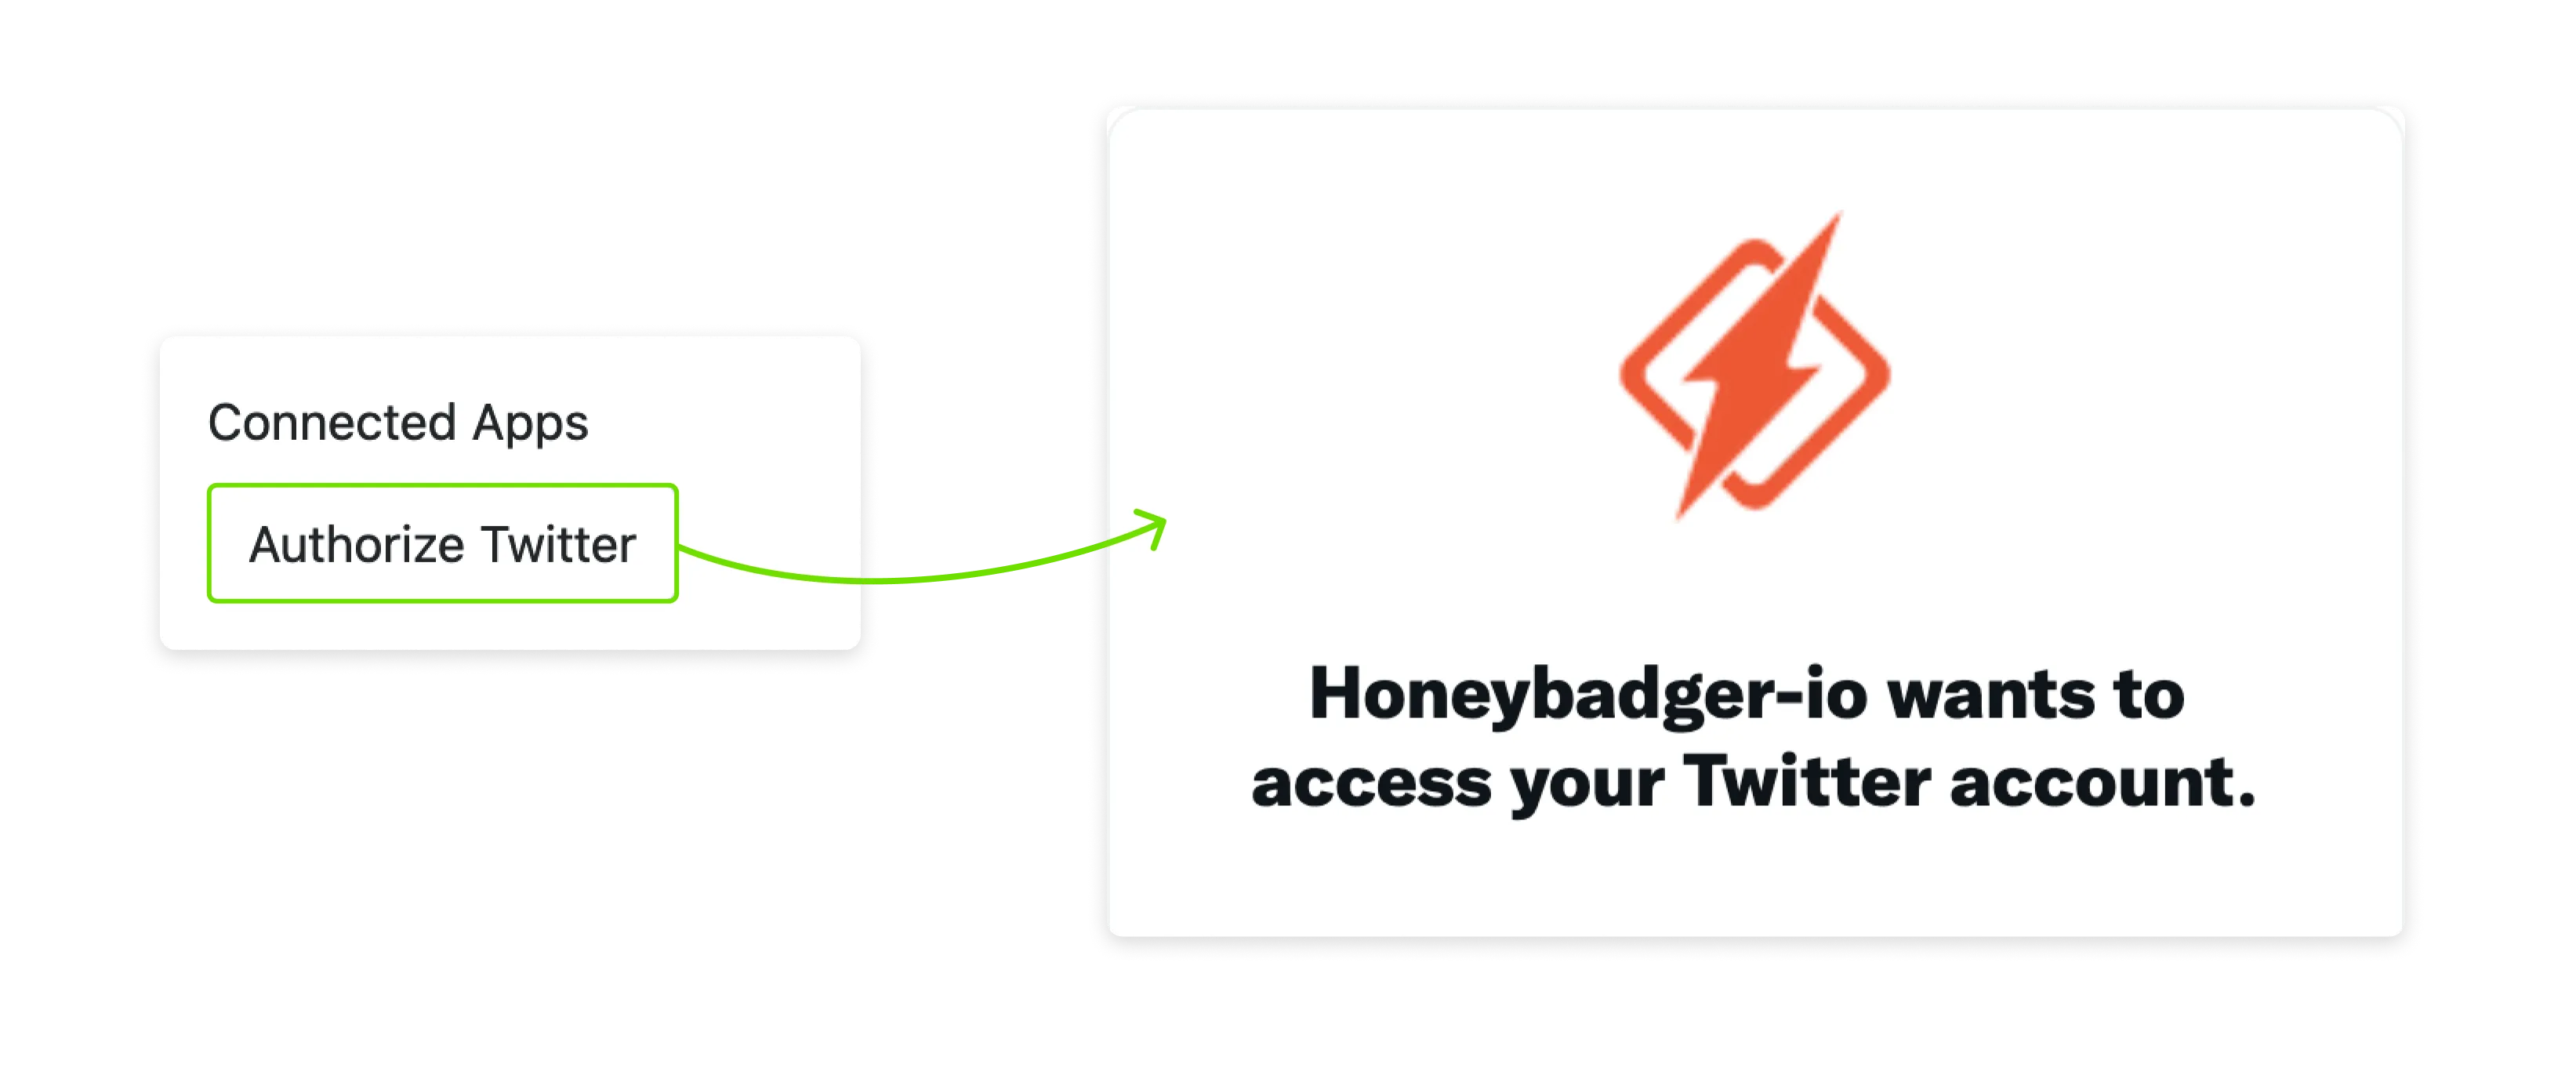 ## Password protection [Section titled “Password protection”](#password-protection) Honeybadger status pages can be configured to require a username and password before they can be viewed. This is useful for private or internal status pages that only those in your company should be able to view. To enable password protection, edit your status page and check the “Require a username and password” checkbox. Set your desired username and password in the fields below. If you are using a password manager, be sure you don’t overwrite your login information for the Honeybadger app itself. 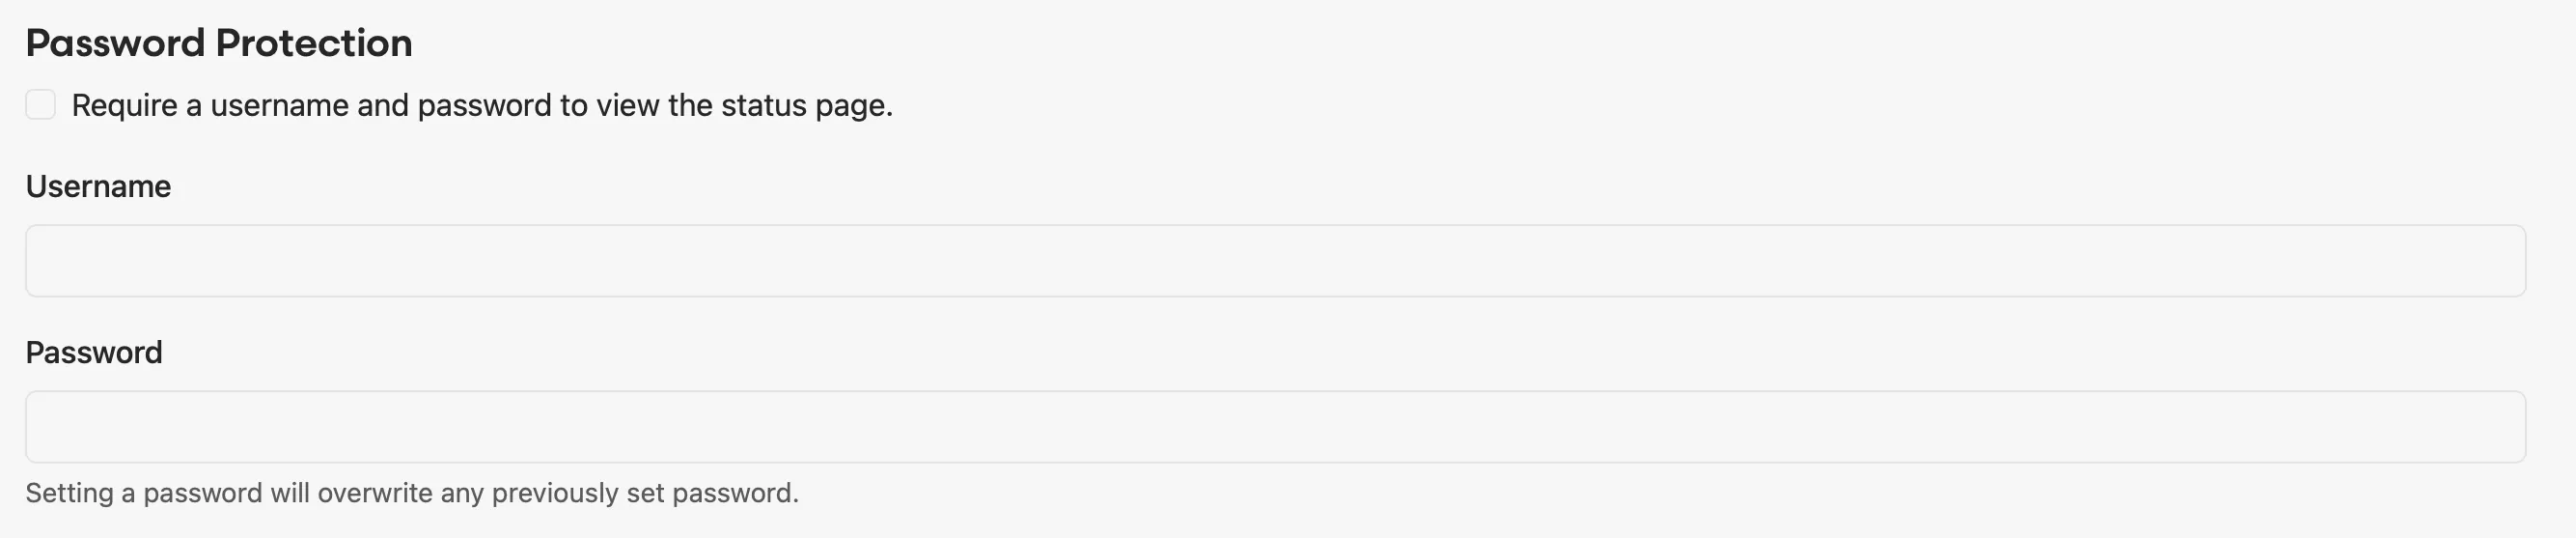 ## Embedding status updates [Section titled “Embedding status updates”](#embedding-status-updates) 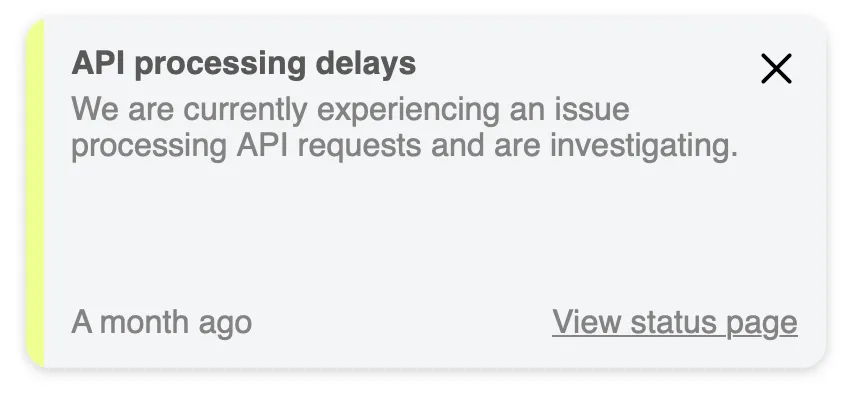 Incident management often requires communicating outages with your customers. With the status page embed feature, you can keep your users up to date when they visit your website. ### Setup and usage [Section titled “Setup and usage”](#setup-and-usage) Each of your status pages will have their own unique installation instructions, go to your status page info page, you’ll find the link towards the bottom of the page.  Copy the snippet of code and paste it anywhere in the HTML of your site. 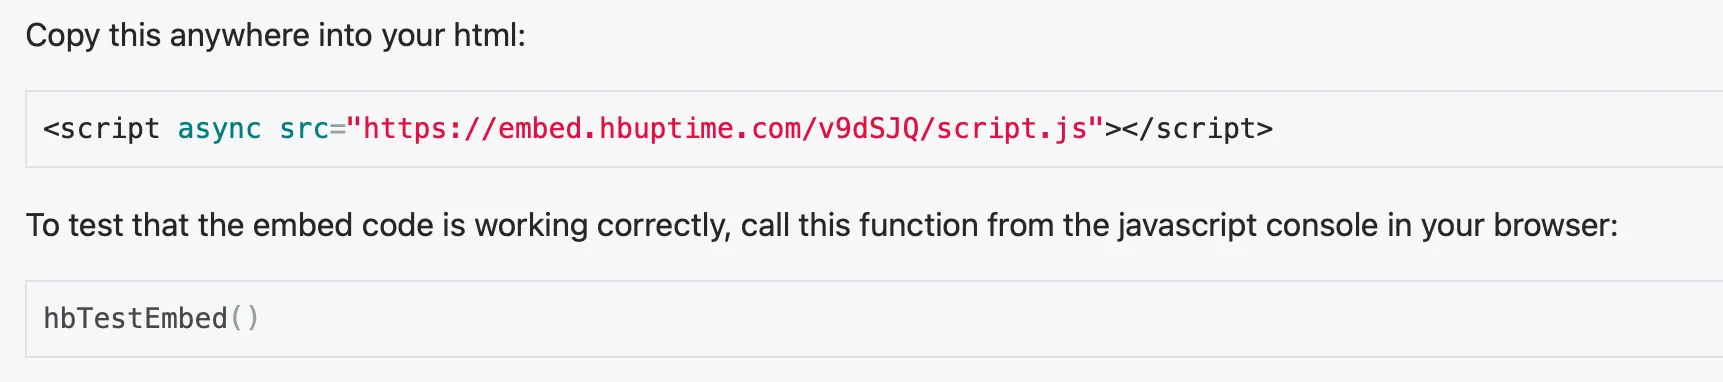 Like the status page, when you start an incident, the embed feature will always display the latest update to your users. ### Customization [Section titled “Customization”](#customization) The embed pop-up can be customized to better fit the look and feel of your site. Use the customization tool to adjust how you want it too look. When you are ready, copy and paste the HTML snippet onto your site. Here are some of the options you can customize: * **Position** — Change where the popup will appear: bottom left (default), bottom right, top left, or top right. * **Font color** — Set the font color of the text. Any valid CSS font color value can be used. * **Background color** — Set the background color of the pop up. Any valid CSS color value can be used. * **Close button behavior** — By default, the pop up will always show on page load. You can enable the persist feature so that when your visitor closes the pop-up, a browser cookie will be set so that it doesn’t pop up again until your next update. The cookie gets set to expire upon browser or session close. 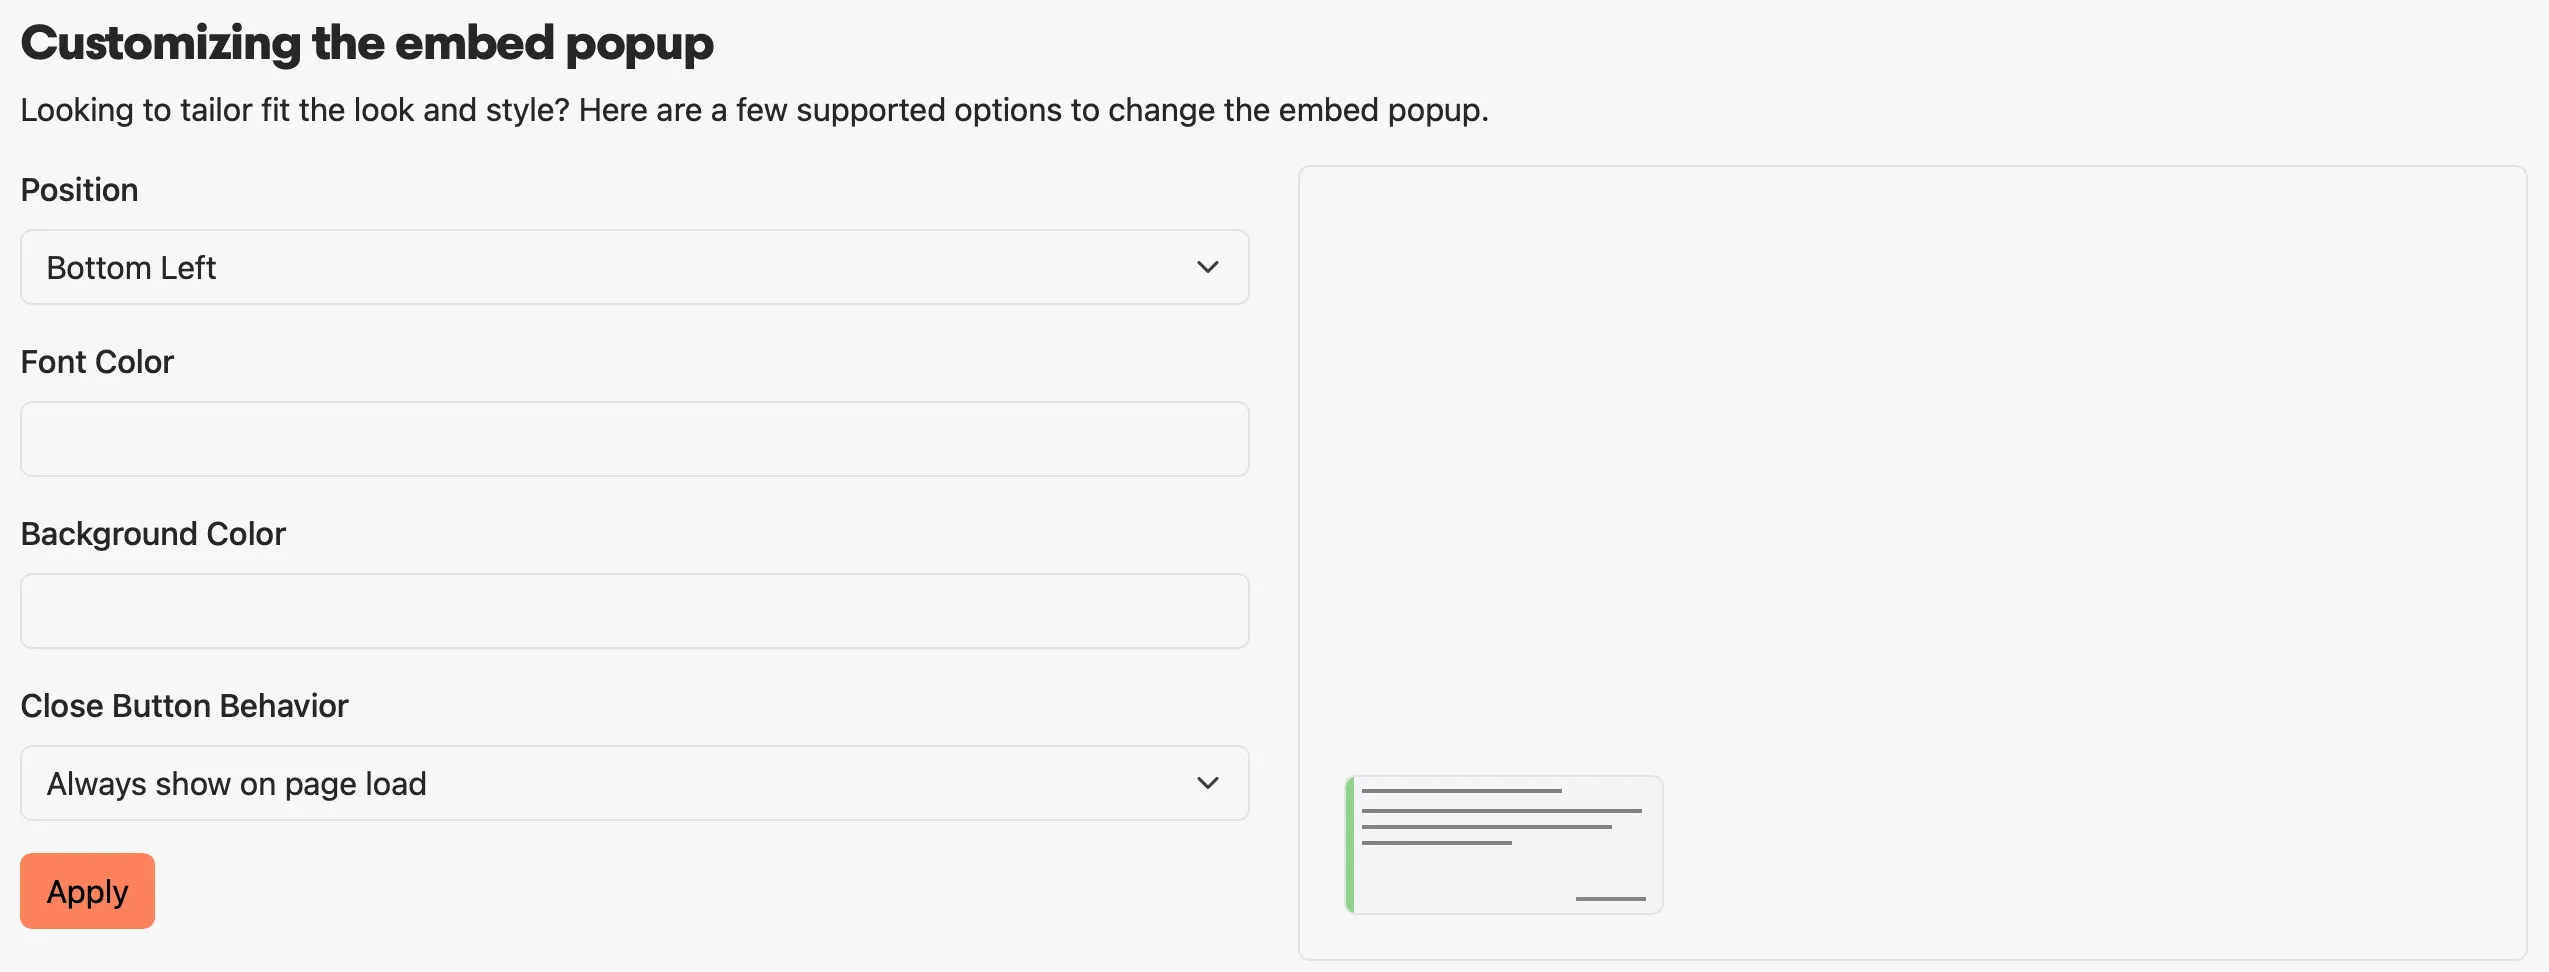 ### Displaying scheduled maintenance [Section titled “Displaying scheduled maintenance”](#displaying-scheduled-maintenance) The status page embed works great with the schedule maintenance feature. Create your scheduled maintenance messages as noted above. Once the “Start Time” for your messages have passed, your visitors will see the latest update on your site via the embed pop up. ### Displaying non-incident messages [Section titled “Displaying non-incident messages”](#displaying-non-incident-messages) If you have both an ongoing incident and a non-incident message enabled at the same time, the incident update messages will take precendence over the non-incident message. ### Password protected status pages [Section titled “Password protected status pages”](#password-protected-status-pages) If your account has the password protected feature and you have enabled the feature for your status page, the embed feature will become disabled. To use the embed feature, you’ll need to disable the password protection feature. ## SEO and analytics [Section titled “SEO and analytics”](#seo-and-analytics)  ### Search engine indexing [Section titled “Search engine indexing”](#search-engine-indexing) By default, search engines can find and index your status pages—meaning they can end up in search results. You can turn off this behavior by checking the “Do not allow search engines to index my search page” checkbox. Search engines may take time to update their results if your status page is already indexed. If you want added protection and privacy, look at our [Password Protection](#password-protection) feature to prevent unwanted access to your Status Page. ### Google Analytics [Section titled “Google Analytics”](#google-analytics) You can also add your Google Analytics ID to enable Google Analytics tracking for your Status Page.
# Uptime monitoring
> Get notified when your API is unresponsive.
Your Honeybadger account comes with uptime monitoring. Our geographically distributed network of friendly robots will ping your site every few minutes. If a check fails, we’ll let you know. You can set up fairly sophisticated checks based on the HTTP status code, or the response body.  ## Setup [Section titled “Setup”](#setup) Note Enabling bot protection on Cloudflare-hosted websites may prevent uptime checks from working. 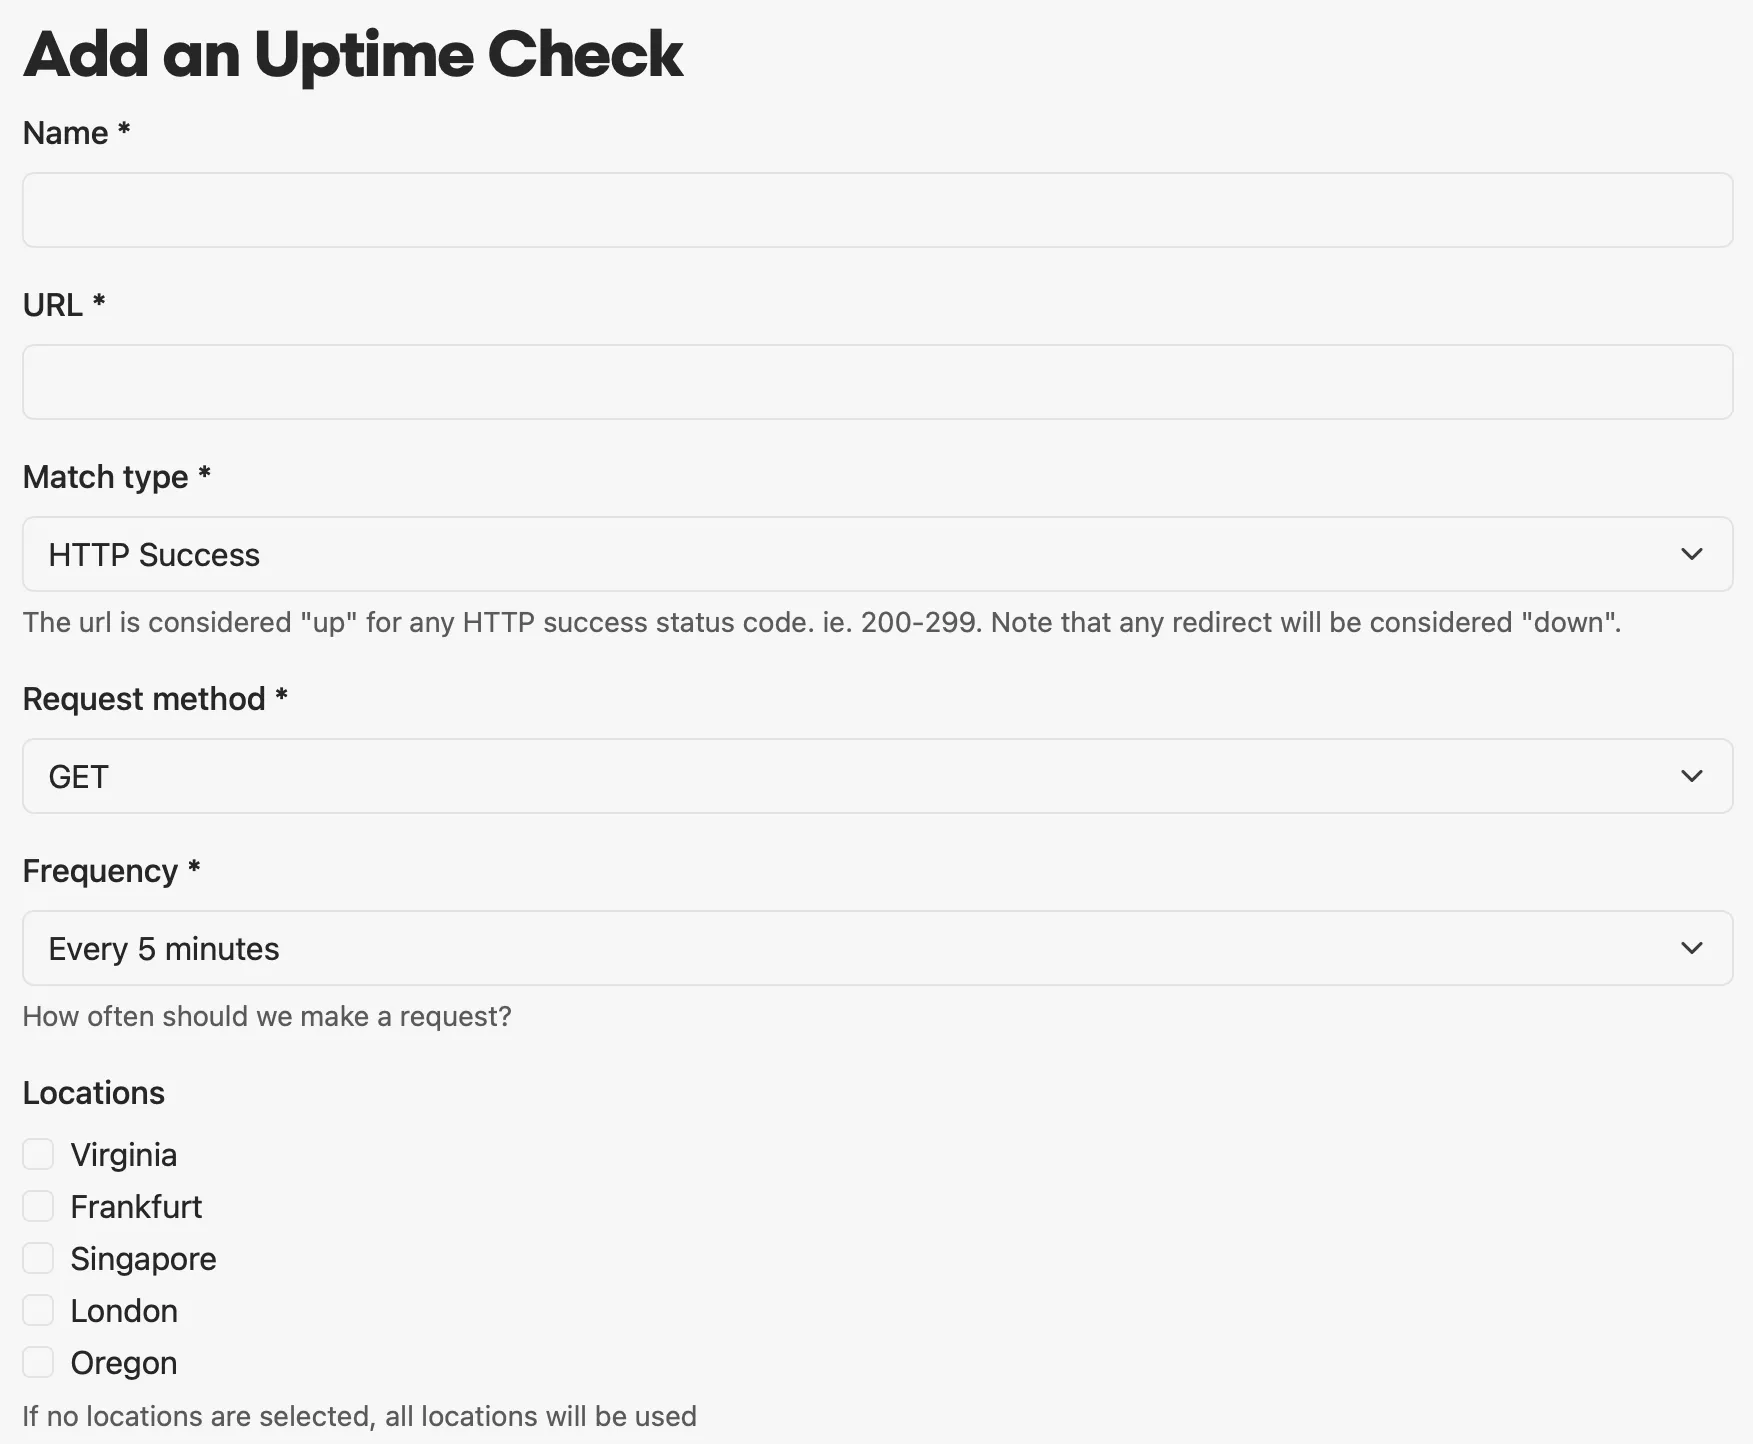 When creating an uptime check, just tell us what URL you want monitored. You can choose what counts as a success response from these options: * **Success** - notifies you that your site is down when your server responds with a non-20x status code. When in doubt, this is the one you probably want. * **Exact** - prompts you to enter an HTTP status code. If you entered 302 it would ensure that the server responds with a 302 status code. * **Response body includes string** - prompts you for a string (i.e. “Error”) and notifies you when the response body matches. * **Response body excludes string** - prompts you for a string and notifies you if the response body does *not* match. * **Response body matches JMESPath expression** - allows you to specify a [JMESPath](https://jmespath.org) expression that is evaluated against the JSON returned in the response. For example, an expression like ``queue.depth < `10` ``will evaluate to true for a JSON response like `{"queue":{"depth":2}}`. You have the option to specify response header checks. For example, you can check if the response header `Content-Type` contains `application/json`, or whether the `location` header redirects to the correct URL. All response header checks must evaluate to true for the check to be considered successful, and the check values are case-sensitive. You can also choose to send custom request headers or a custom request body, check the validity of the SSL certificate, and select which locations should be used for monitoring. You can optionally give each of your uptime checks a custom name, which will be the default label for when included on a Status Page. Hit “save” and you’re done! ### Timeouts [Section titled “Timeouts”](#timeouts) Each uptime check has a timeout of 30 seconds by default. If your URL does not respond within this time, it will be marked as failed for that location. Business and Enterprise customers can customize the timeout setting for their uptime checks. The timeout field allows you to specify how long the uptime check will wait for a response before reporting the site as down. The default is 30 seconds and the maximum is 120 seconds. ## Outage notifications [Section titled “Outage notifications”](#outage-notifications) 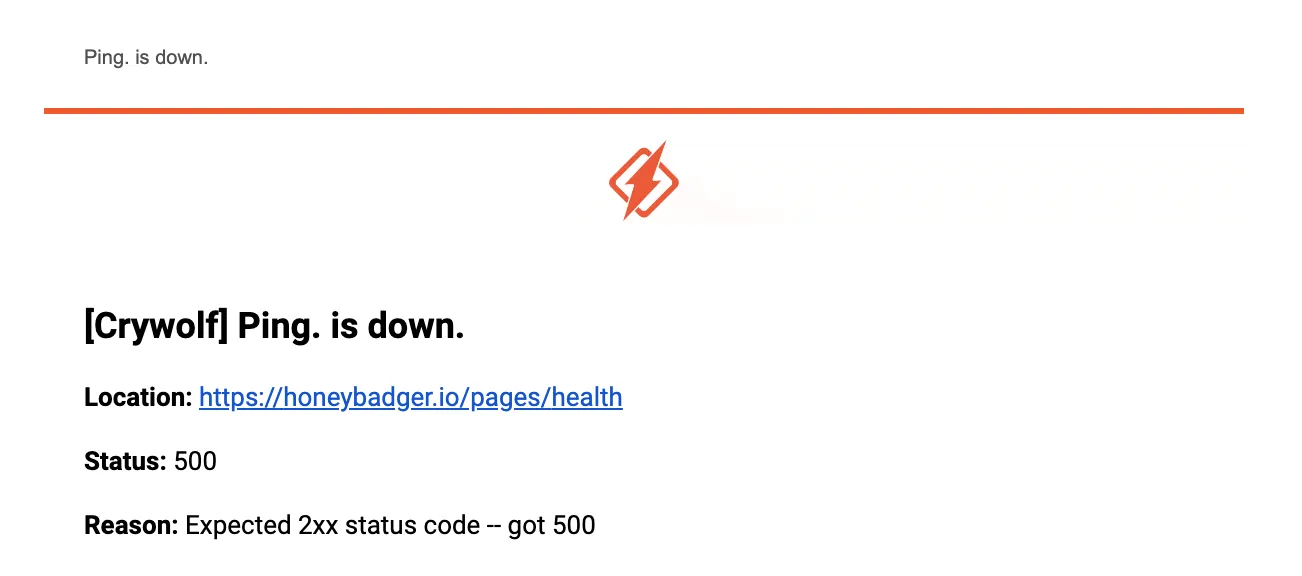 When your site goes down, we’ll notify you with all the details about what went wrong, including how your check failed. For example, you will see receive a notification like this one when the uptime check expected a successful status code but returned a 500. By default, the notification is sent after half of the locations report a failing check. This means that if you are using five locations, there would need to be three failures in a row before you would receive an alert. You can override this default by specifying a value for the Outage Threshold field. ## Outage details [Section titled “Outage details”](#outage-details) When you get a notification that a check has failed, we’ll also link you to a web page with details. This detailed view can be accessed by clicking the “View” link for any particular uptime check in the UI. At the top, the average load time over the past week will be displayed, as well as the uptime check itself. 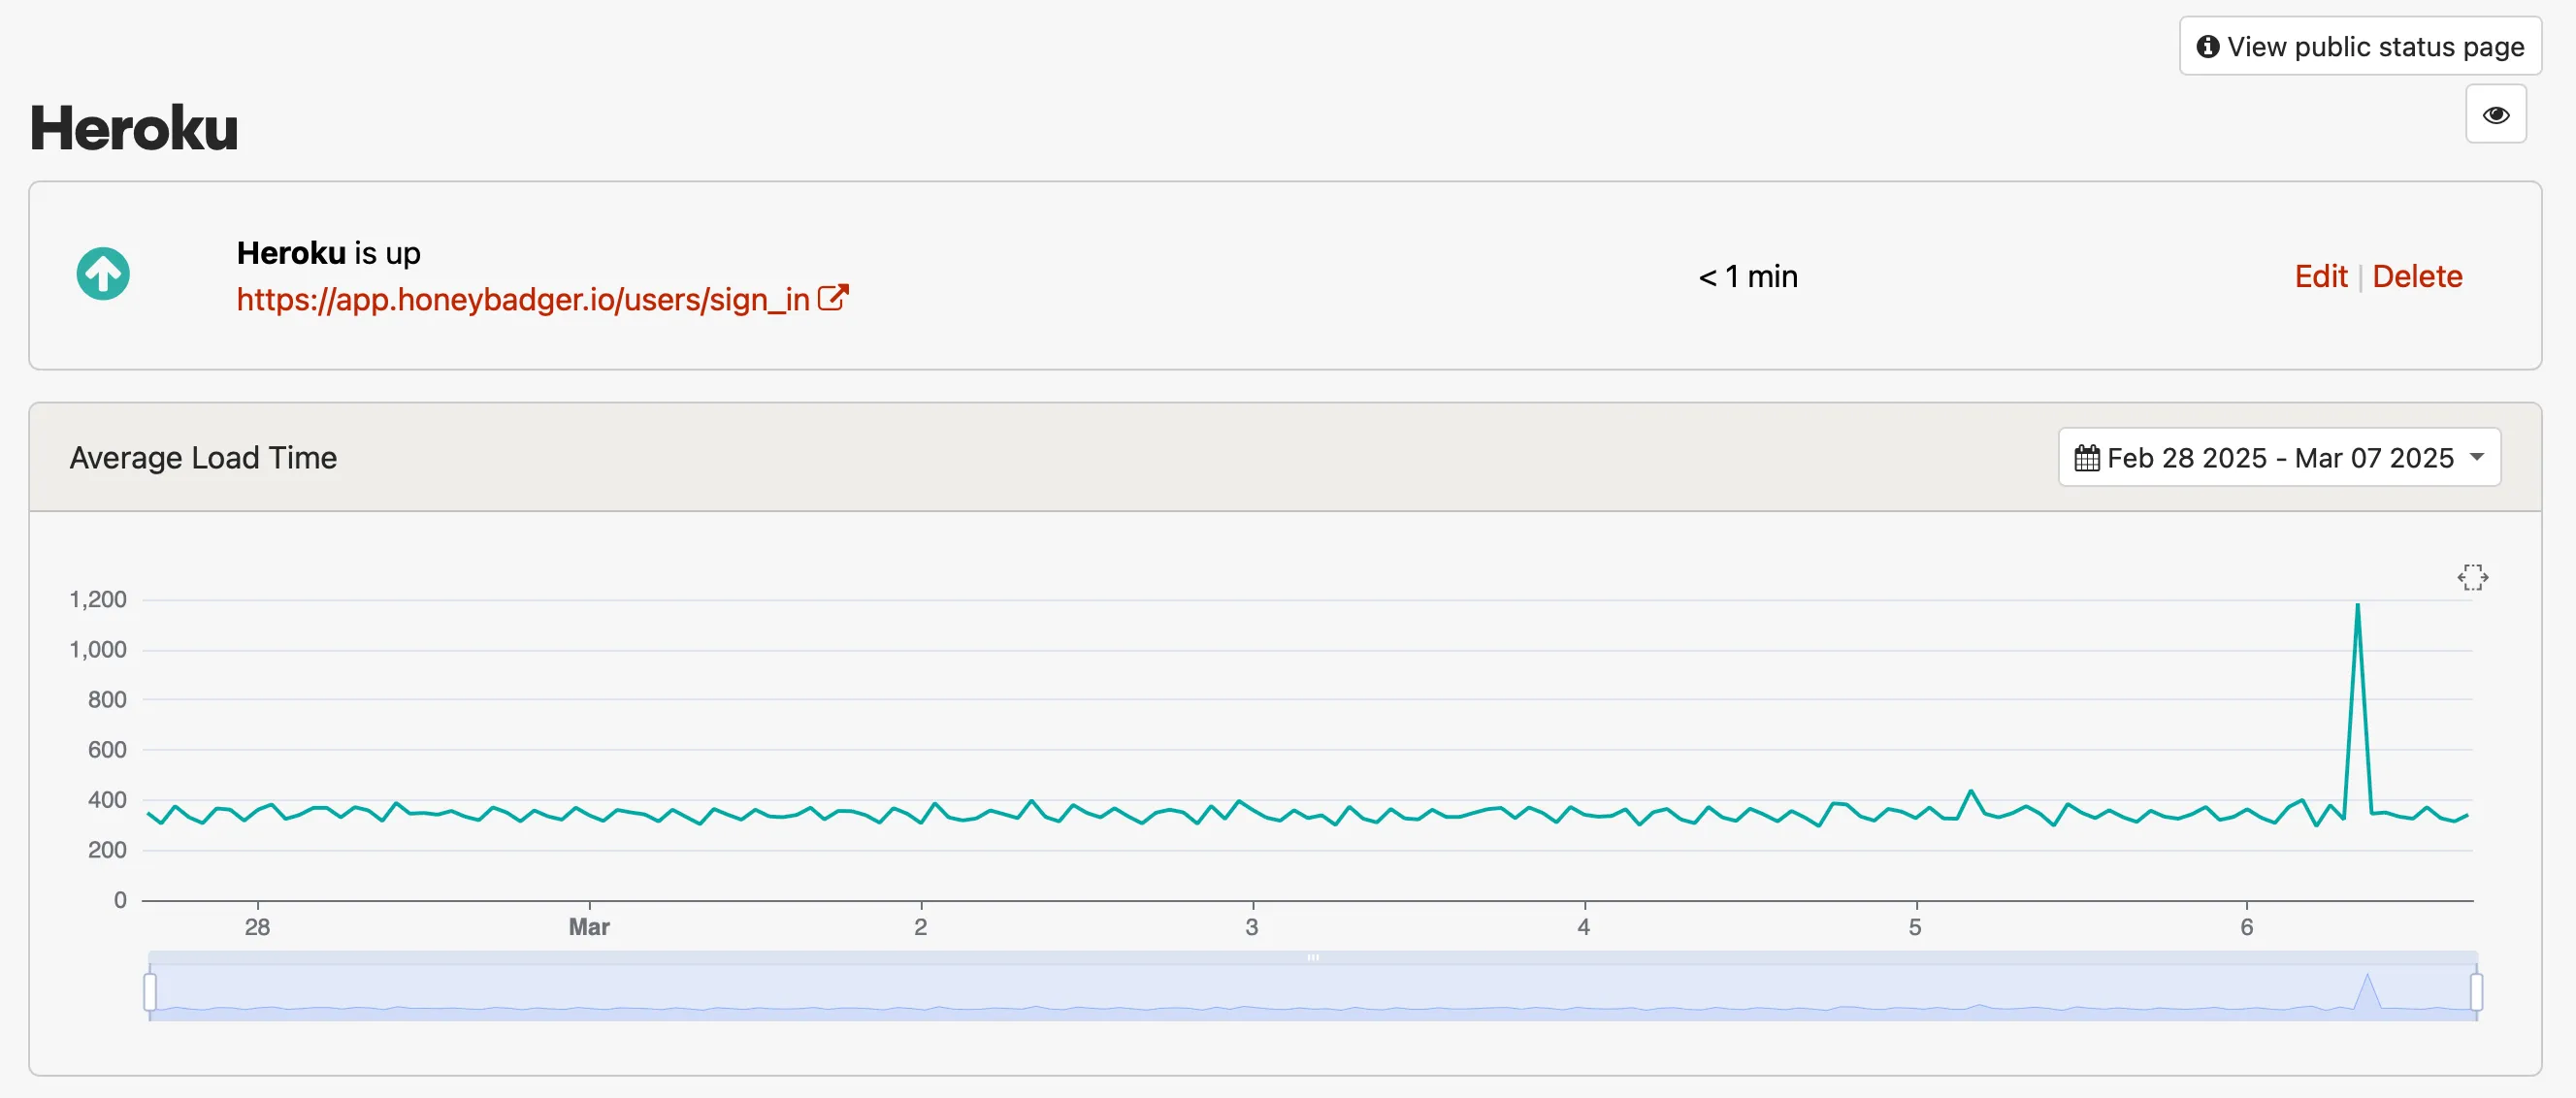 Scrolling down, you can see the uptime on a percentage-monthly basis. 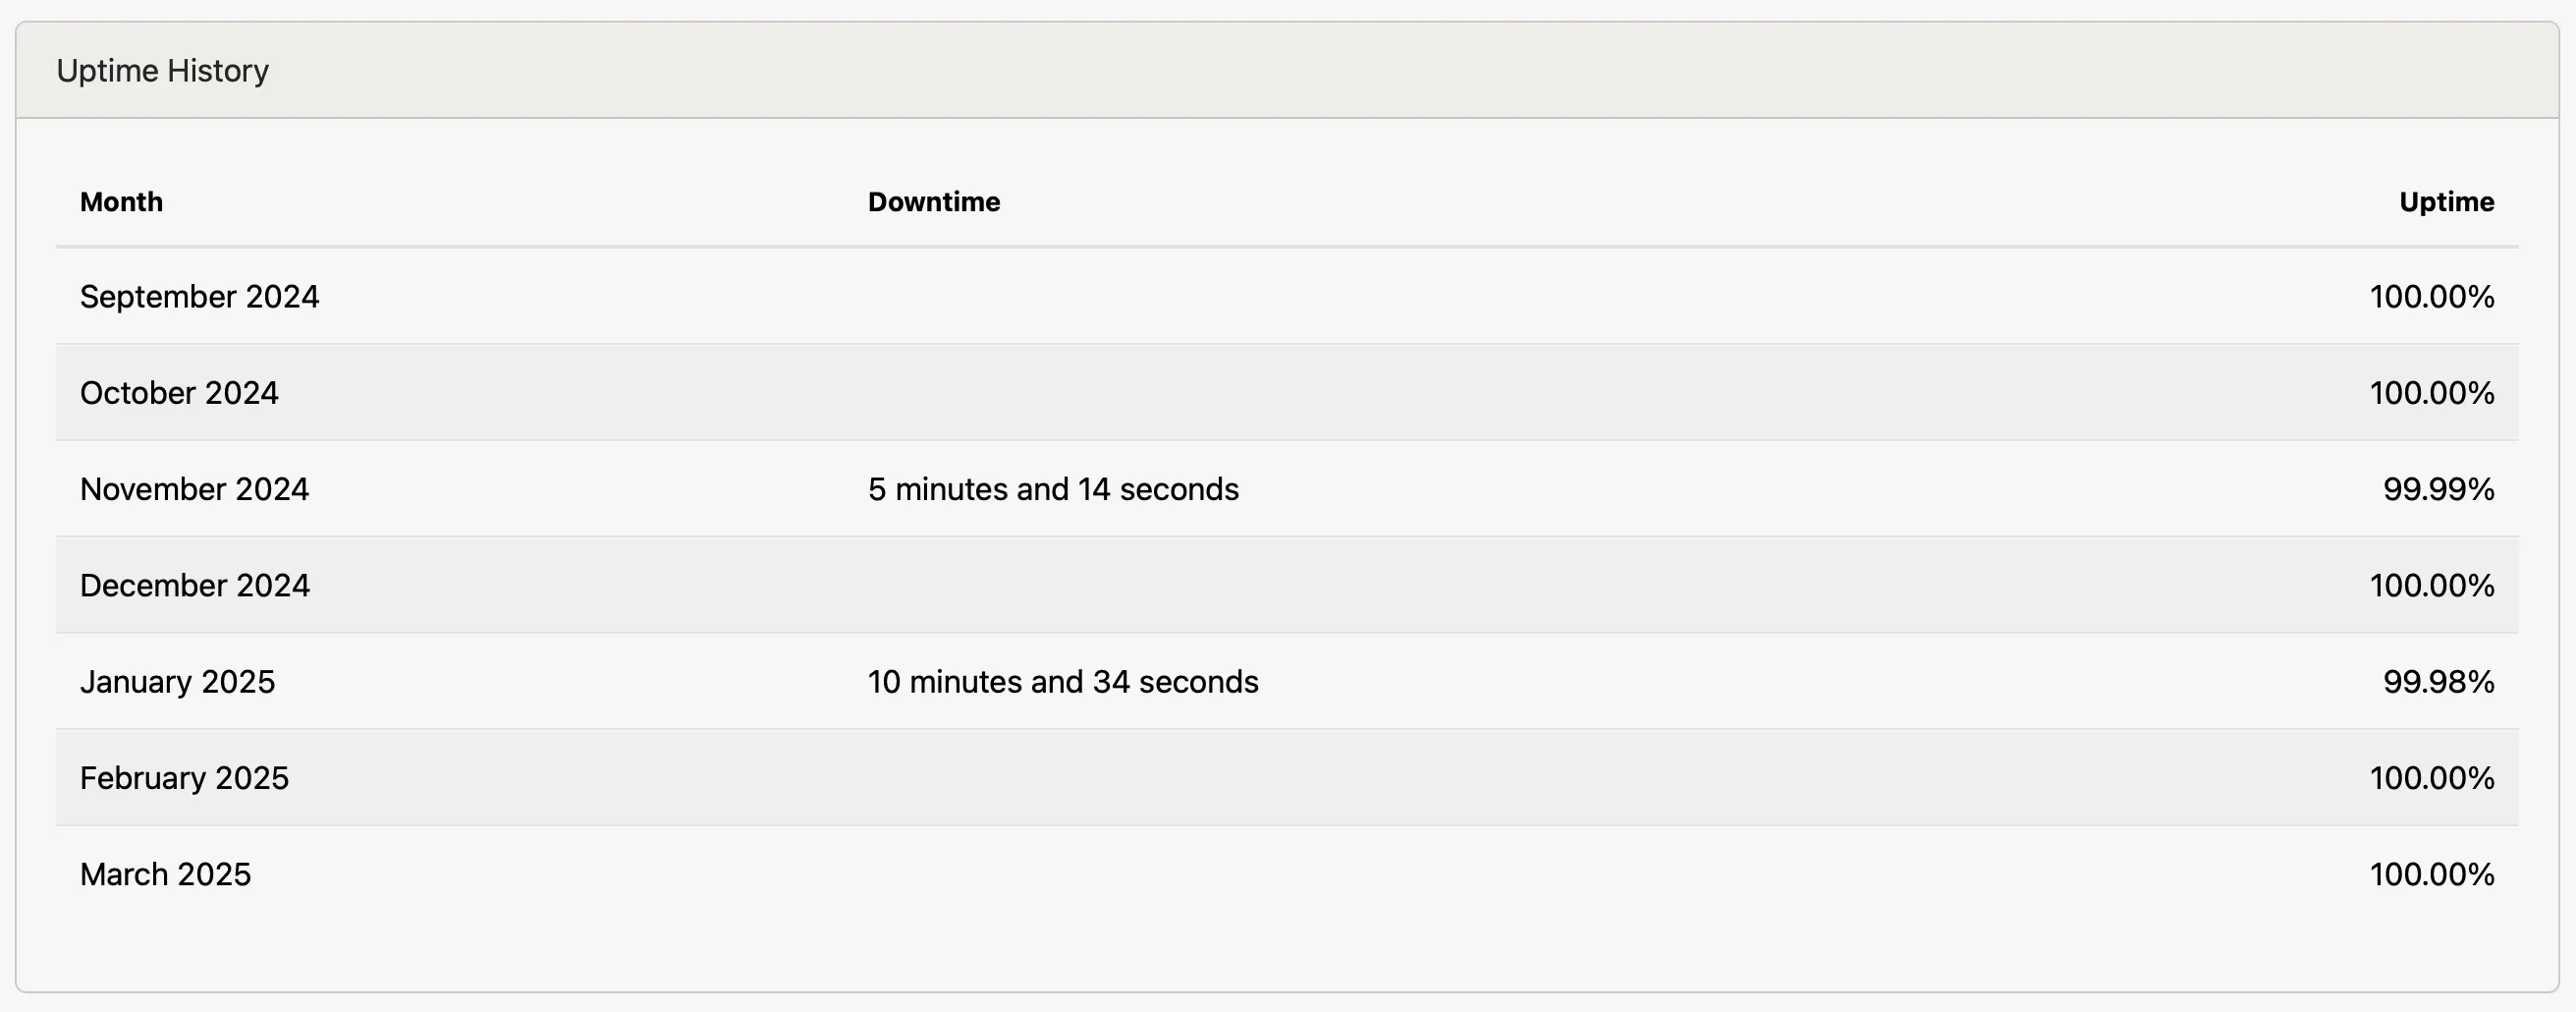 Finally, the most recent checks will be displayed, and below that, a list of the uptime check’s most recent outages. 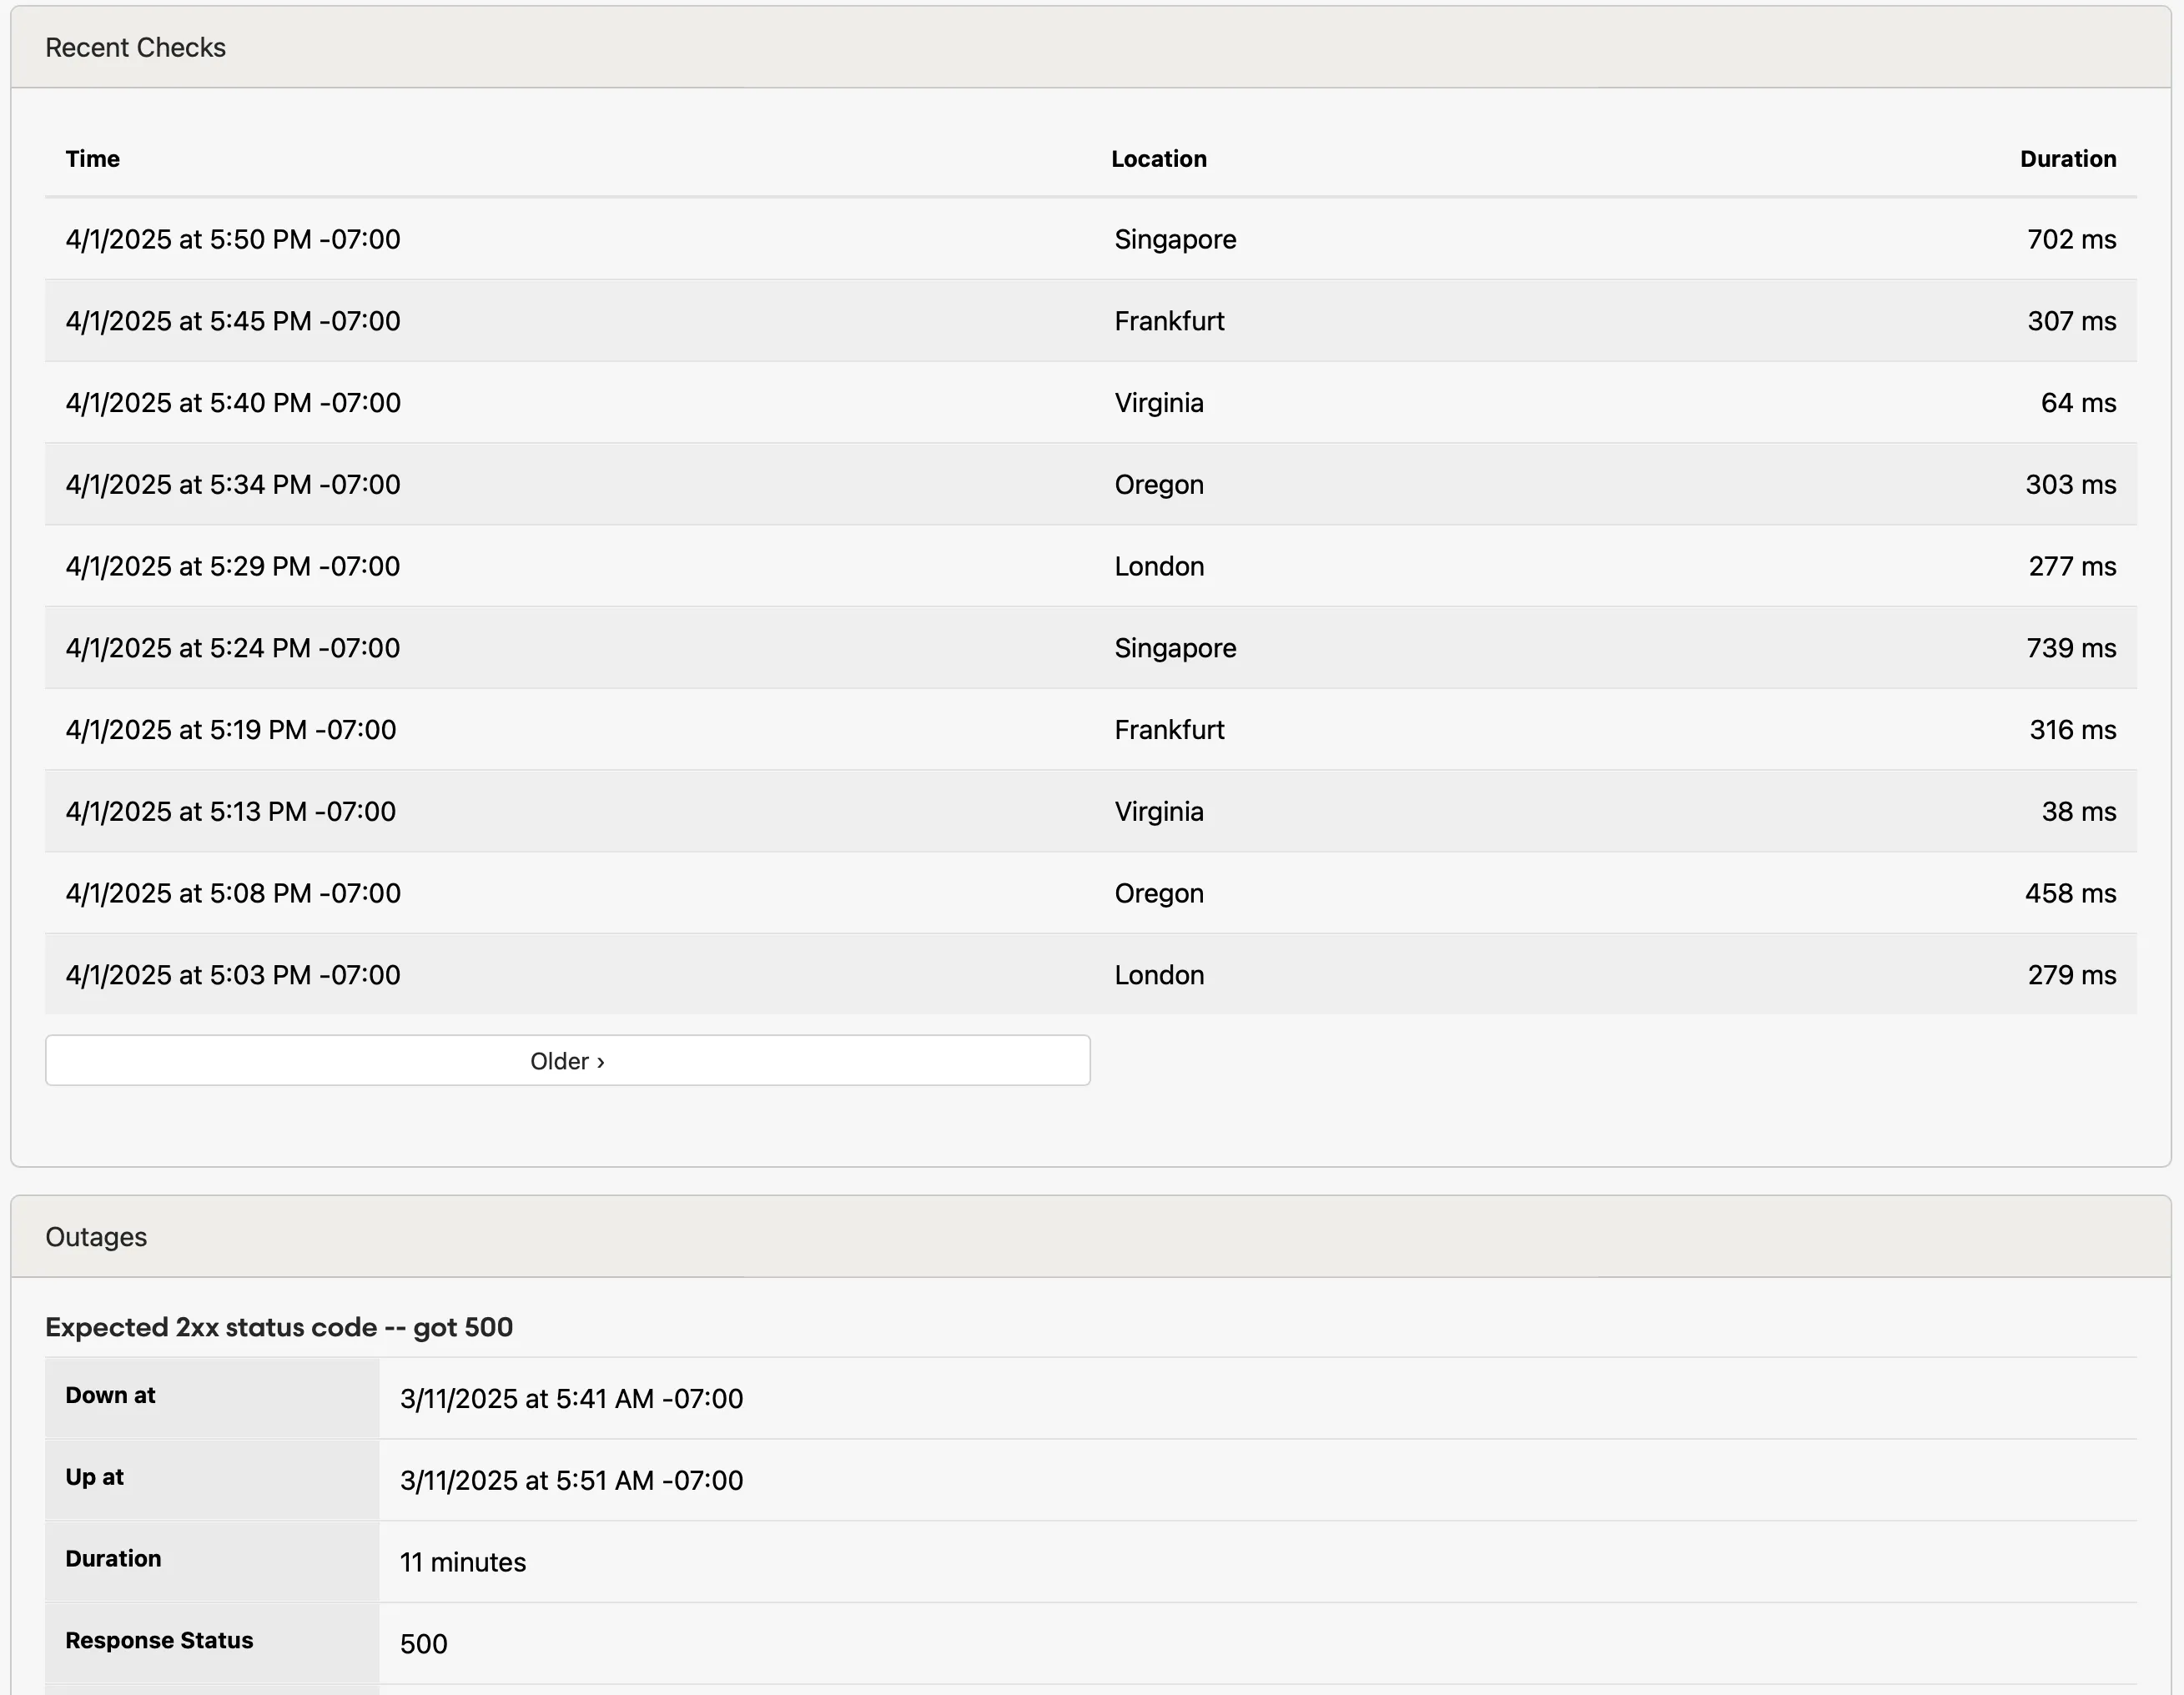 ## SSL certificate warnings [Section titled “SSL certificate warnings”](#ssl-certificate-warnings) We’ll send you a daily warning when your SSL certificates are about to expire. To enable warnings, check the “Check SSL certificate” option when editing your uptime check:  You should also check the “When my SSL certificates are about to expire” event when editing [alerts and integrations](/guides/integrations/): 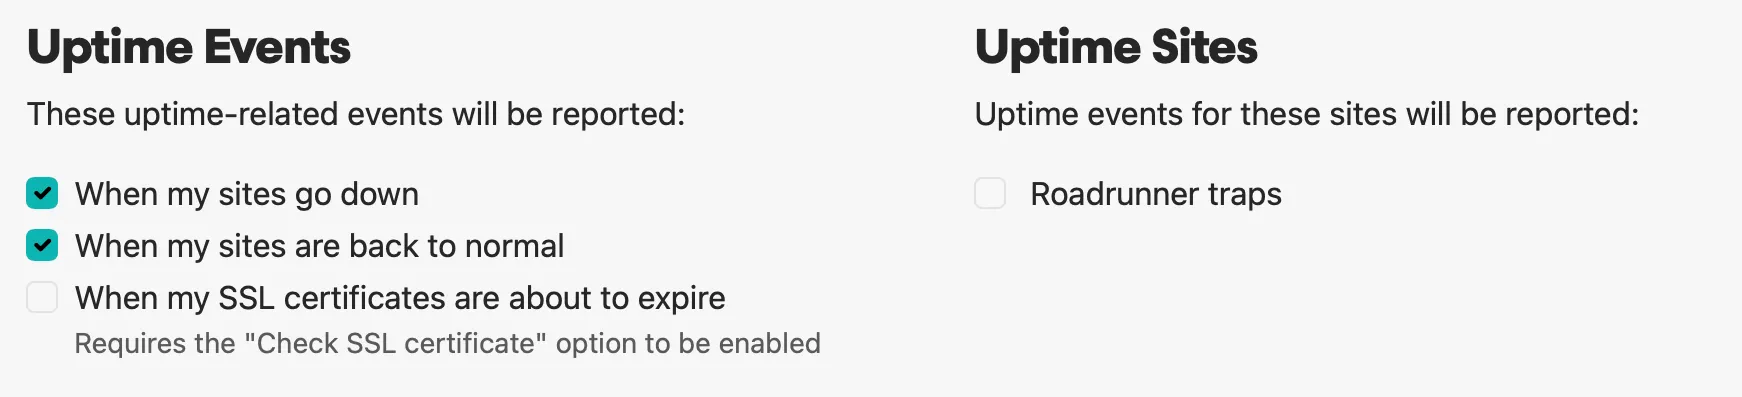 ## Status page integration [Section titled “Status page integration”](#status-page-integration) Check out our [Status pages](/guides/status-pages/#uptime-checks) feature for presenting your uptime checks to your users.
# User management
> User membership for projects, teams, and accounts.
Honeybadger is much more fun when you bring some friends to the party. The easiest way to do so is to assign projects to a team, then [invite users to join your team](#how-to-invite-a-team-user). ## What can users do? [Section titled “What can users do?”](#what-can-users-do) Our paid plans let you invite your co-workers to collaborate on your projects. The table below gives examples of what different kinds of users can do. | | Account Owner | Admin | Member | | --------------------------------------------------------- | :-----------: | :---: | :----: | | Work with errors, uptime, check-ins, etc. | ✅ | ✅ | ✅ | | Configure personal alerts, like email | ✅ | ✅ | ✅ | | Configure chat, issue tracker and repository integrations | ✅ | ✅ | | | Invite and manage users | ✅ | ✅ | | | Assign projects to teams | ✅ | ✅ | | | Manage account billing | ✅ | ✅ | | | Transfer projects to another account | ✅ | | | | Cancel subscription and delete account | ✅ | | | ## Inviting users [Section titled “Inviting users”](#inviting-users) You have three options when inviting users. You can invite them… * **To a project:** Inviting a user directly to your project is the easiest route, as long as you only have one or two projects. * **To a team, which has been assigned the project:** This is the best route if you have more than a handful of users and projects. * **To an account:** Users are automatically added to an account when added to a project or team, but adding users to an account is the way to go when you want those users to have the Owner role. ### How to invite a project user [Section titled “How to invite a project user”](#how-to-invite-a-project-user) To invite a project user, go to the “Settings” tab when viewing a project and click on “Users” in the sidebar. Use the form to enter their email address and choose their permissions for the project. Your invitee will get an email with instructions on how to proceed. 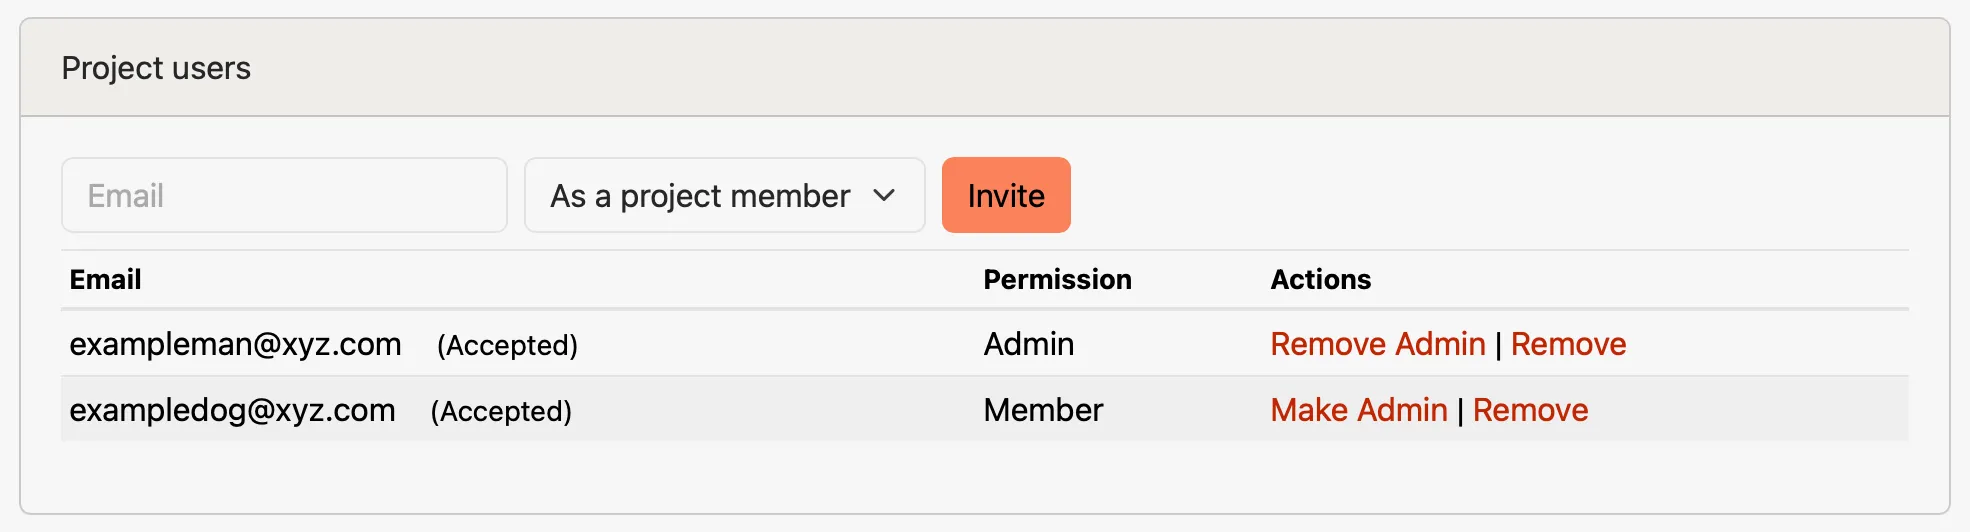 ### How to invite a team user [Section titled “How to invite a team user”](#how-to-invite-a-team-user) View the Users tab on the team detail page to invite a team user. You’ll see a form where you can enter their email address and choose their permissions for the team.  If you’re not sure which team is associated with a project, you can see the list of teams that are connected to a project on the Users tab of the Project Settings page.  ### How to invite an account user [Section titled “How to invite an account user”](#how-to-invite-an-account-user) Go to the Users tab of the [account settings](/guides/accounts/#account-settings) page to add a new user to your account: 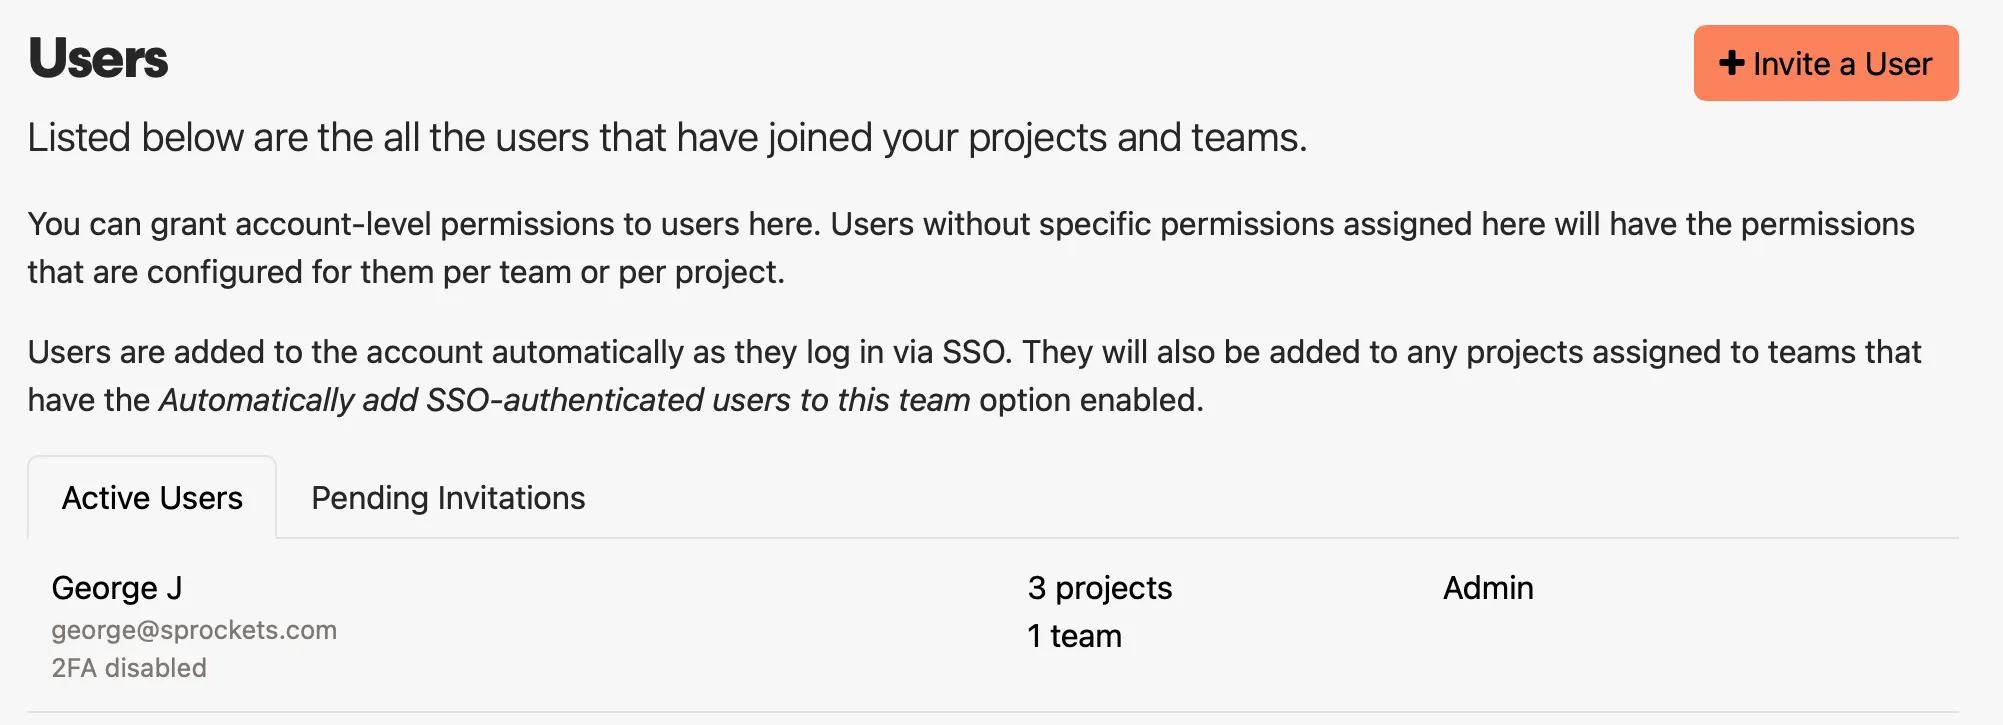 When adding a user, you can choose which role the user should have (Owner, Admin, or Member), and which teams that user will be able to access. As with project and team invitations, users will receive an email with a link to join the account. ## SAML SSO [Section titled “SAML SSO”](#saml-sso) You can optionally provide single-sign on (SSO) to your team members via one of our supported SSO providers: Google Apps for Work, Okta, or OneLogin. Provider-specific configuration instructions are found on the Authentication tab in [account settings](/guides/accounts/#account-settings). Generally speaking, the configuration process goes like this: 1. Create a custom SAML app in your provider’s admin dashboard. 2. Download the IdP metadata from your provider and add it to your Honeybadger SAML configuration. 3. Configure the custom SAML app with the information provided on the SAML configuration page in the app. After those steps are completed, your team members can log in through your SSO provider’s dashboard, or they can enter the SSO name provided in the SAML configuration when signing in to Honeybadger. ### Role mapping [Section titled “Role mapping”](#role-mapping) You can assign account roles automatically based on a SAML assertion attribute, such as a Google Workspace group. In the **Role Mapping** section of your SAML configuration, enter the name of the attribute that carries group membership (e.g., `groups`), then add rules that map attribute values to account roles. On each SAML login, we compare the values of the configured attribute against your rules and apply the highest-privilege matching role (Owner over Admin over Member). A few things to keep in mind: * Values are matched exactly (case-insensitive) — a rule’s value must equal what your identity provider sends. To help you write rules, the SAML configuration page displays the attribute names and values from the most recent sign-in. * Users who match no rule keep their current role — removing a user from all mapped groups does not demote them. * Role mapping will never demote the account’s only remaining Owner, and only account Owners can add or change rules that grant the Owner role. ### Team mapping [Section titled “Team mapping”](#team-mapping) You can also manage team memberships and permissions from your identity provider. In the **Team Mapping** section of your SAML configuration (shown when your account has at least one team), add rules that assign an attribute value — a group, for example — to a team and a permission level (Member or Admin). Team mapping rules use the attribute name configured in the **Role Mapping** section, so be sure to set that first. On each SAML login, the user’s SAML-managed team memberships are synced from their groups: * When an attribute value matches a rule, the user is added to the mapped team with the mapped permission. * When the user’s groups (or your rules) change, their team permission is updated in place — their per-project notification settings are preserved. * When the user no longer has a group that maps to a team, they are removed from that team. * If multiple rules match the same team with different permissions, Admin wins over Member. Team mapping only manages memberships that it created. Memberships created by a manual invitation or by the **Team Access** option (which automatically adds all SSO users to the selected teams) are never modified or removed by team mapping. If a user already belongs to a team via one of those, a team-mapping rule won’t change their permission. When a team has both a mapping rule and **Team Access** enabled, a user who loses their mapped group stays on the team as a regular Team Access member instead of being removed. ## Restricted authentication [Section titled “Restricted authentication”](#restricted-authentication) We provide more control over your users’ login sources when enabling “Restricted Authentication” for your account. You can manage restricted authentication from the Authentication tab in [account settings](/guides/accounts/#account-settings). A common use case is to require users to use SSO instead of being able to log in with a password. #### Auth sources [Section titled “Auth sources”](#auth-sources)  You can select which authentication sources are allowed to access your account. If you require only SAML login, you can disable all other available sources. When a user accesses your account via password, we will redirect them to your custom sign-in page with a link to your SAML provider. #### Session duration [Section titled “Session duration”](#session-duration) You also have control of your users’ session duration, per auth source. For example, daily reauthentication with your SAML provider can be achieved by updating the “Session expire duration” for your SAML auth source. #### Custom sign-in page [Section titled “Custom sign-in page”](#custom-sign-in-page) Restricted auth accounts have access to a custom sign-in page. We will only show your active auth sources as sign-in options.  ## Multi-factor authentication [Section titled “Multi-factor authentication”](#multi-factor-authentication) Honeybadger supports multi-factor authentication (also known as two-factor authentication, 2FA, or MFA) via Google Authenticator, Authy, and similar 2FA providers. Account owners can require multi-factor authentication for all users from the Authentication tab in [account settings](/guides/accounts/#account-settings).  When enabled, we’ll notify the users who need to set it up via email, and prompt them to enable it on their next login.
# User settings
> Your personal preferences.
User accounts in Honeybadger are very similar to those in GitHub. Each user is his or her own person. While project admins can configure project-level integrations like Slack, each individual user has complete control over their personal alerts and other user settings on the [User Settings](https://app.honeybadger.io/users/edit) page. Here are some examples of “personal settings”: * Name and connected email * Localized date and time preferences * Connection to GitHub and other 3rd-party accounts * Daily and weekly digest email settings for all projects * Local editor selection for links displayed on backtraces The user settings page is also where you can: * Add or remove connections for mobile devices * Leave projects where you are not the sole owner * Set up local editors for your projects * Cancel the user account ## Configuring personal alerts [Section titled “Configuring personal alerts”](#configuring-personal-alerts) Alerts sent via email, SMS and our mobile apps are considered “personal” integrations. You and only you control which personal integrations are enabled and which events they receive. As you log in to the mobile apps on new devices, they are added to the personal integrations list for all the projects you can access. You have a separate set of alert preferences for each project you work with. One way to edit them is by going to each project’s settings page and clicking on the “Alerts” tab. There’s a section for “Personal Alerts.” 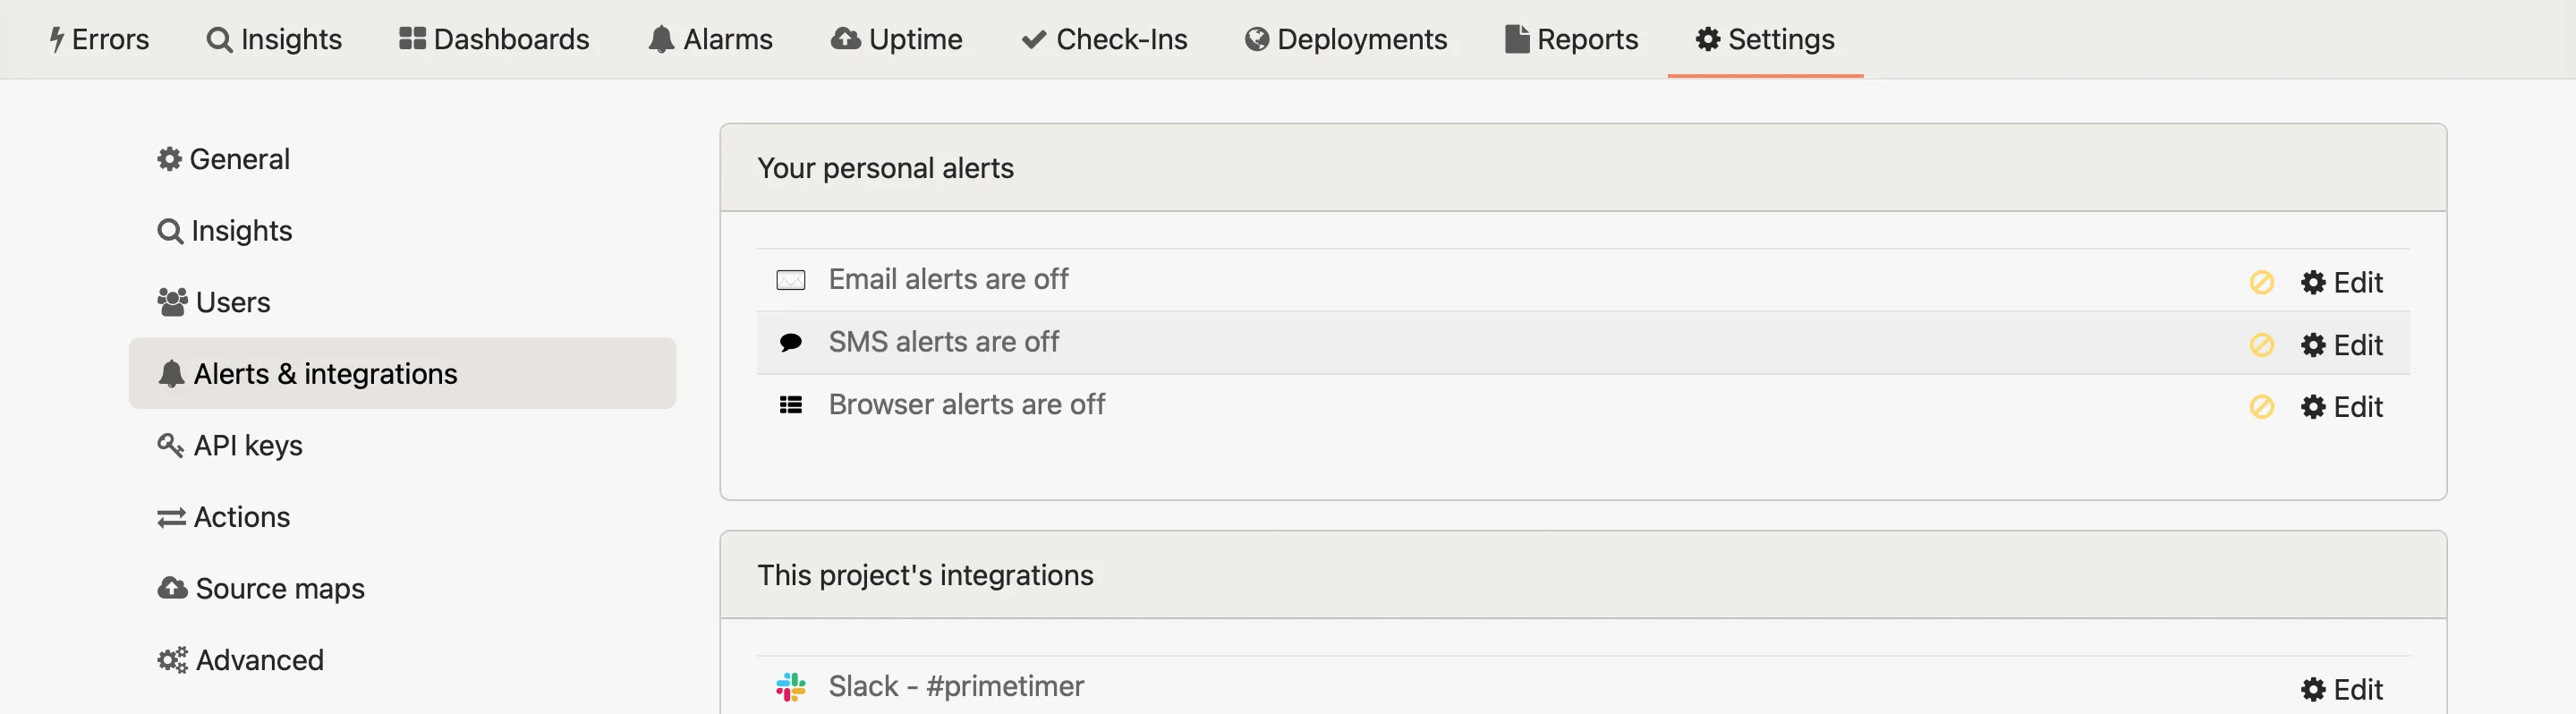 While the account owner can see what notifications other users in the accounts have enabled, they cannot customize them. ### Mobile device connections [Section titled “Mobile device connections”](#mobile-device-connections) From the User Settings page, you can customize your connected mobile devices via the “Mobile Devices” tab on the sidebar. Here you will find links to download the Honeybadger app so you can connect your devices to receive important alerts on the go. ### SMS phone numbers [Section titled “SMS phone numbers”](#sms-phone-numbers) Honeybadger sends SMS alerts from a pool of phone numbers. To ensure that you receive alerts, download our vCard and add it to your contacts on your desktop or smartphone: [Download Honeybadger Outgoing Numbers vCard](/Honeybadger%20Outgoing%20Numbers.vcf) In iOS you can optionally [configure a custom text tone and enable the *Emergency Bypass* option](https://support.apple.com/guide/iphone/allow-or-silence-notifications-for-a-focus-iph21d43af5b/17.0/ios/17.0#iph68077cc0d) for the Honeybadger contact. Android has a [similar option](https://support.google.com/android/thread/219866813?hl=en\&msgid=220251463). This will ensure that you receive alerts even when your phone is in *Do Not Disturb* mode. Our current outgoing numbers (from the [vCard](/Honeybadger%20Outgoing%20Numbers.vcf)) are: * (206) 535-1618 * (206) 203-4914 * (206) 203-6150 * (206) 203-8212 * (206) 203-1222 * (206) 203-5571 Please note that these numbers are subject to change. We recommend checking this page periodically for updates. *Last updated: 2024-03-20* ### Configuring alerts across multiple projects [Section titled “Configuring alerts across multiple projects”](#configuring-alerts-across-multiple-projects) If you work with lots of projects, it can be a hassle to visit each settings page. That’s why we’ve added a single page UI where you can enable/disable all personal notifications in one place. This is available on the [Notifications tab](https://app.honeybadger.io/users/edit#notifications) of the [User Settings](https://app.honeybadger.io/users/edit) page. To access the detailed project notification options, click the project links displayed on this page to customize what kind of alerts you can receive. ## Connected apps [Section titled “Connected apps”](#connected-apps) The Connected Apps tab allows you to configure personal connections to Slack and project management tools such as GitHub. These connections enable Honeybadger to create and manage issues as your user account on the platforms you connect. ### GitHub sign in [Section titled “GitHub sign in”](#github-sign-in)  To be able to sign in with GitHub, you’ll need to connect your Honeybadger and GitHub accounts. To do this: 1. Log in to Honeybadger 2. Go to the [User Settings](https://app.honeybadger.io/users/edit) page 3. Click on “Connect your GitHub Account” 4. Tell GitHub to allow Honeybadger to use your account for sign in > Note that this only sets up GitHub login. It doesn’t connect your projects to GitHub. You’ll have to do that in project settings. ## Cancel user [Section titled “Cancel user”](#cancel-user) You are immediately removed from all accounts, teams, and projects when you cancel your user account. Your user info will be deleted, and all accounts for which you are the only owner will also be immediately deleted. This action cannot be undone.