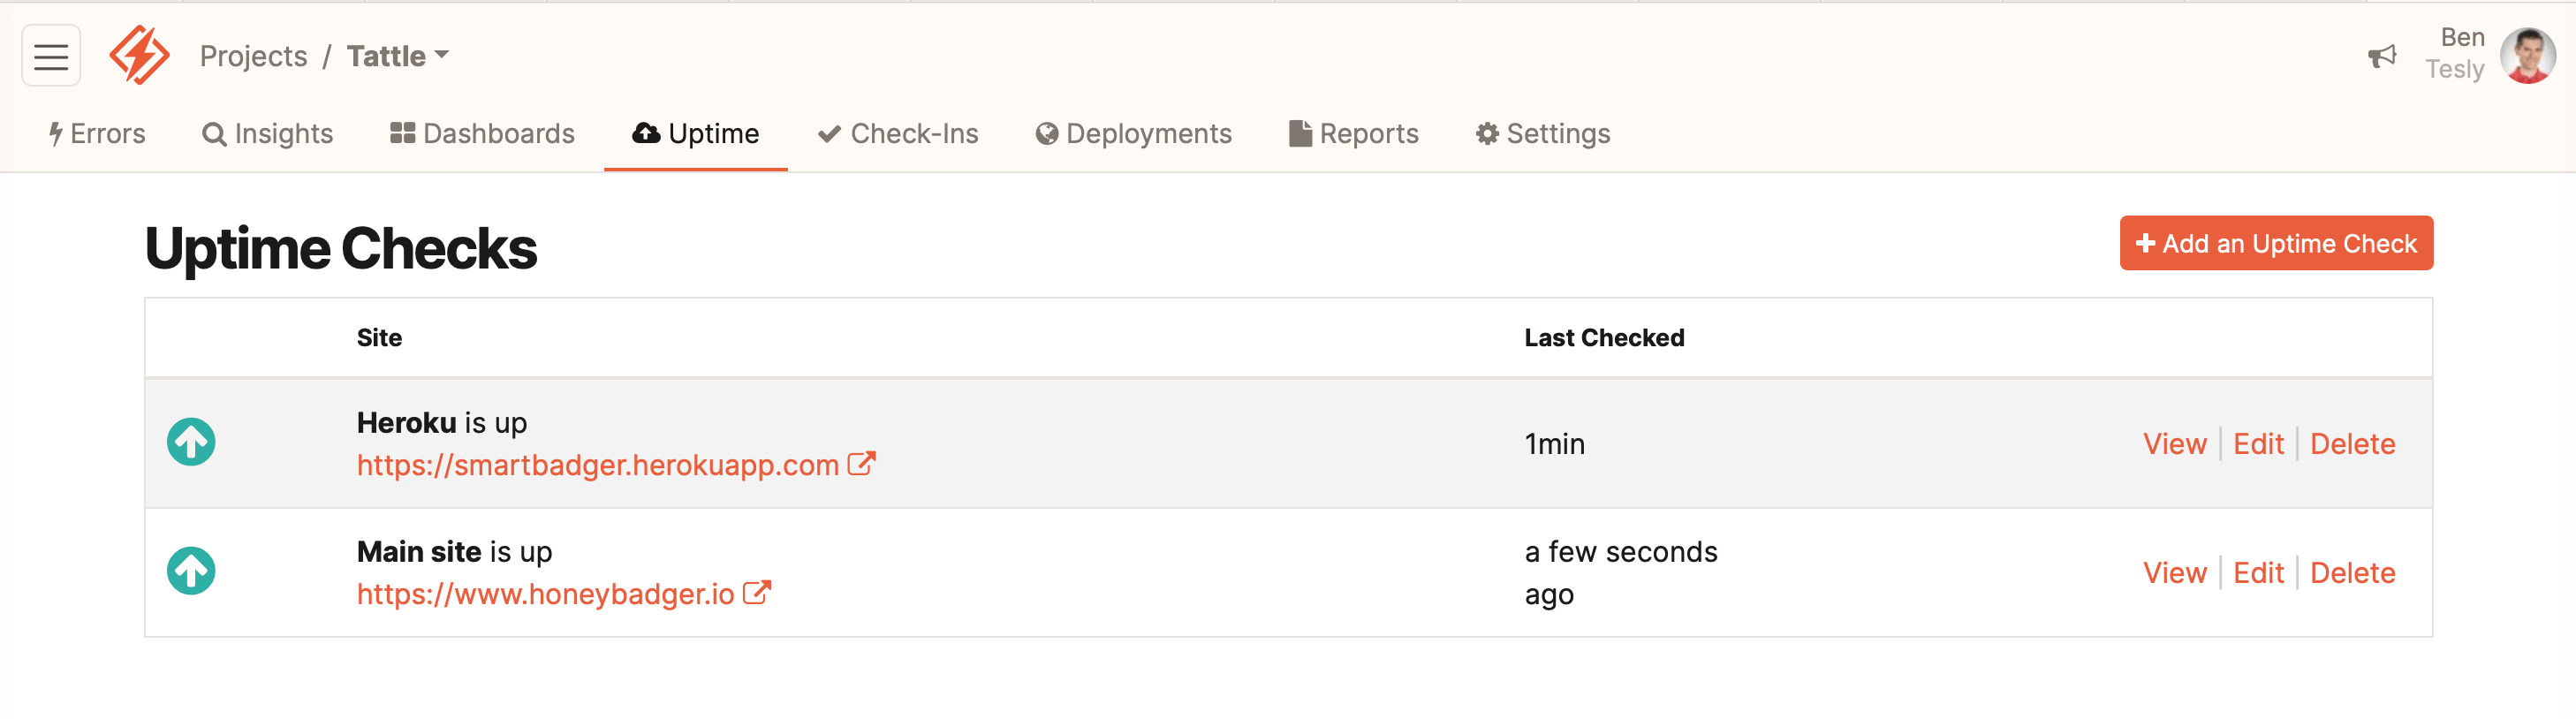
Uptime Monitoring
Your Honeybadger account comes with uptime monitoring. Our geographically distributed network of friendly robots will ping your site every few minutes. If a check fails, we'll let you know.
You can set up fairly sophisticated checks based on the HTTP status code, or the response body.
Setup
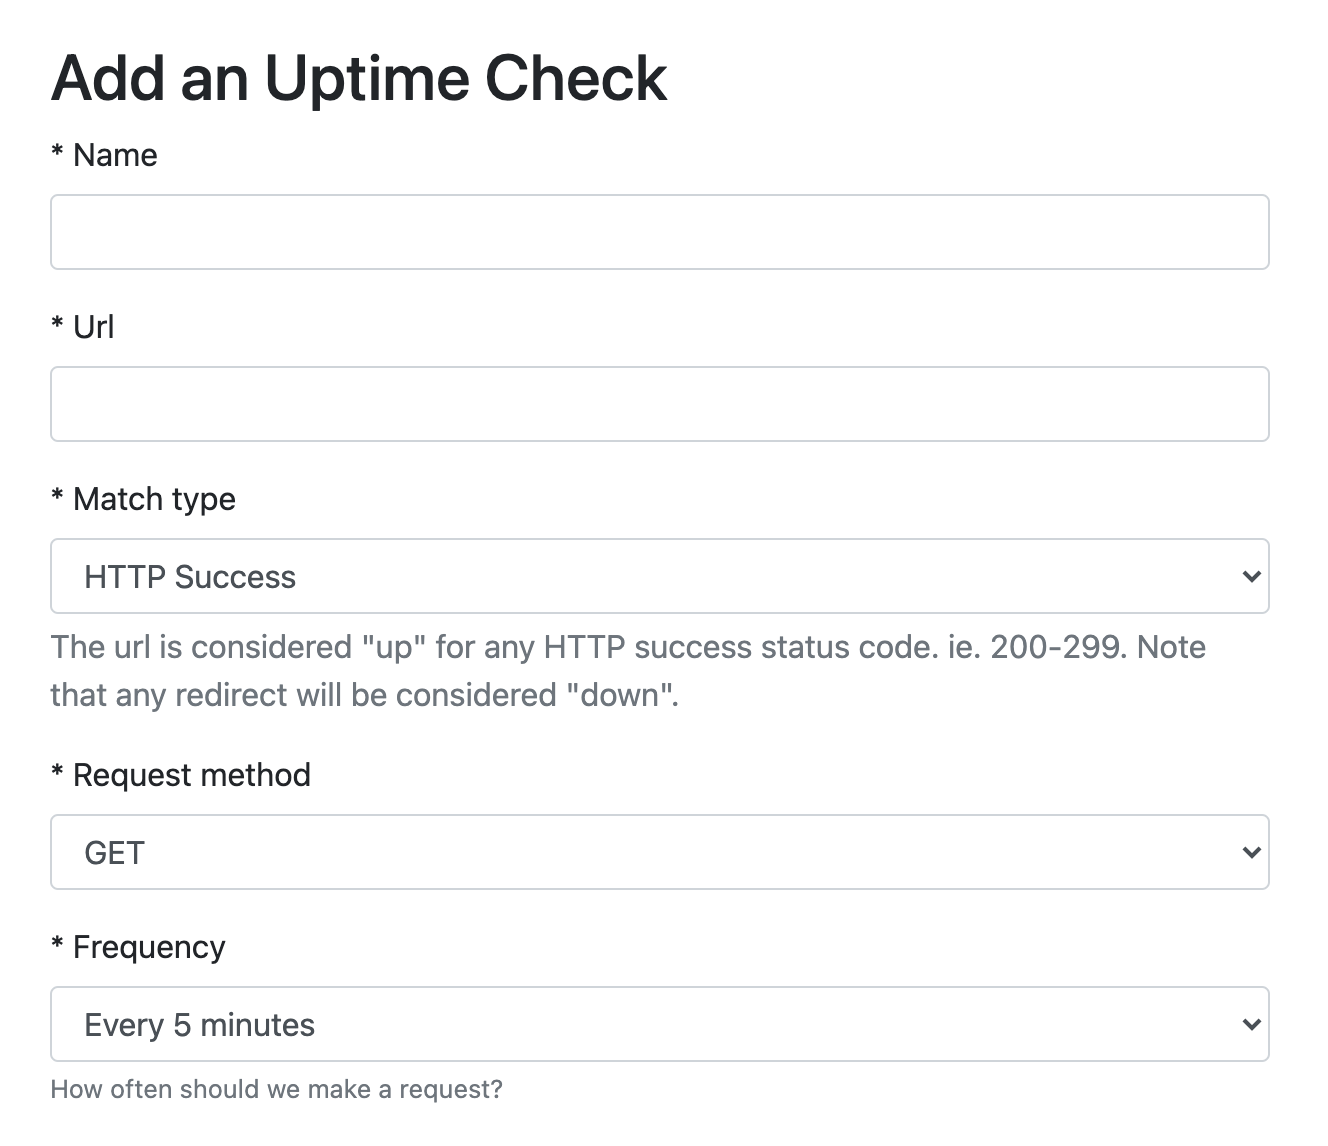
When creating an uptime check, just tell us what URL you want monitored. You can choose what counts as a success response from these options:
- Success - notifies you that your site is down when your server responds with a non-20x status code. When in doubt, this is the one you probably want.
- Exact - prompts you to enter an HTTP status code. If you entered 302 it would ensure that the server responds with a 302 status code.
- Response body includes string - prompts you for a string (i.e. "Error") and notifies you when the response body matches.
- Response body excludes string - prompts you for a string and notifies you if the response body does not match.
-
Response body matches JMESPath expression - allows you to specify a
JMESPath expression that is evaluated against the JSON returned in the response. For example, an expression like
queue.depth < `10`will evaluate to true for a JSON response like{"queue":{"depth":2}}.
You can also choose to send custom request headers or a custom request body, check the validity of the SSL certificate, and select which locations should be used for monitoring.
You can optionally give each of your uptime checks a custom name, which will be the default label for when included on a Status Page.
Hit "save" and you're done!
Outage Notifications
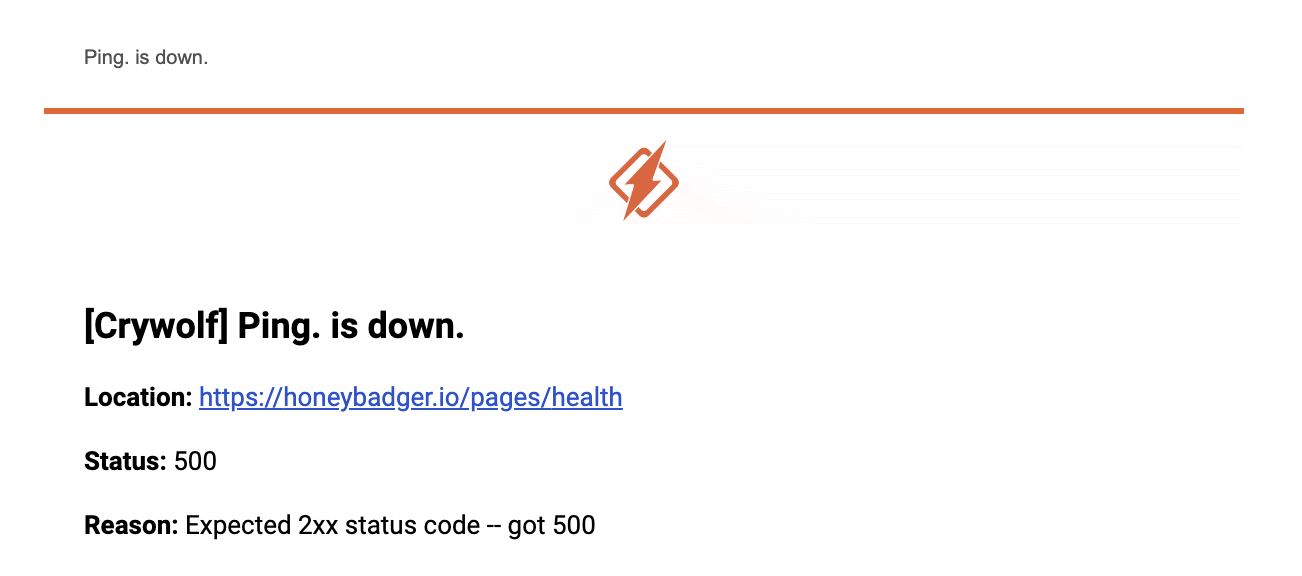
When your site goes down, we'll notify you with all the details about what went wrong, including how your check failed. For example, you will see receive a notification like this one when the uptime check expected a successful status code but returned a 500.
By default, the notification is sent after half of the locations report
a failing check. This means that if you are using five locations, there
would need to be three failures in a row before you would receive an
alert. You can override this default by specifying a value for the
Outage Threshold field.
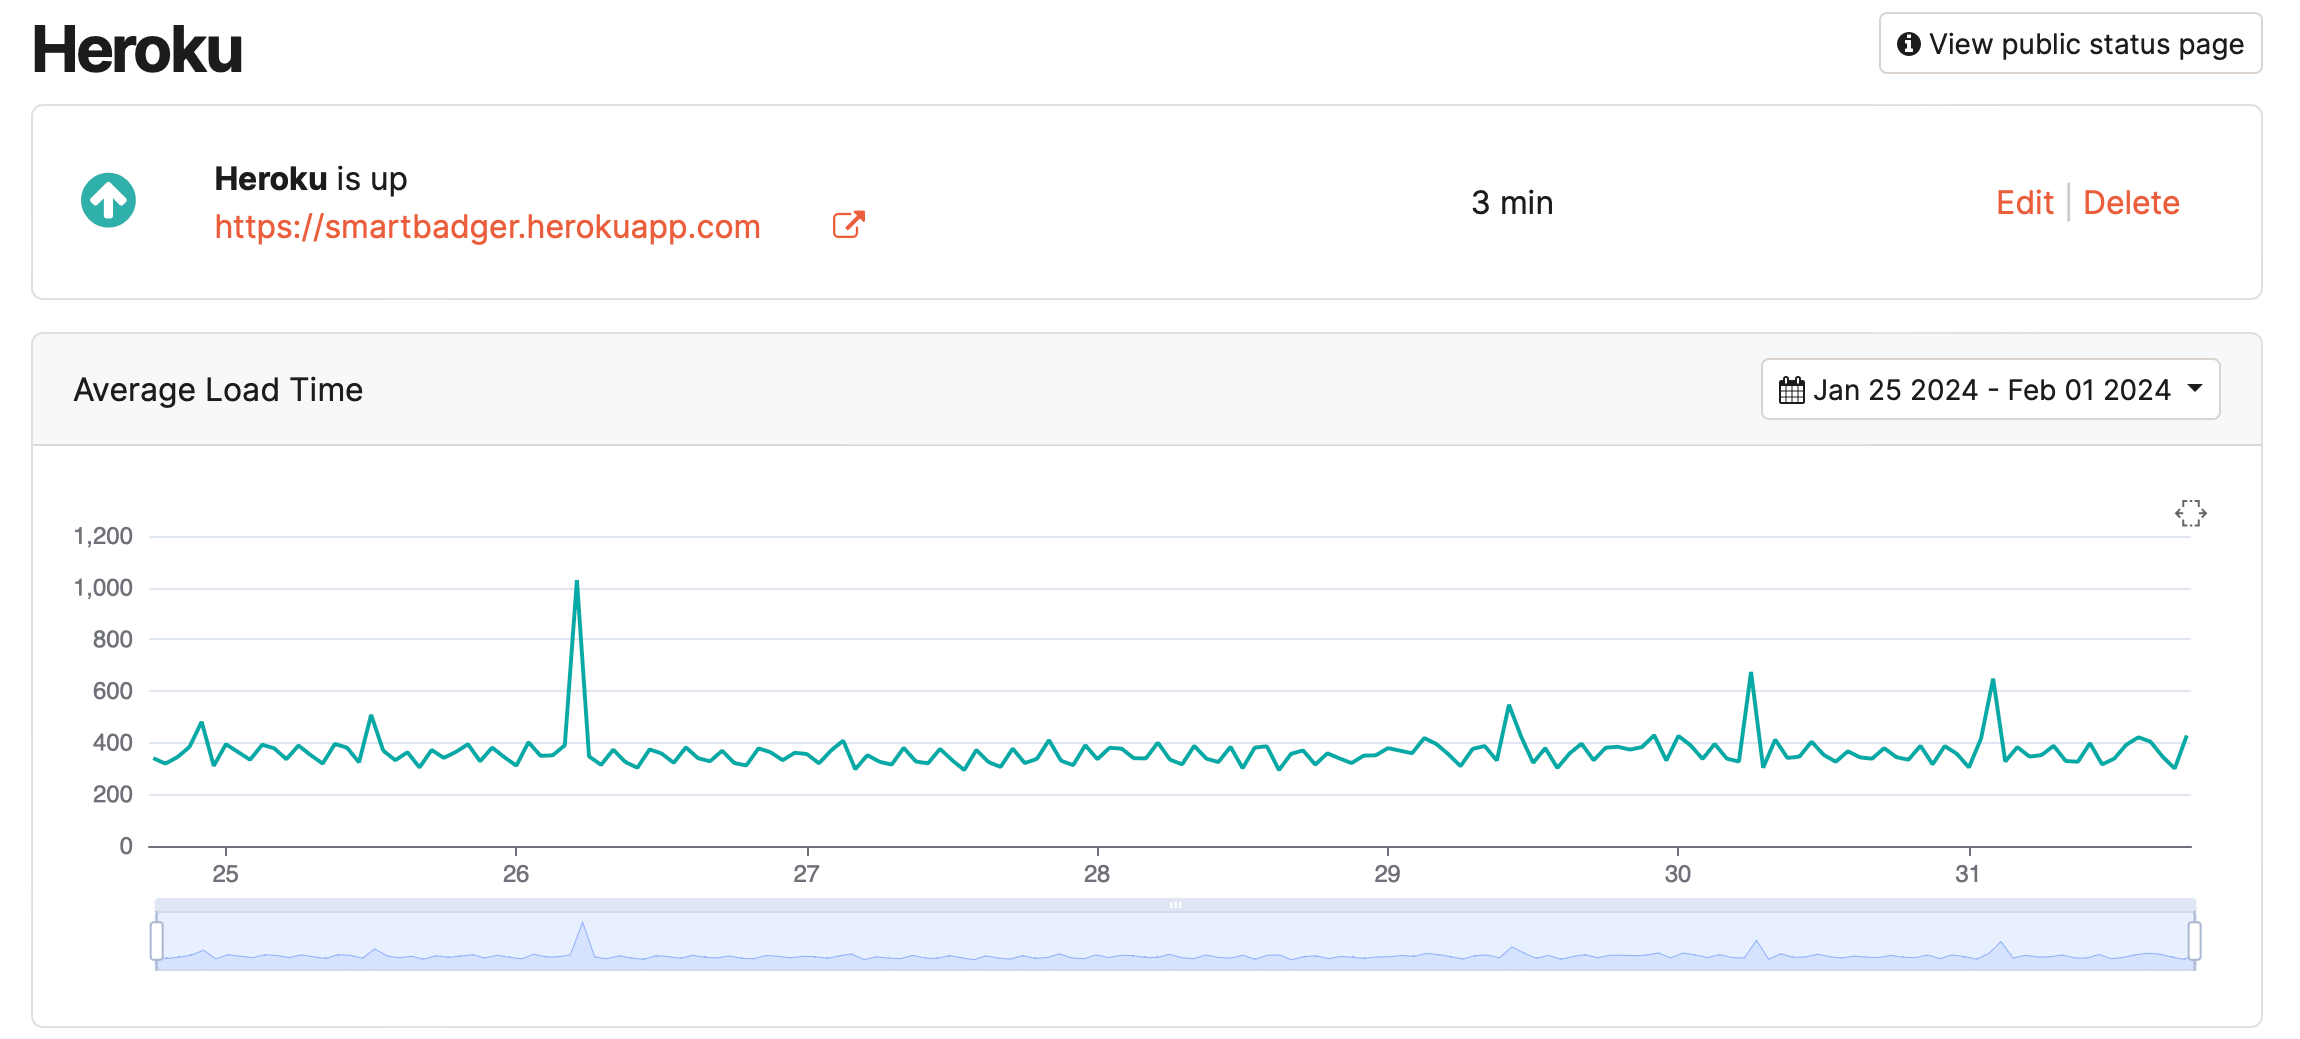
Outage Details
When you get a notification that a check has failed, we'll also link you to a web page with details. This detailed view can be accessed by clicking the "View" link for any particular uptime check in the UI.
At the top, the average load time over the past week will be displayed, as well as the uptime check itself.
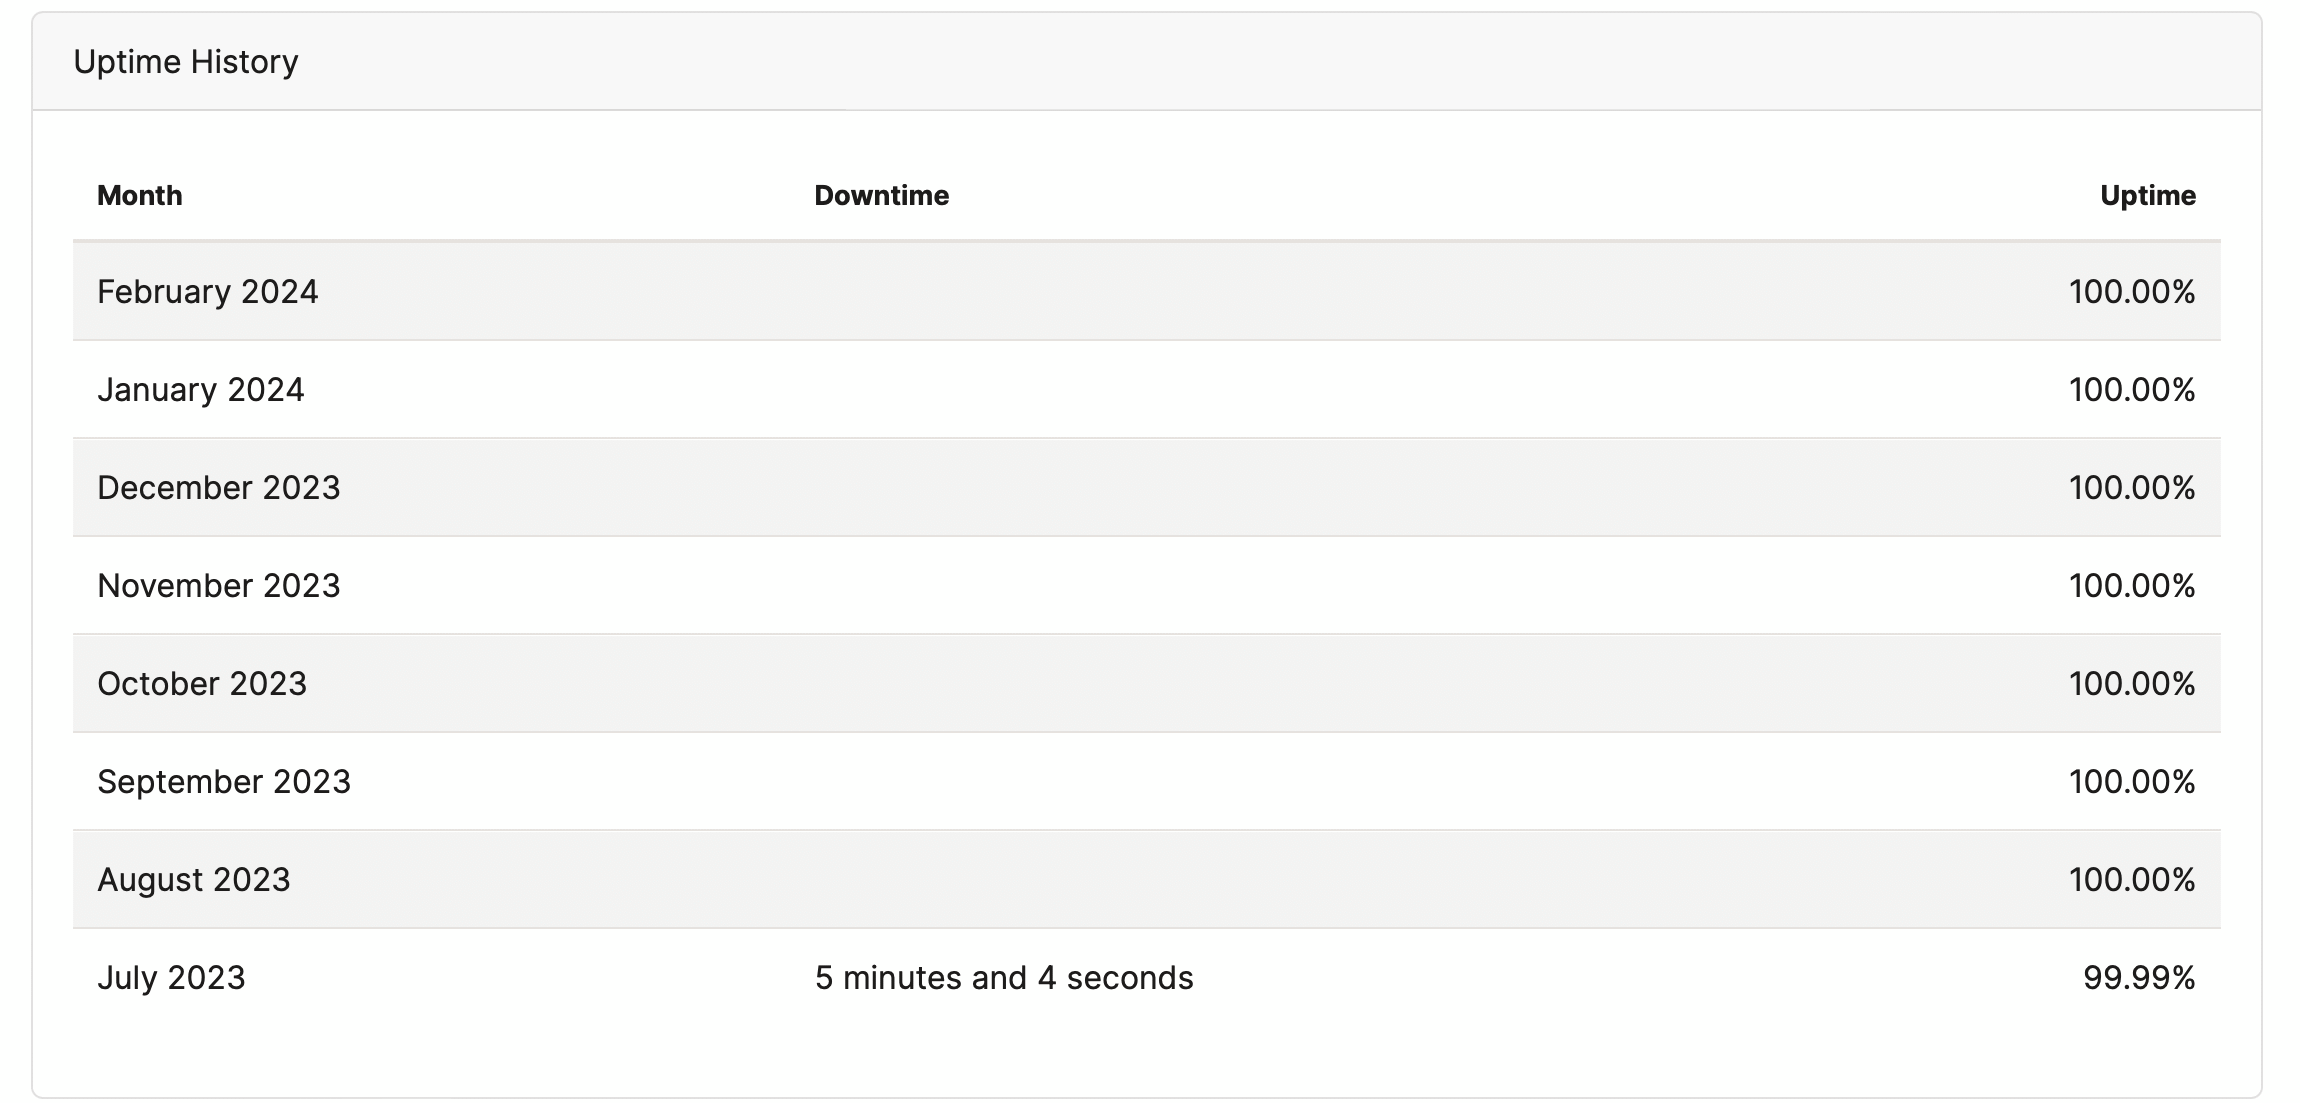
Scrolling down, you can see the uptime on a percentage-monthly basis.
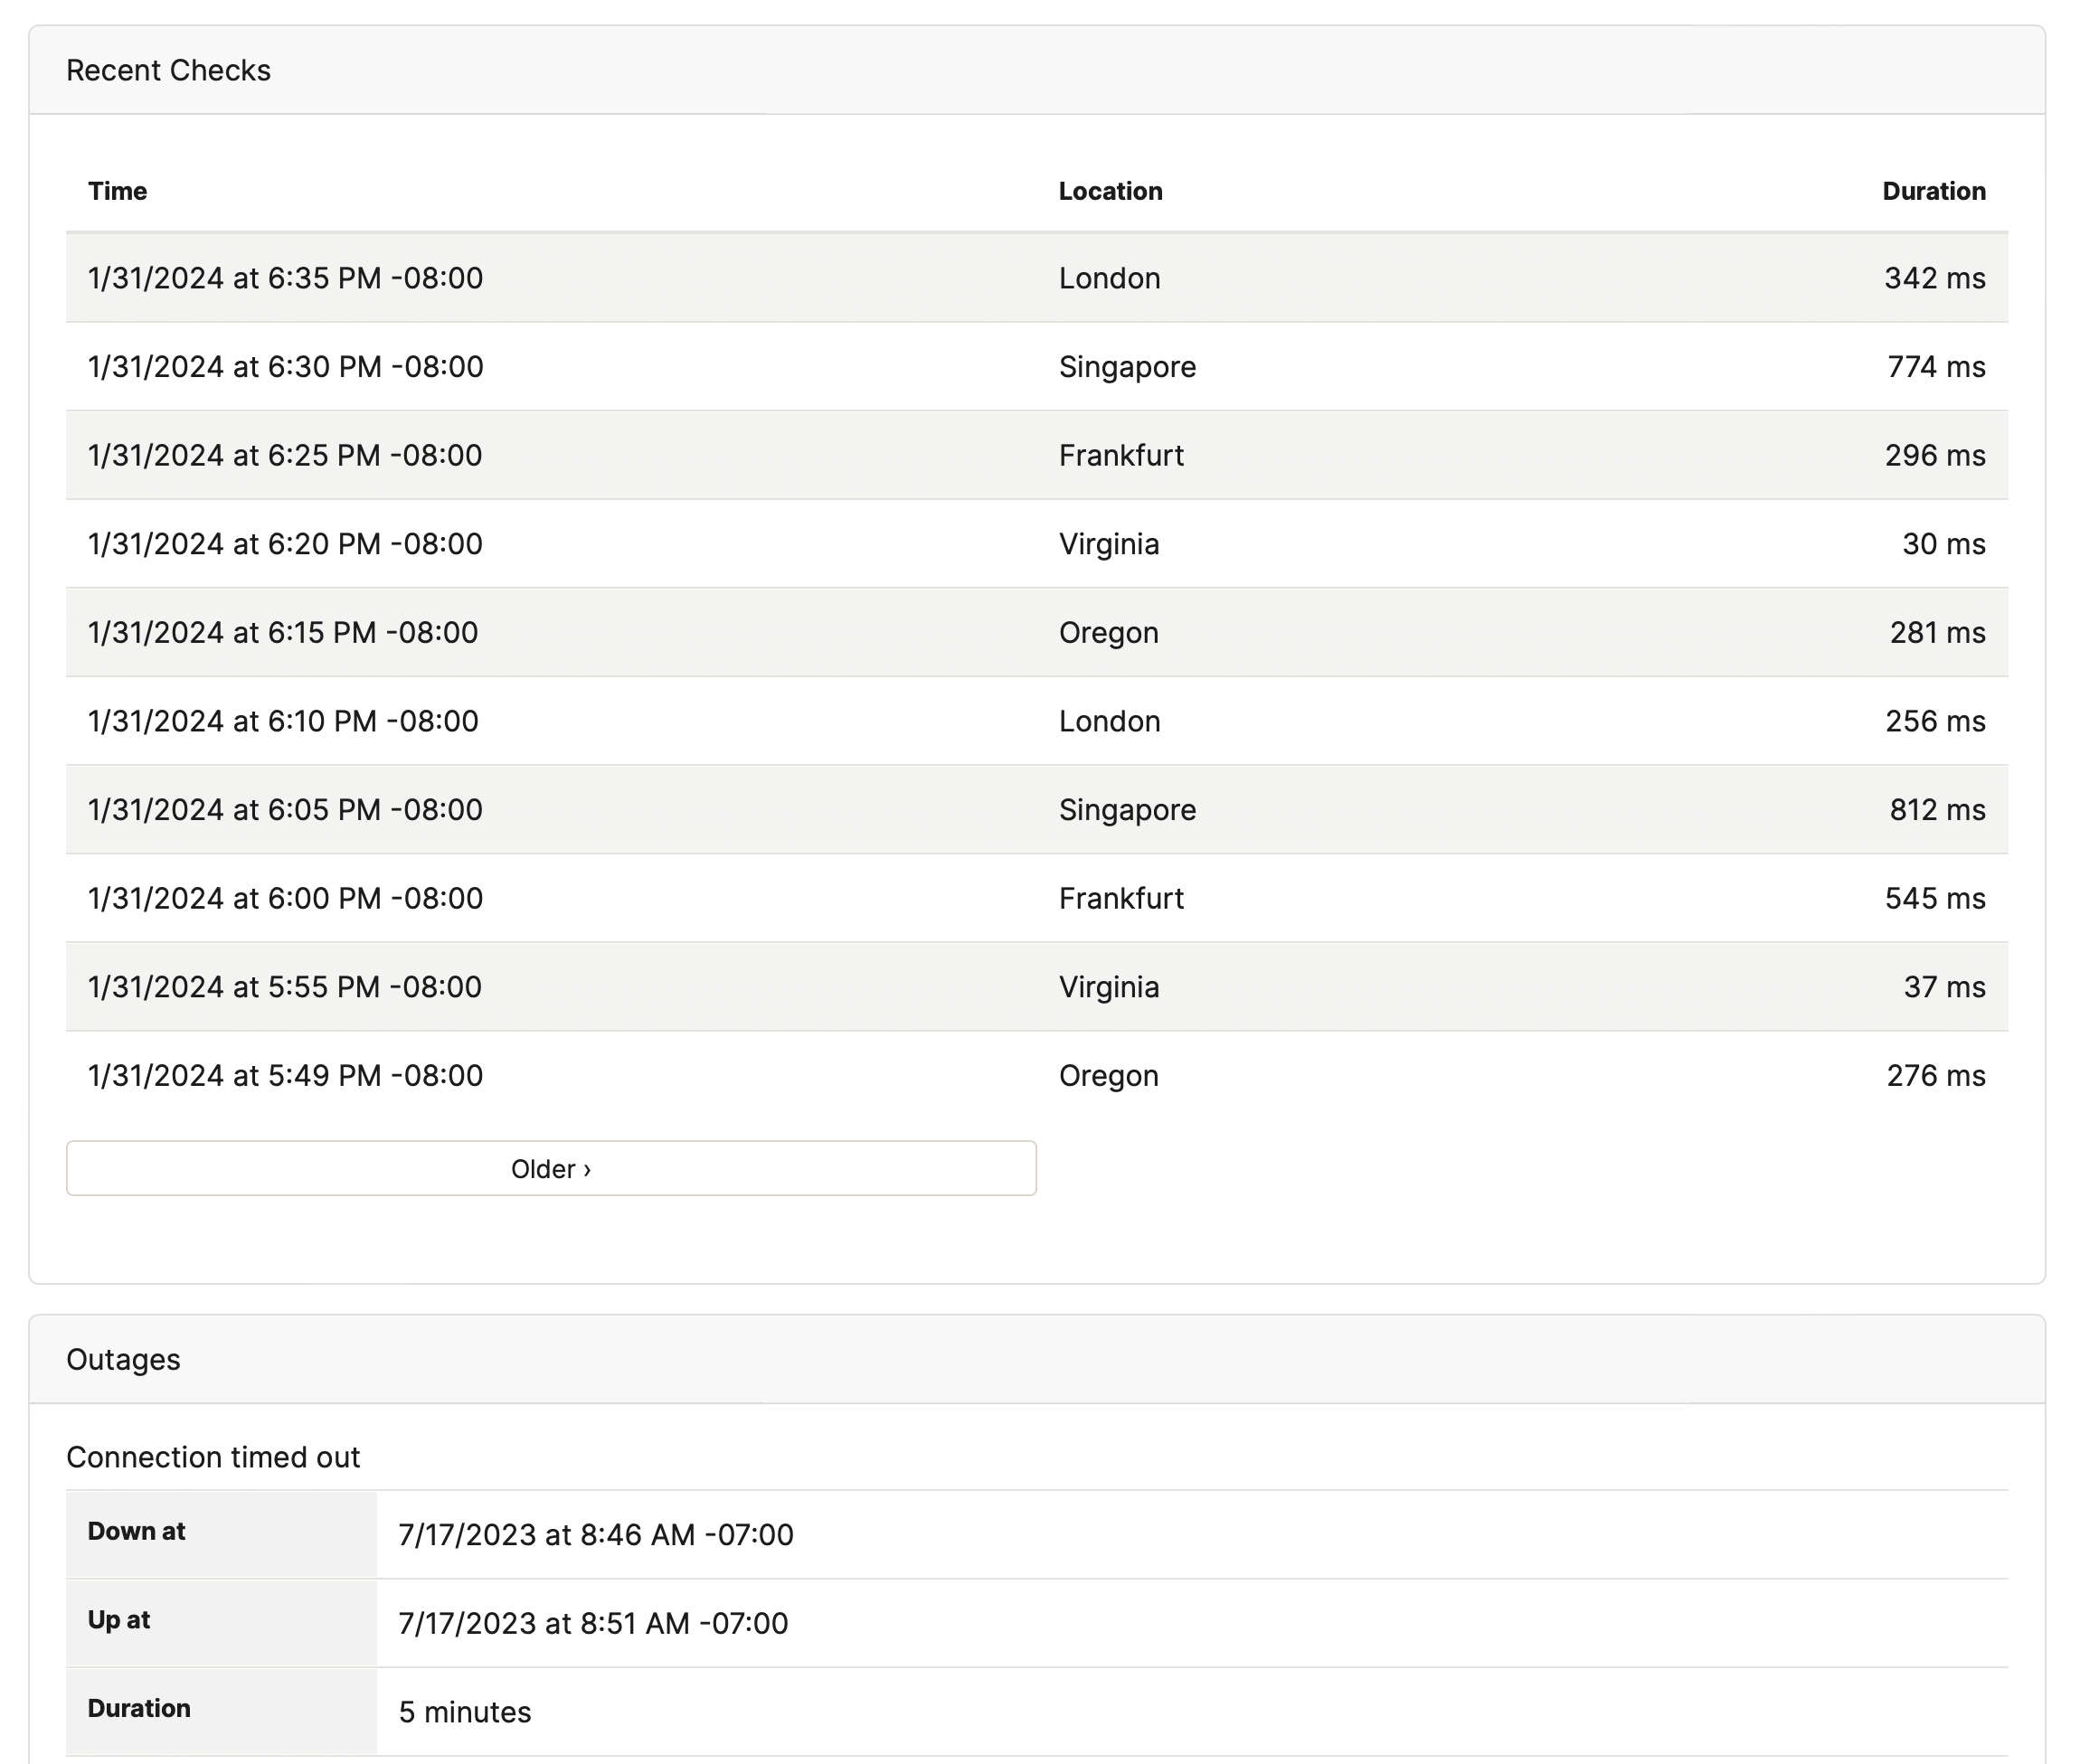
Finally, the most recent checks will be displayed, and below that, a list of the uptime check's most recent outages.
SSL Certificate Warnings
We'll send you a daily warning when your SSL certificates are about to expire. To enable warnings, check the "Check SSL certificate" option when editing your uptime check:

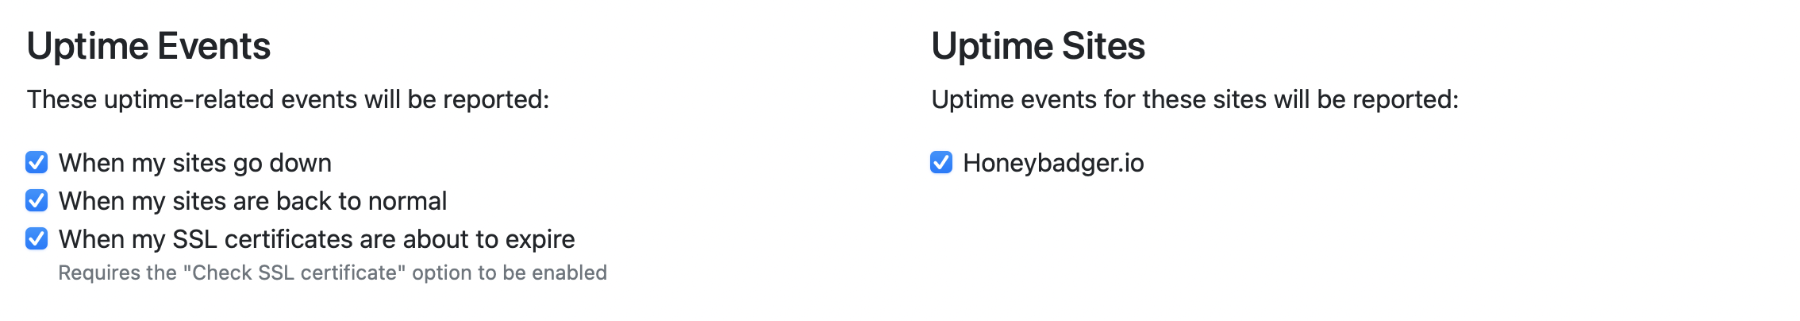
You should also check the "When my SSL certificates are about to expire" event when editing alerts and integrations:
Status page integration
Check out our Status pages feature for presenting your uptime checks to your users.
Please note that enabling bot protection on Cloudflare-hosted websites may prevent uptime checks from working.