Insights & Logging
You can use Honeybadger Insights to dive into the data collected by Honeybadger and the logs and other events that you send to our Events API. We provide a query language (that we lovingly call BadgerQL) that enables quick discovery of what’s happening inside your applications. The Insights UI also lets you chart the results of those queries and add those charts to dashboards that you can share with your team.
Querying and visualization
Section titled “Querying and visualization”Our query language strives to be minimalist, yet powerful. With it you can specify which fields you want to see, filter the kinds of events that should be returned, perform aggregations and calculations, and more. When you first load the Insights UI, you will see a query box that has a default query to help you get started:
fields @ts, @preview| sort @tsThis query selects a couple of special fields — the timestamp and a preview of the fields that are available in the event — and sorts the results by time, with the most recent results first. Each row of the query is piped through the following row, which allows you to apply filters, formatting functions, and so on. Let’s do a quick walk-through to see how it works, and to see how it can be used to create visualizations of your data.
Walk-through
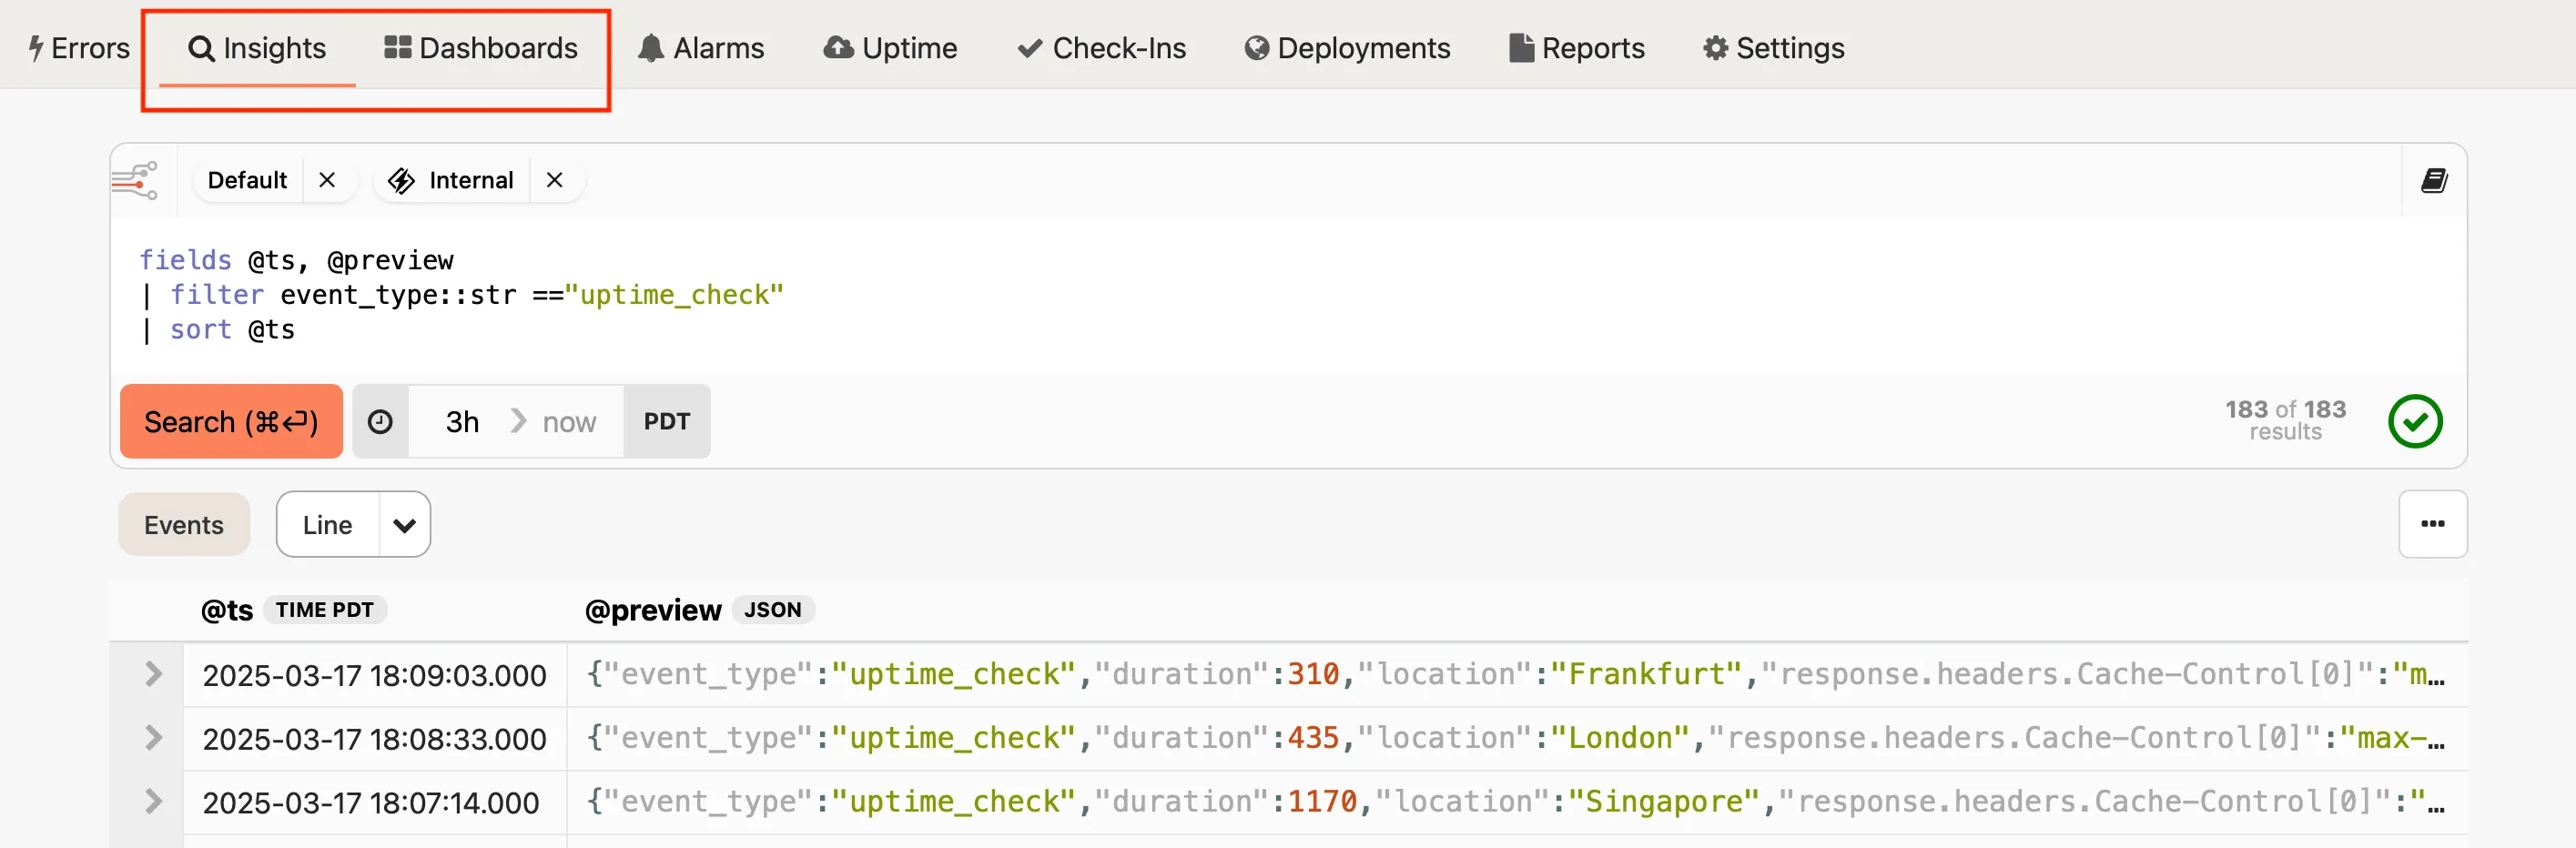
Section titled “Walk-through”Here’s an example of working with some Honeybadger data. First, filter the data to see only the results of uptime checks:
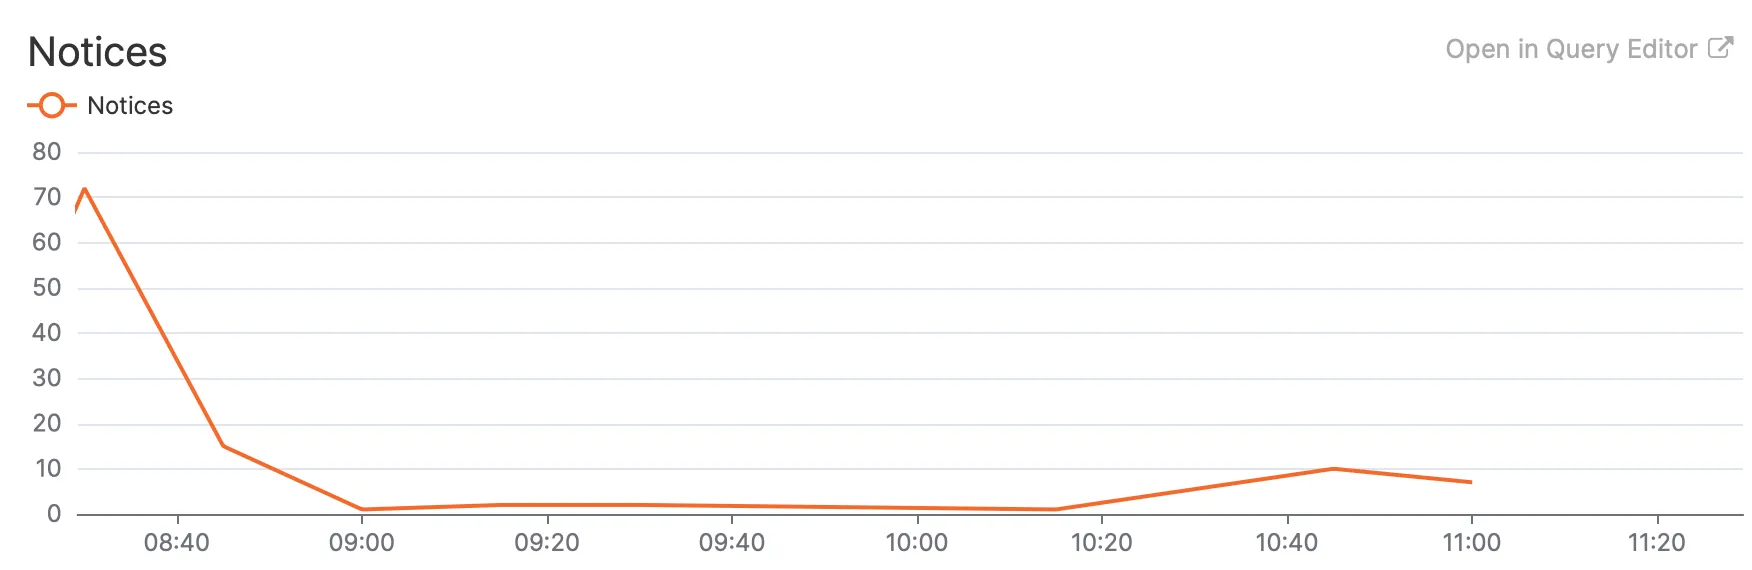
fields @ts, @preview| filter event_type::str == "uptime_check"| sort @ts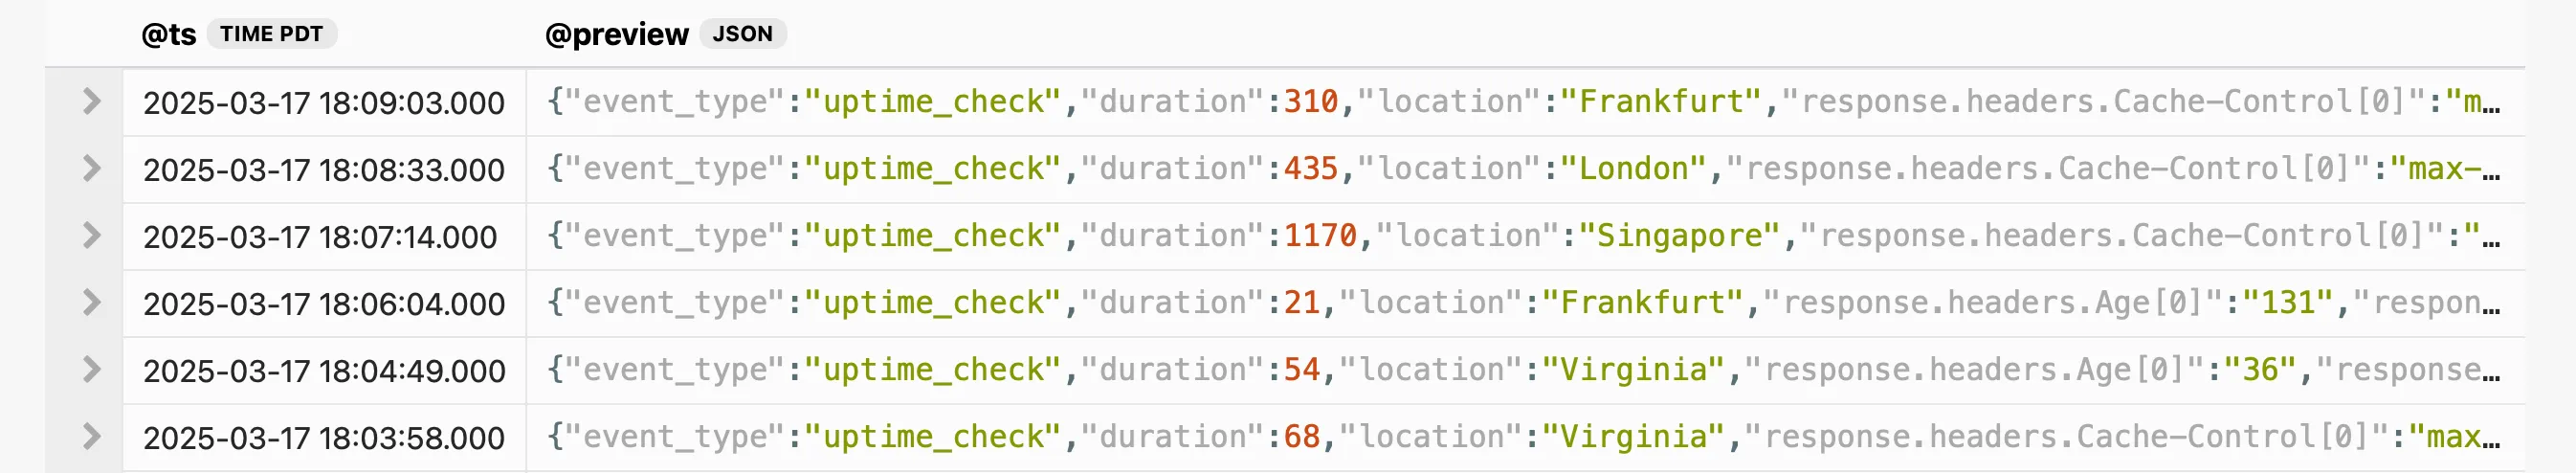
You can see that we’ve piped the initial results through filter, which accepts
a variety of conditions, such as the string comparison shown here. You’ll also
notice that we specified the data type of the event_type field (str) so the
query parser can validate the functions and comparisons that you use on the
field data.
Clicking on the disclosure arrow will show the all the fields that were stored for an event:
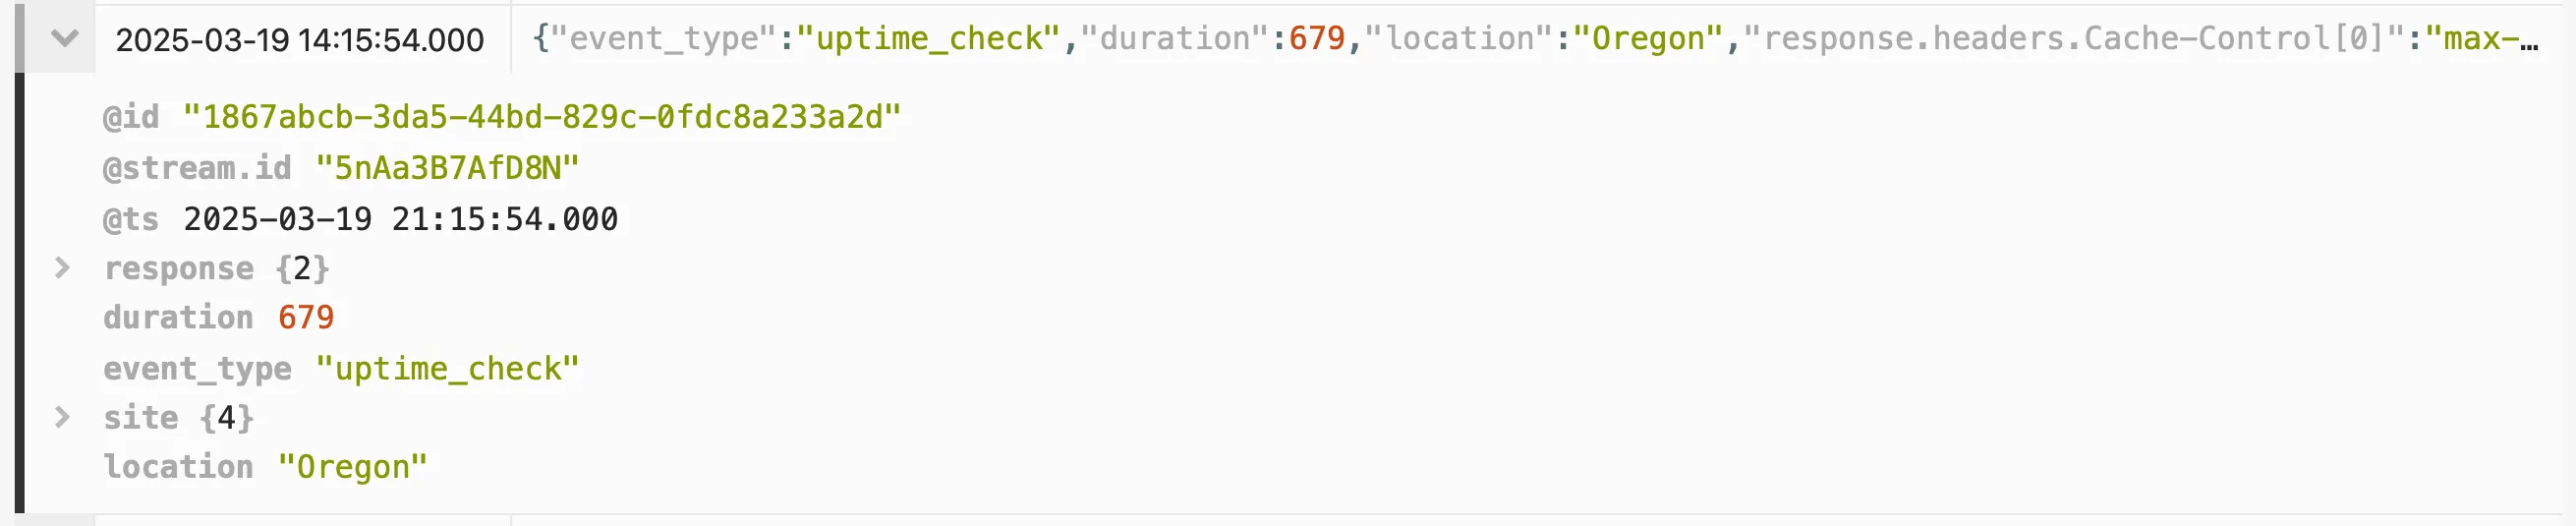
Additional disclosure controls appear inside the event detail view when the event has nested objects.
Let’s filter on some additional data that is present in these events. We can limit the results to show only the uptime checks that originated from our Virginia location, and we can change the fields that we display so we can see some info about the results of each check:
fields @ts, location::str, response.status_code::int, duration::int| filter event_type::str == "uptime_check"| filter location::str == "Virginia"| sort @ts
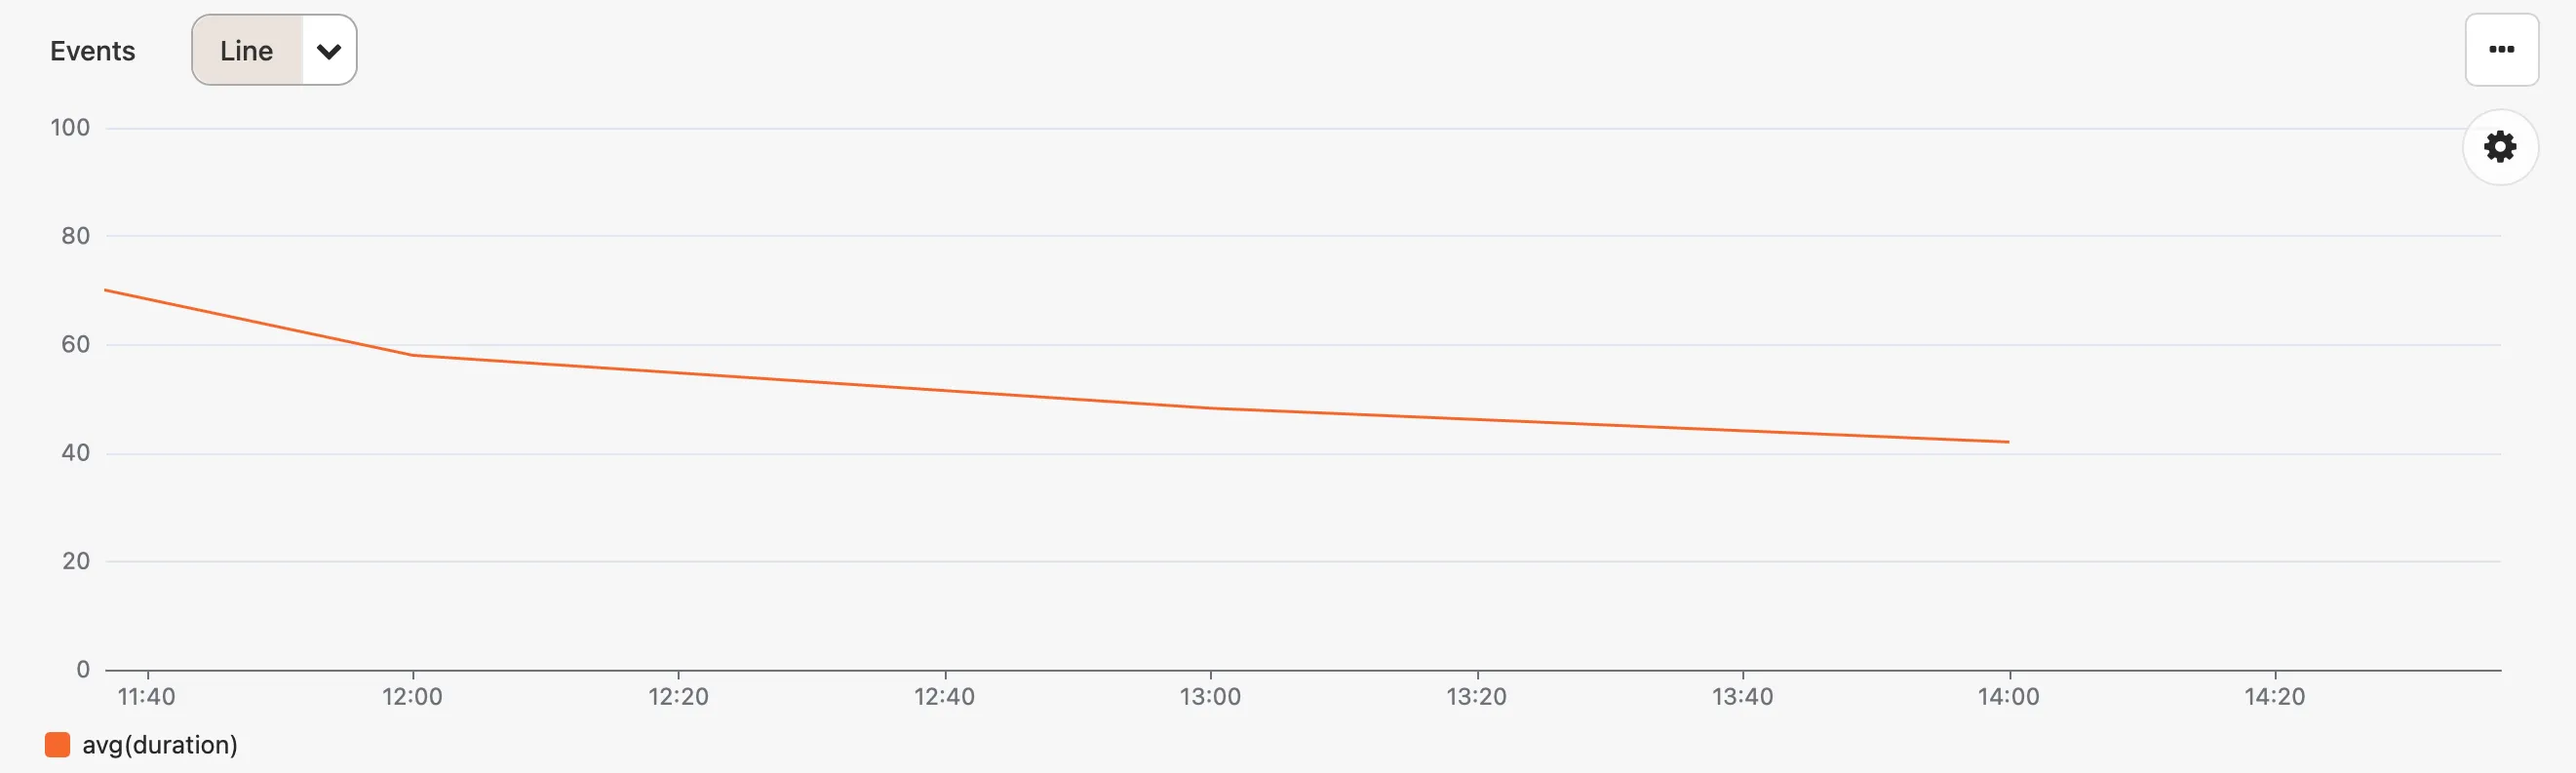
Now let’s summarize the data to find the average response duration for all successful checks:
fields duration::int| filter event_type::str == "uptime_check"| filter location::str == "Virginia"| filter response.status_code::int == 200| stats avg(duration) by bin(1h) as time| sort time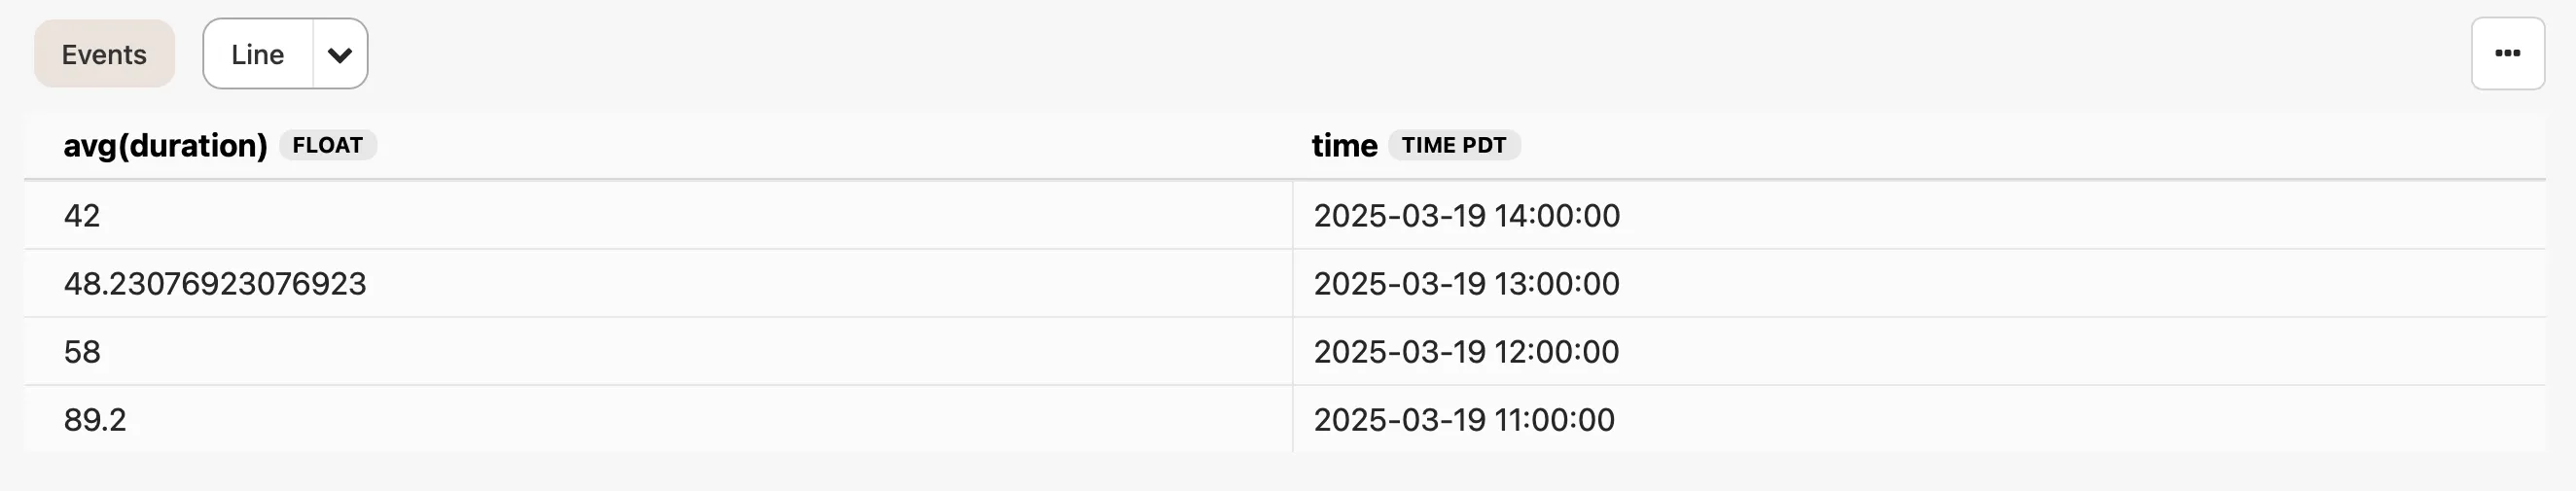
We use stats to perform all kinds of calculations, such as averages, and by
allows us to specify the grouping for those calculations. Grouping by bin
gives us time-series data, which makes it easy to create a chart by clicking the
Line button.
From there you can experiment with different visualizations, update the query to
change the chart (try changing 1h to 15m), and add the chart to a custom
dashboard.
Of course, this functionality isn’t limited to only the data that is generated
by Honeybadger. Your error data is also available for querying (event_type::str == "notice"), and you can send logs and events to our API to be
able to query and chart your own data.
Natural language queries
Section titled “Natural language queries”You don’t need to know BadgerQL to query your data. Click the
lightbulb icon to the right of the query editor to open the natural language
translator panel. Describe what you want to see, then press ⌘+Enter or click
Translate and Honeybadger will write the query for you.
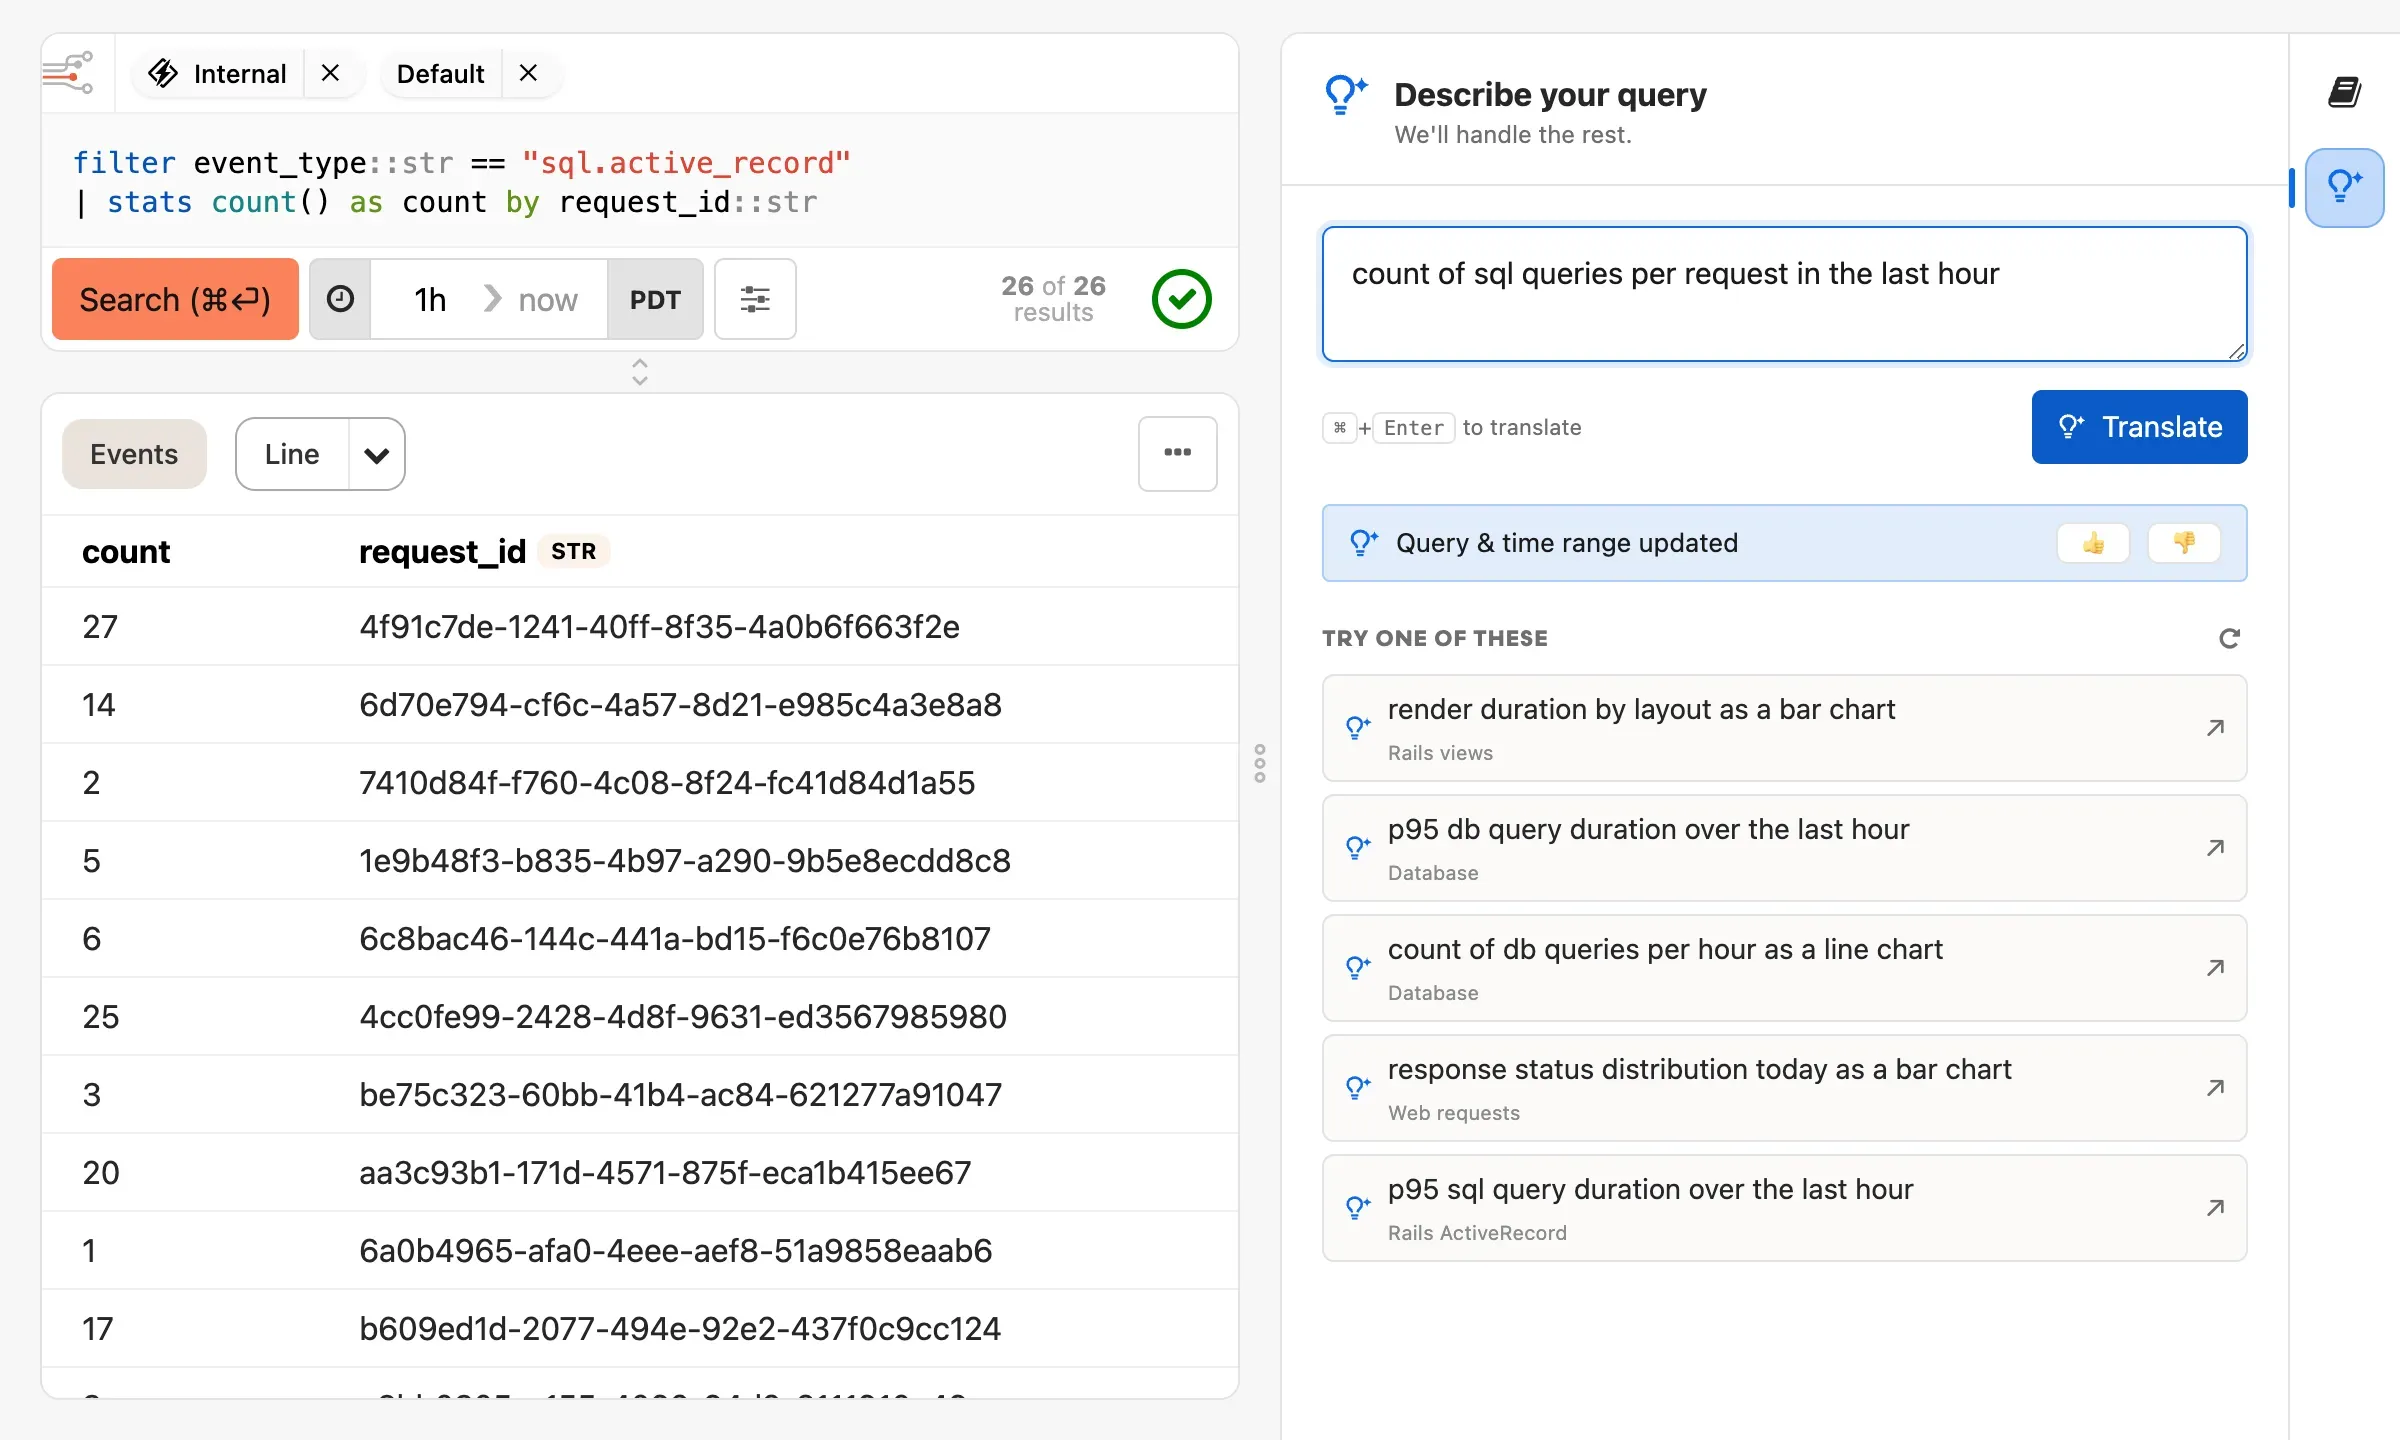
The translator uses your current query as context, so you can build up a query in steps. Start broad, then ask for changes like including the duration, grouping by controller, or narrowing to just 5xx status codes.
You can also include other display options in your description. For example, ask for “the last hour” or “as a line chart” and Honeybadger will update the time range or visualization.
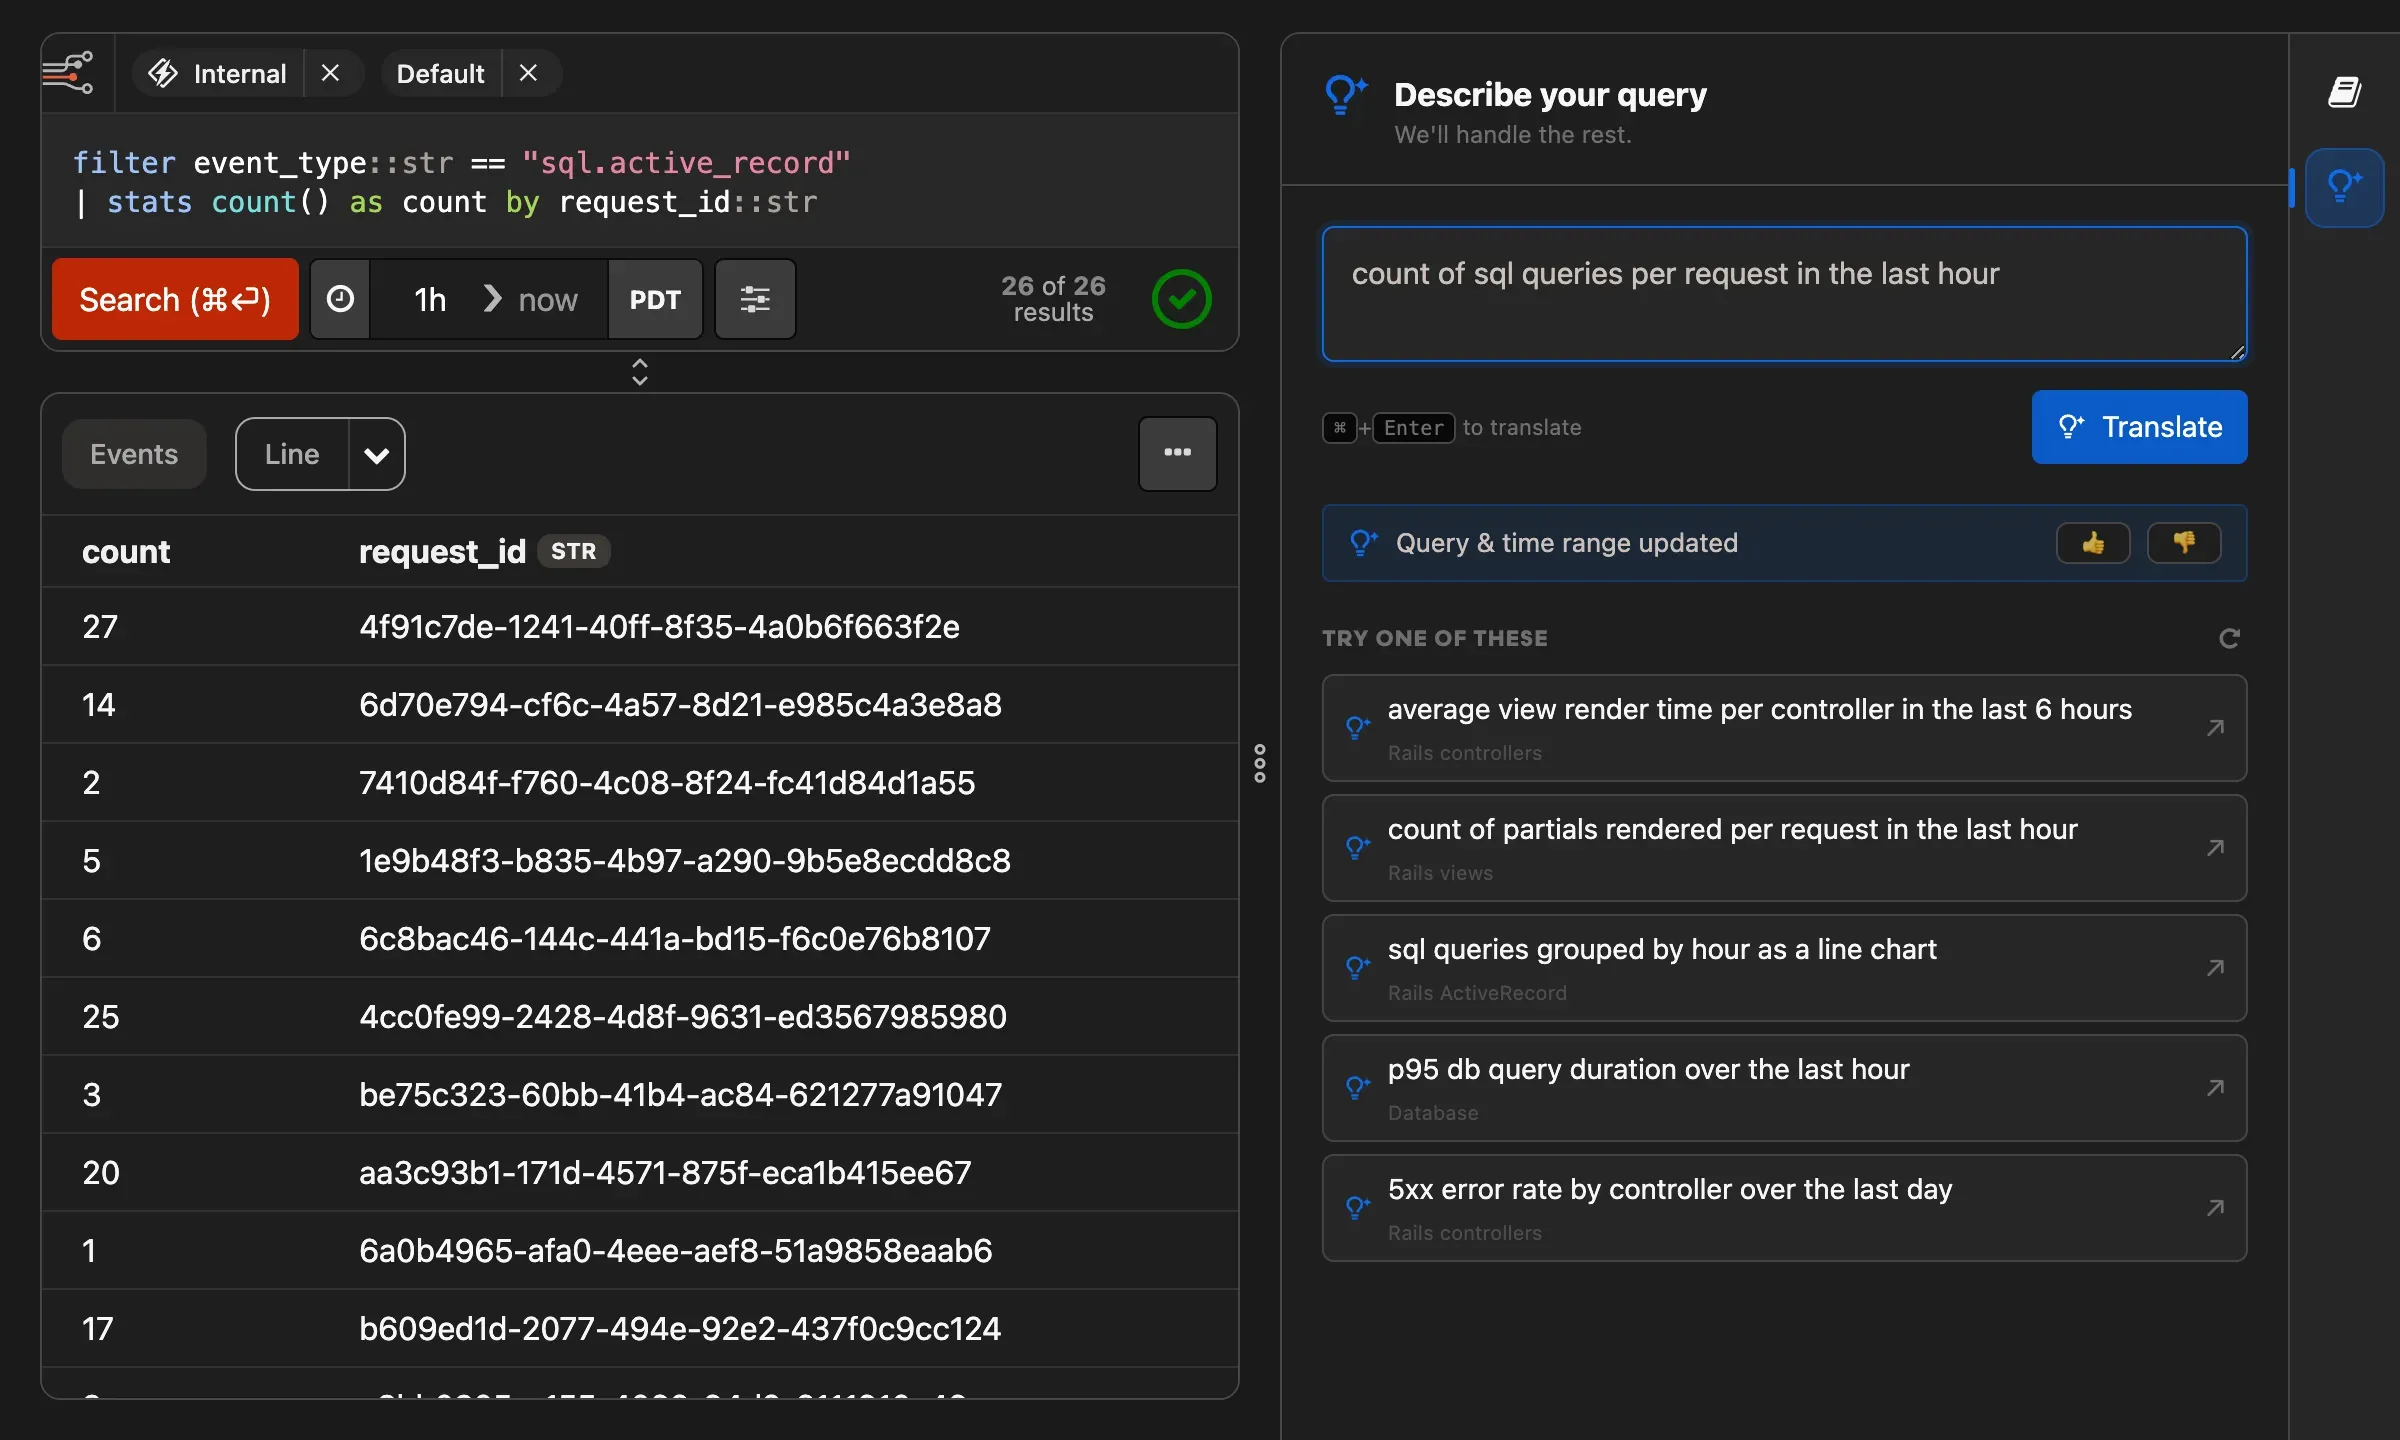
Note: The NL translator uses an LLM, so it may not always get things right. If the translations are not what you expected, please record your feedback via the thumbs, or feel free to reach out to support.
Streams
Section titled “Streams”Streams are the fundamental data sources in Honeybadger Insights. They serve as the starting point for your queries and represent the data you want to analyze.
When you create a new Honeybadger project, we automatically set up two streams for you:
Internal stream
The Internal Stream is a dedicated stream that stores all Honeybadger-generated events related to your project. This includes errors, deployments, notifications, uptime checks, and other internal Honeybadger data. You cannot directly send custom events to the Internal Stream, as it is managed by Honeybadger itself.
Default stream
The Default Stream is the primary stream for storing custom events that you send using Honeybadger client libraries or the Honeybadger API. Any event data you explicitly send to Honeybadger will be stored in the Default Stream.
The stream selector
Section titled “The stream selector”You can select the active streams from the stream selector at the top of the query editor. This affects the data that Insights returns for your queries.
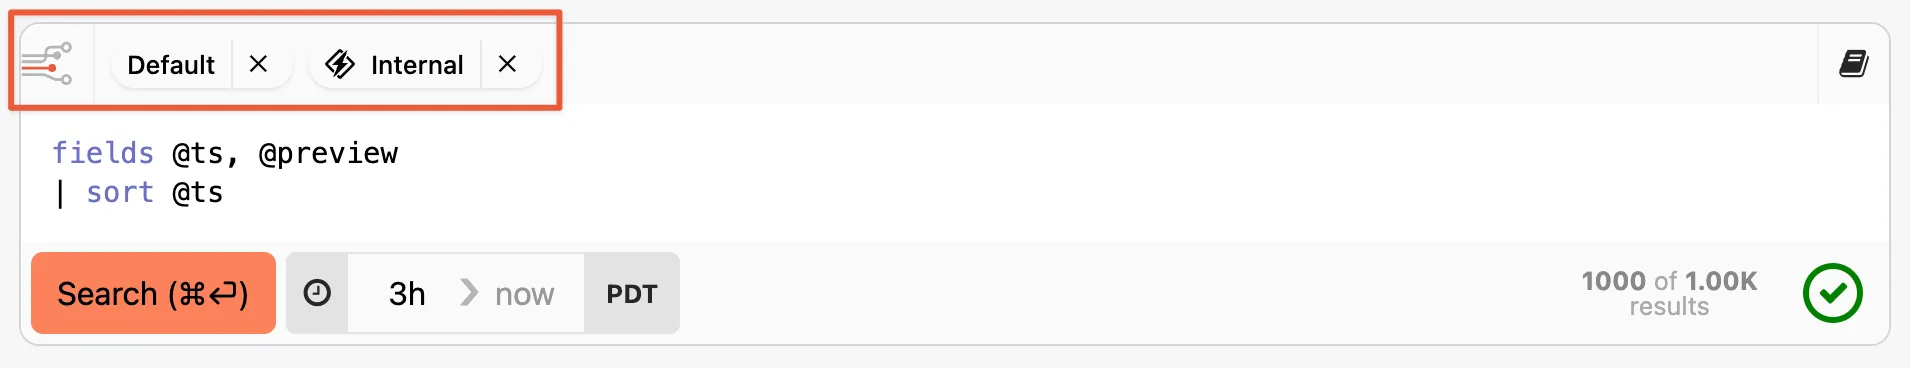
Removing a stream you don’t need can improve your query response times, because then Insights doesn’t need to scan that data when executing your query. So for example, if you’re just querying your application logs, you can remove the Internal stream to get a faster response.
Working with dashboards
Section titled “Working with dashboards”Dashboards allow you to collect different types of charts and query results on a single page. Any query or chart that you generate can be added to a dashboard, which will then be shared with the rest of your team. Each widget on a dashboard includes a link to view the query and raw results behind the widget:
If you change the query or the visualization, you can save those changes back to your dashboard, or add them as a widget to a new dashboard.
We provide some automatic dashboards to get you started. For example, when you add a Heroku drain to your app, the automatic Heroku dashboard will show data like the number of requests grouped by response code that we automatically collect from Logplex.
To learn more about dashboards, see the dashboards guide.
Adding data from other sources
Section titled “Adding data from other sources”Insights includes all the events that Honeybadger collects, such as error notifications, uptime checks, and check-in reports, but you can send your own event data as well.
Our API accepts newline-delimited JSON, where each line is a JSON object that describes an event that you care about. You can send user audit trail events, metrics, or any other data you’d like to query and analyze. The type of data most frequently sent to Insights is application log data.
Sending structured logs in a JSON format (like lograge produces) allows you to correlate what’s happening in your app with the error data that Honeybadger is already recording for you. See our integration guides to learn how you can easily send log events from sources such as Heroku apps and CloudWatch Logs.