Error monitoring
Installation
Section titled “Installation”Before you can start using Honeybadger to squash bugs, you will need to install our library into your app. Installation usually boils down to:
- Installing the Honeybadger library
- Setting the API key
- Enabling error reporting
The details vary a little depending on language and platform. But you can always find the correct installation instructions for YOUR app on the “Project Settings” page.
In case you are wondering, we officially support:
Ruby, client-side JavaScript, Vue, Elixir, Go, NodeJS, Java, Python, PHP, Clojure, and Cocoa
Check out any of these pages to see how to install Honeybadger for your app. Once our client library is installed and configured, errors thrown by your application are automatically sent to our API.
Error grouping
Section titled “Error grouping”Honeybadger groups similar exceptions together using rules which we’ve found to work the best in most cases. The default information we use to group errors is:
- The file name, method name, and line number of the error’s location
- The class name of the error
- The component/controller name
We use this information to construct a “fingerprint” of the exception. Exceptions with the same fingerprint are treated as the same error in Honeybadger.
You can customize the grouping for each exception by changing the error class name, component, or stack trace—or by sending a custom fingerprint.
Anatomy of an error
Section titled “Anatomy of an error”When your app reports an error to us, we make the details available on a web page that looks like this:
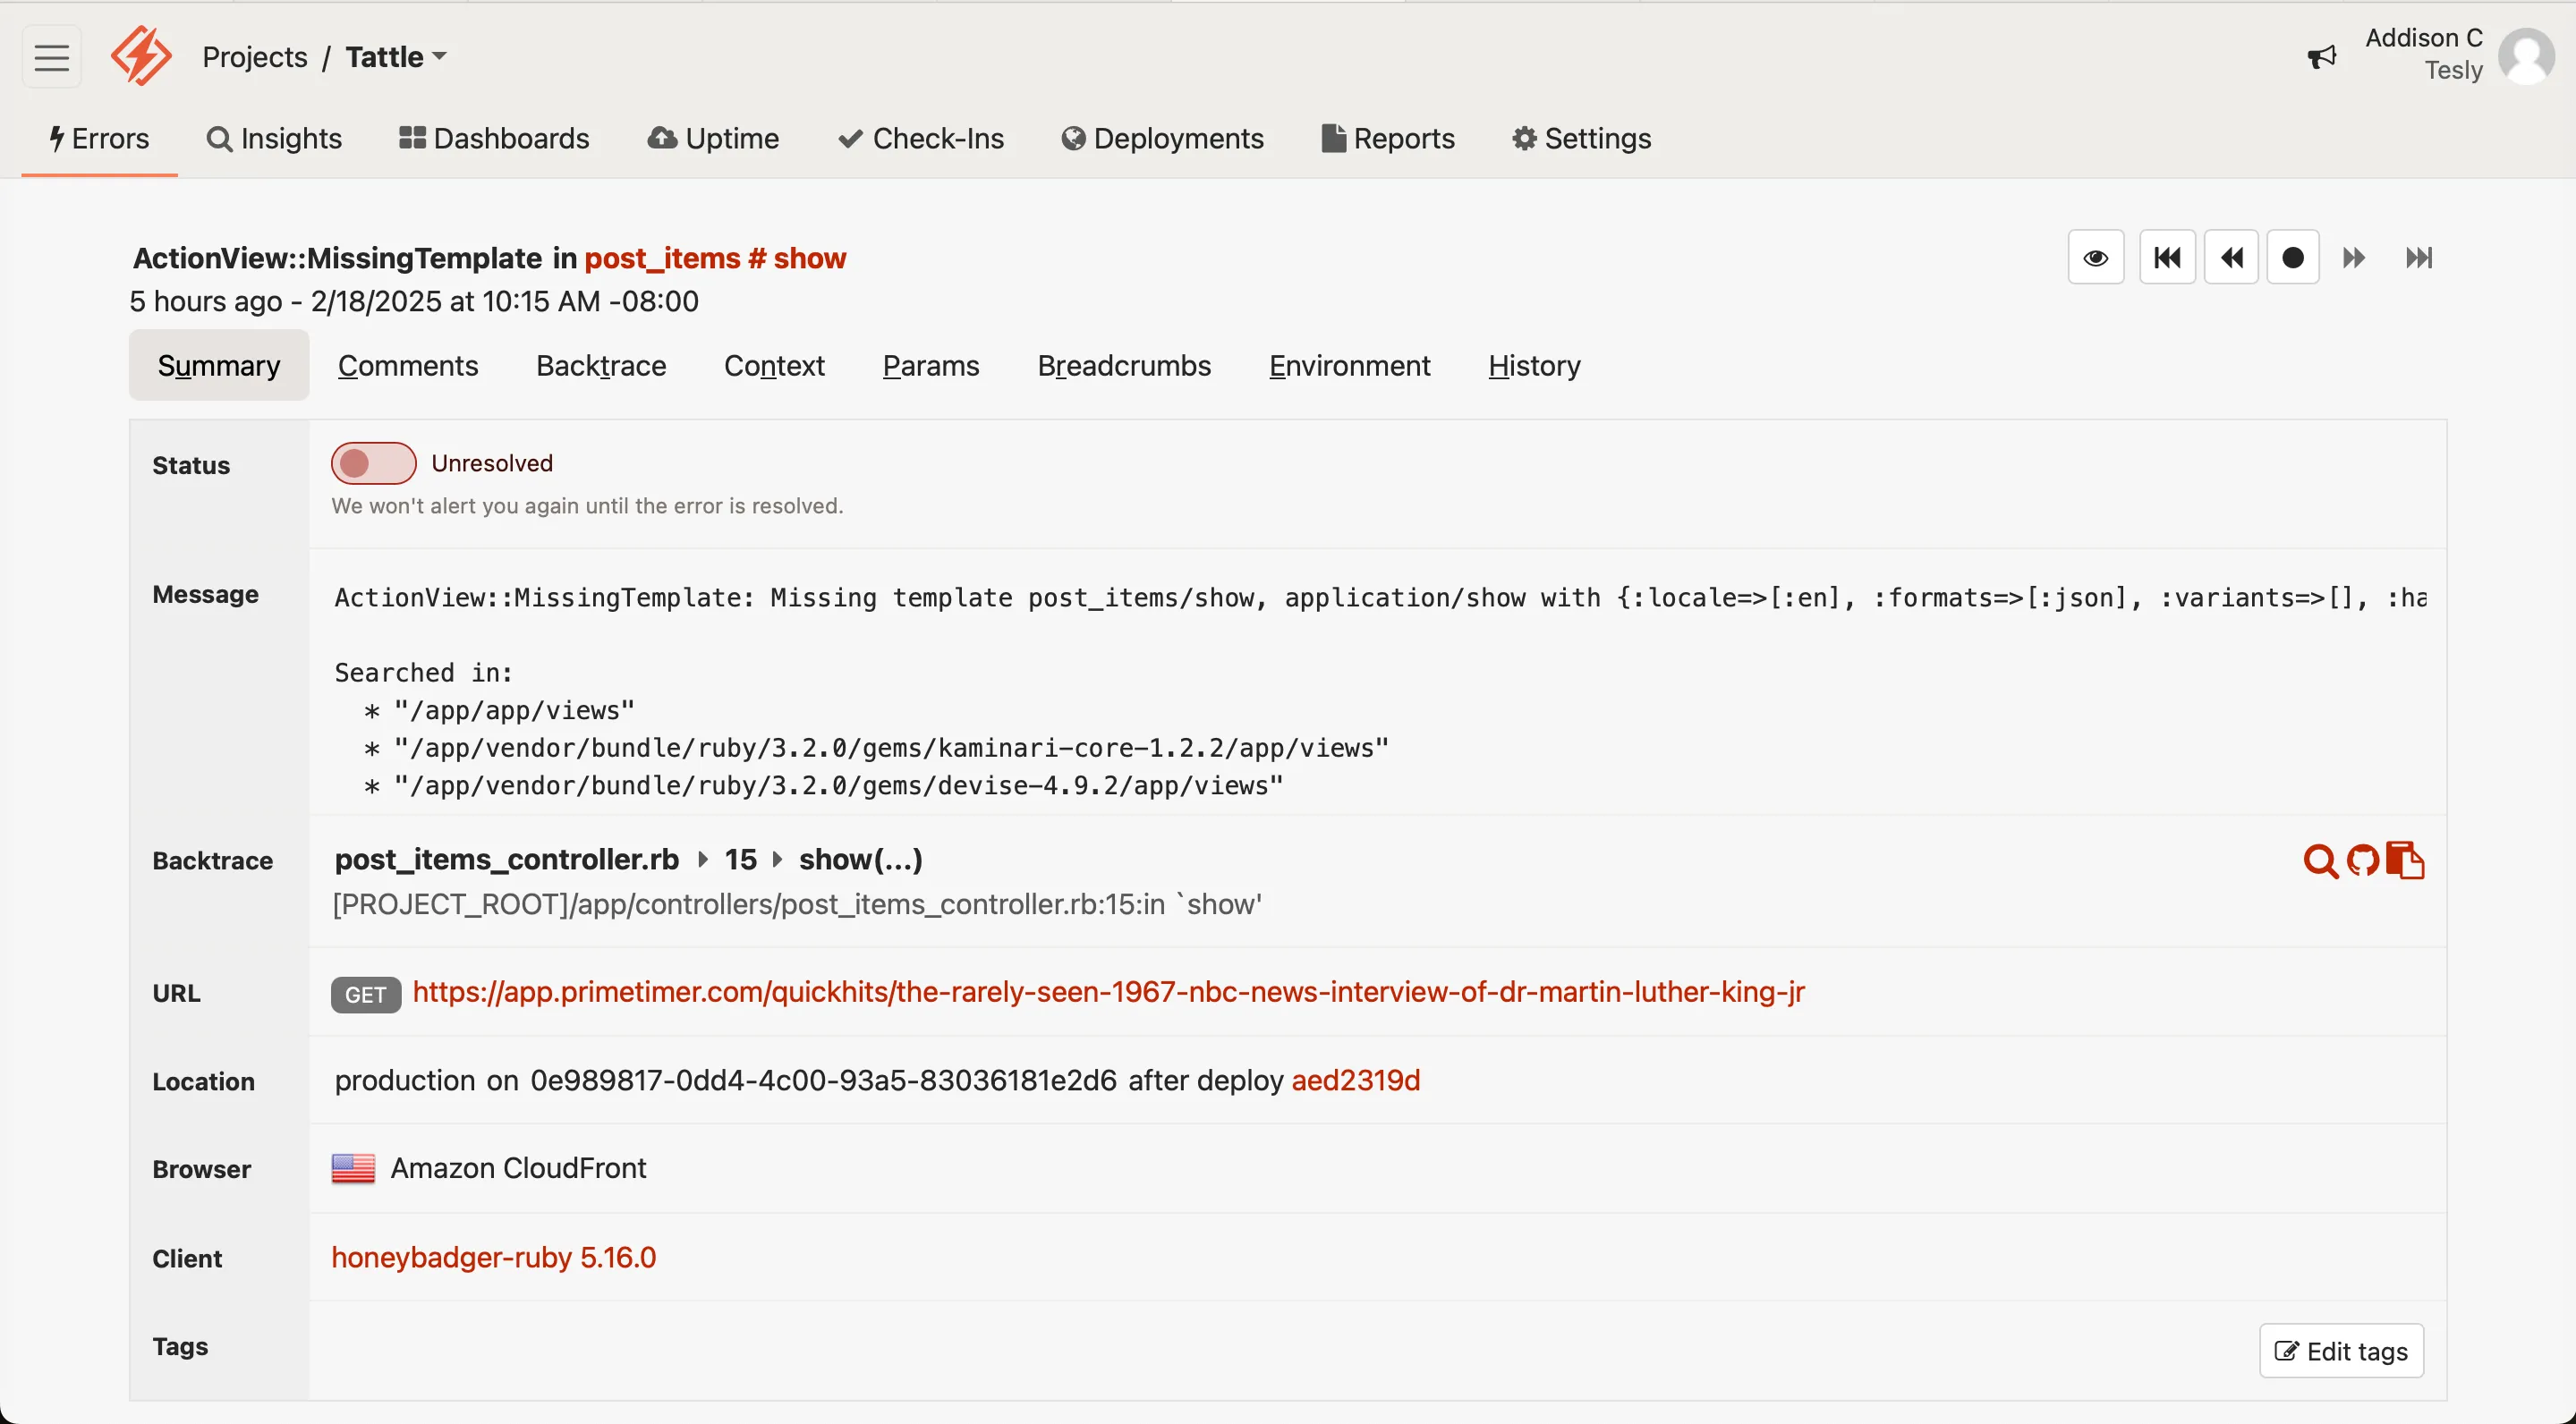
Yeah, it looks a little complicated. But once you understand what all the pieces are, you will see it is quite simple.
Let’s inspect this page, piece by piece.
Navigating occurrences
Section titled “Navigating occurrences”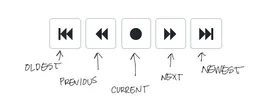
Honeybadger groups identical errors together. Using our navigation bar, you can still navigate between each individual occurrence (or notice, as we also call them) of the error.
Resolve / unresolve
Section titled “Resolve / unresolve”When an error is marked “unresolved” we will not send you any additional notifications when it re-occurs. Errors are auto-resolved on deploy by default, but that is configurable.

Error actions
Section titled “Error actions”Here you can perform many of the actions available to your error. Also, as you set up integrations for the project, any that can link back to the error (say, an issue tracker like GitHub) can be managed here.

Assign an error
Section titled “Assign an error”Using this button, you can assign the error currently viewed to any user in the project. This can later be used to search by assignment, or, with assignment notifications enabled, to inform a user that a new error has been assigned to them.
Pause or ignore an error
Section titled “Pause or ignore an error”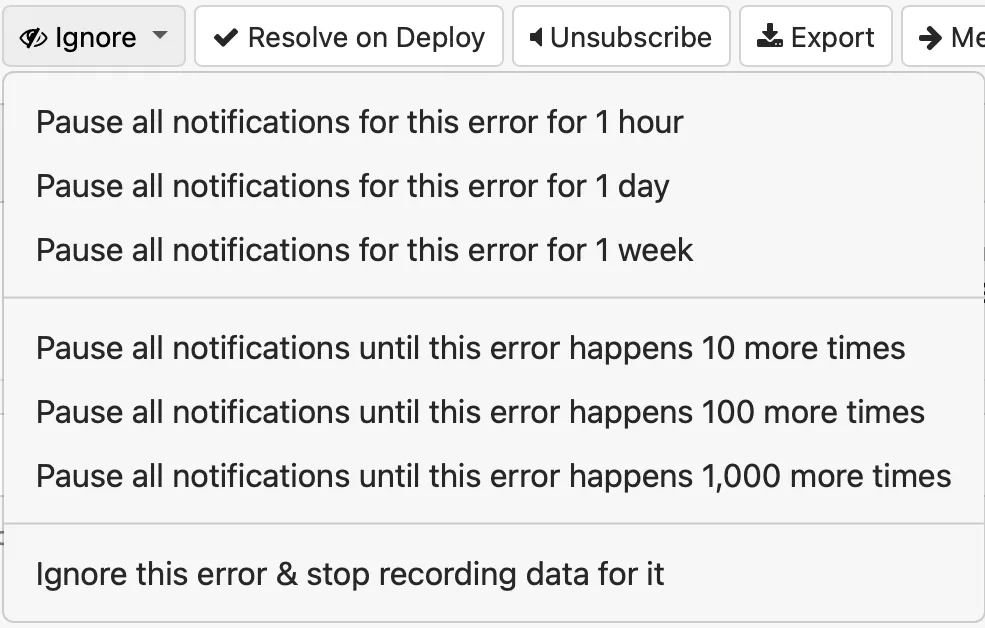
One of the more common actions used is to ignore the occurrences of an error.
Pausing
Section titled “Pausing”You can choose to “Pause” for a time duration or occurrence count. We will still record the occurrences, we just will not notify you.
Pausing notifications does not affect the resolved/unresolved status of an error. If you resolve an error while notifications are paused, the next occurrence will still mark it as unresolved — you just won’t be notified about it.
When notifications resume depends on the type of pause:
- Time-based pause: Notifications resume on the first occurrence received after the time period has elapsed.
- Count-based pause: Notifications resume on the occurrence that exhausts the count (e.g., the 10th occurrence when paused for 10).
In both cases, a notification will be sent even if the error was already reopened by an earlier occurrence during the pause.
Ignoring
Section titled “Ignoring”When you “ignore” an error we will stop recording altogether, so it will not go against your quota.
Resolve on deploy
Section titled “Resolve on deploy”By default, Honeybadger resolves all the errors in your project when you report a deployment, causing new alerts to be sent for any of the errors that re-occur. You can turn off this behavior by unchecking the “Resolve on deploy” checkbox in Project Settings. When turned off, there is a new action in the actions area of the error detail page, allowing you to resolve individual errors on the next deploy.

To find errors waiting to be resolved on the next deploy, use the is:pending_resolution search token.
Unsubscribe
Section titled “Unsubscribe”Unsubscribing from an error disables it from sending notifications - but only for the user currently viewing the error. To silence it for all users, use the pause action.
Export an error
Section titled “Export an error”The Export dropdown allows you to download the data for the current error as Markdown, or export a JSON file of all occurrences via email.
The Markdown version includes the error summary, stack trace, environment details, and breadcrumbs for the current error formatted in standard Markdown syntax compatible with GitHub, Notion, Google Docs, and other Markdown-capable tools.
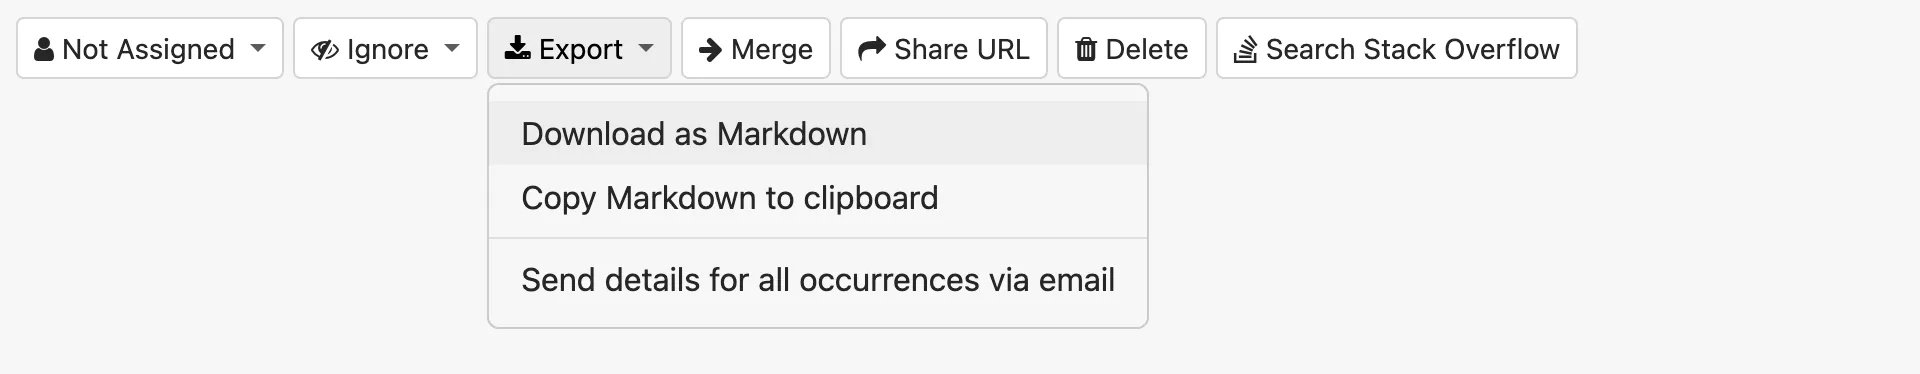
When exporting all occurrences, you’ll receive an email to download a JSON file containing the data. This file is a newline-delimited JSON file, which means each line is a valid JSON object. Each of those JSON objects has the data (parameters, context, etc.) for a single occurrence of the error.
Merge errors
Section titled “Merge errors”Using the merge action, you can combine one error with another error. This takes all the existing notices from the “donor” error and adds them to the “receiver” error’s notice history.
Share URL
Section titled “Share URL”Sharing the URL of the error will give you a link to a webpage displaying the error. This webpage does not allow for any actions, comments, or the ability to resolve the error.
Delete
Section titled “Delete”This removes the error and all of the notice history for that error. This is especially useful if your error information happens to accidentally include sensitive information. New instances of the error will appear again on a new error page.
Action integrations
Section titled “Action integrations”GitHub and other project management integrations will add another action button - in GitHub’s case the button is labeled “Create issue”. Other integrations will behave similarly.
Anatomy of an error, continued
Section titled “Anatomy of an error, continued”Each error page contains a substantial amount of detail related to the error itself and a history of all the actions done to the error. You can see how many times it was resolved or merged and who performed each action.
From the top of the error page, you can see all of the categories and can click to any of them. There’s even a keyboard shortcut for each category.

Notices
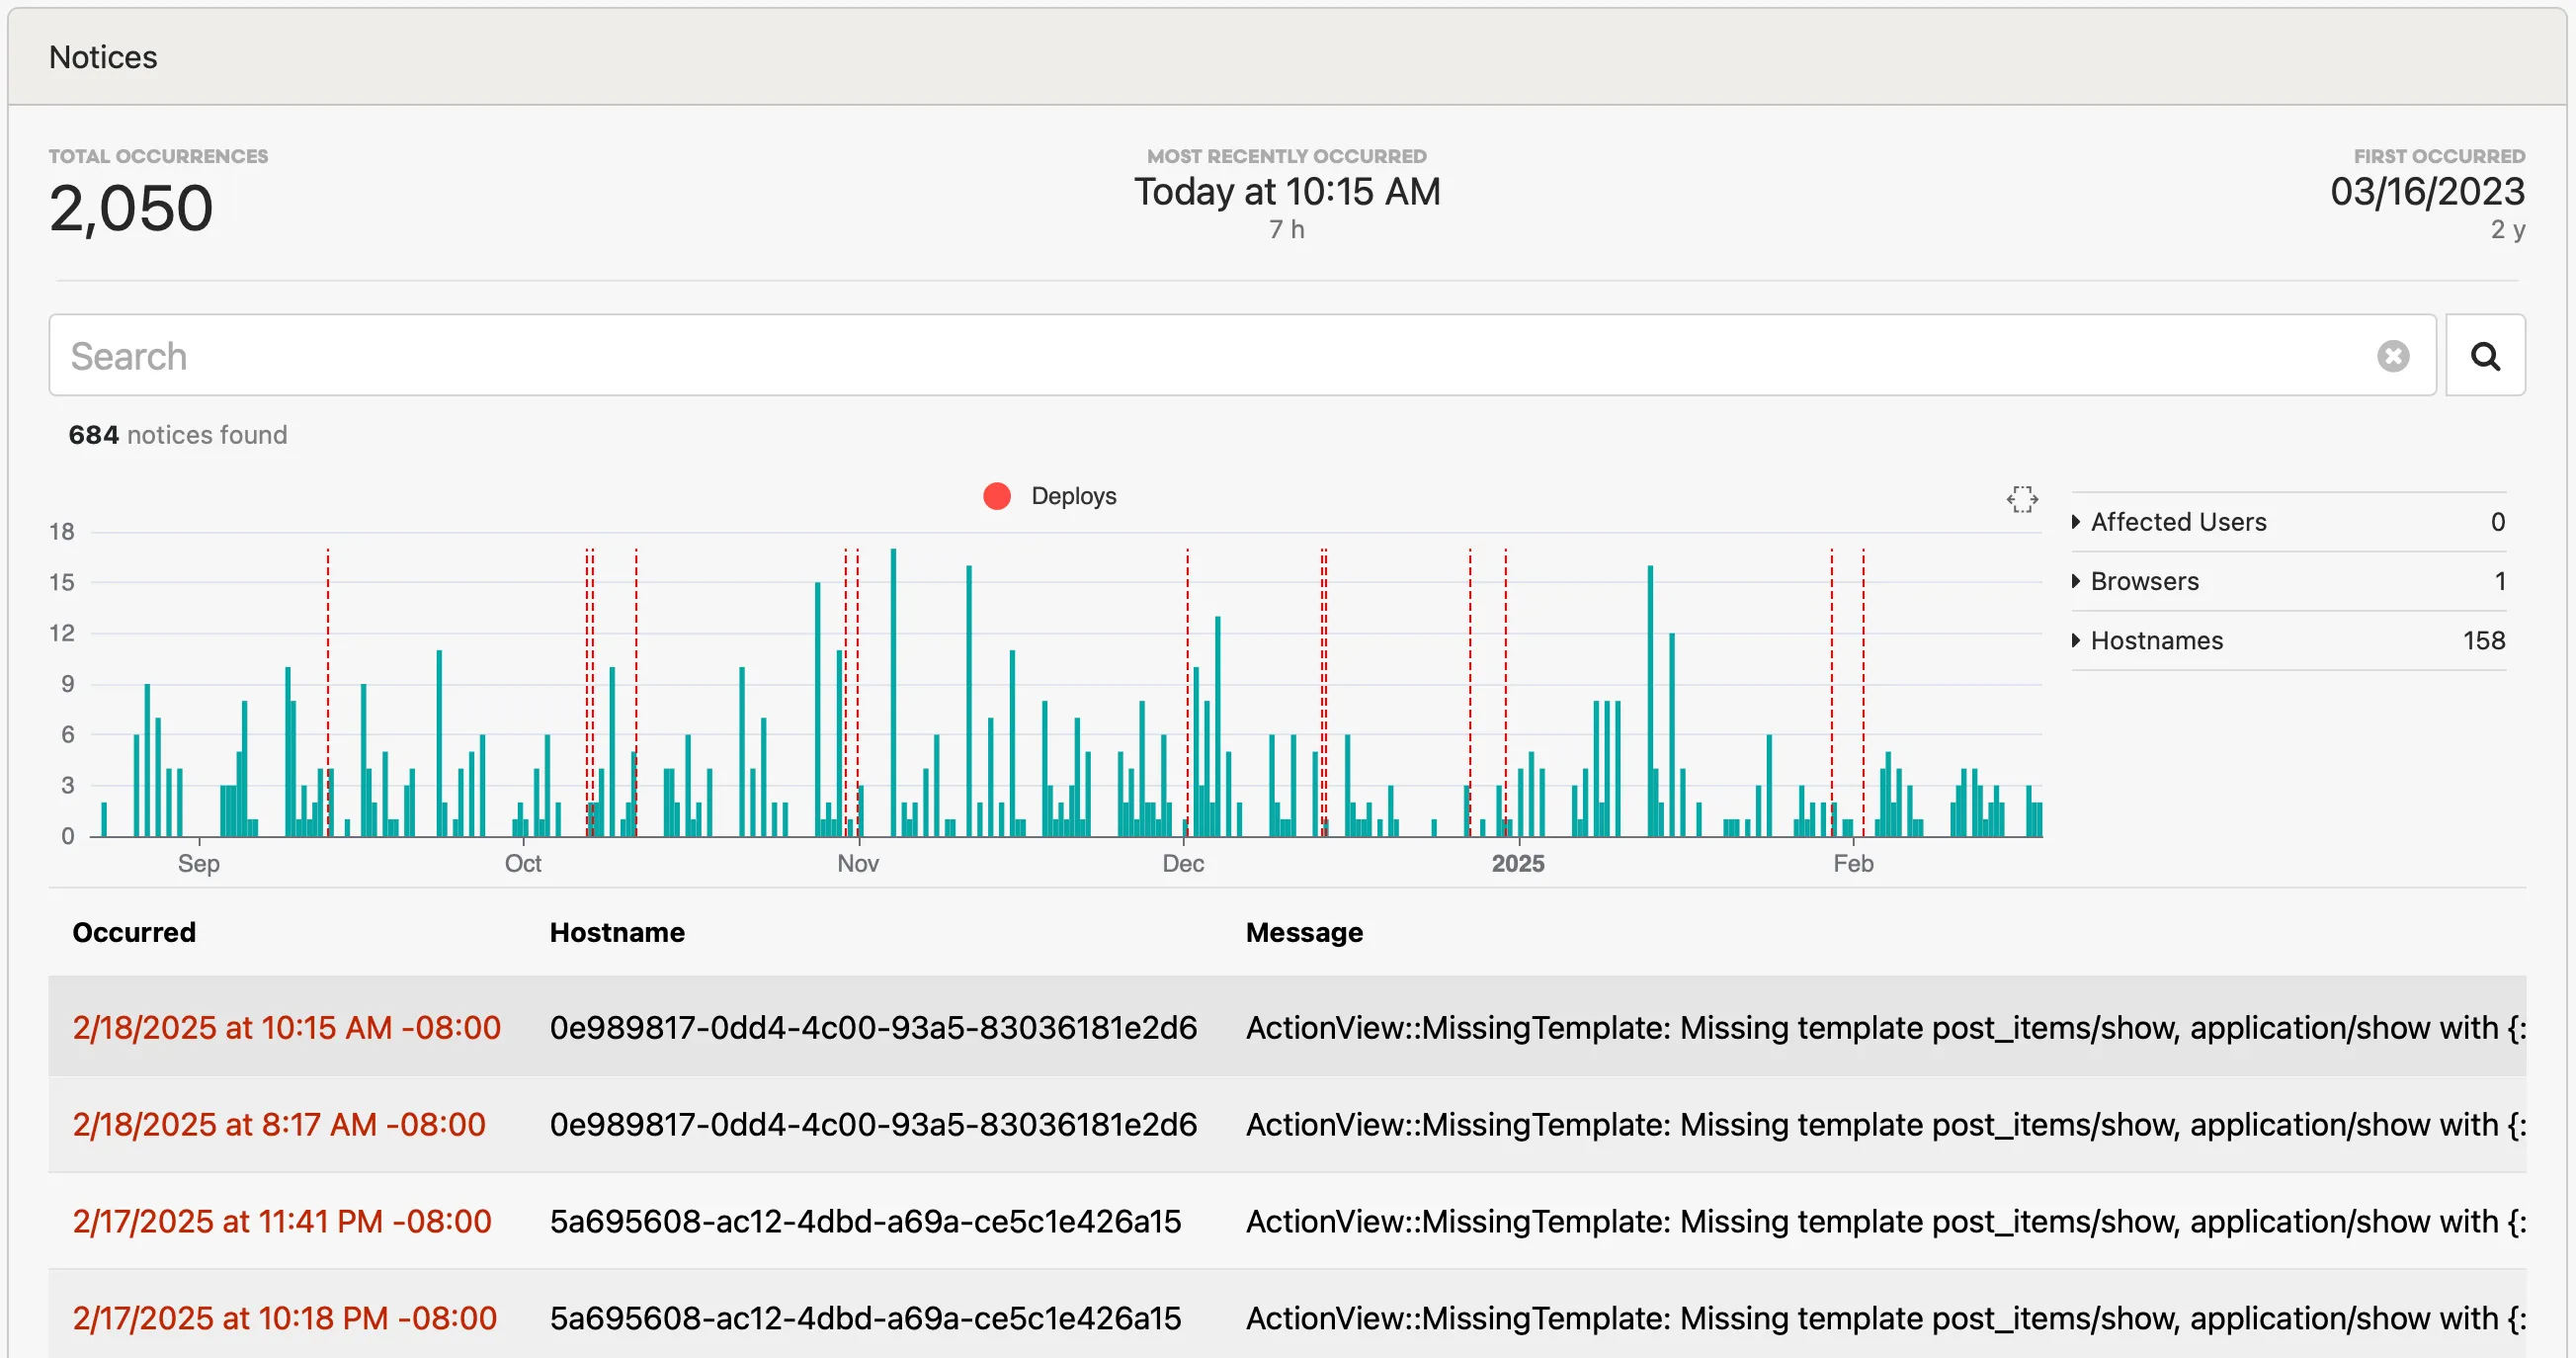
Section titled “Notices”The Notices section allows you to see the distribution of occurrences over time. You can constrain the dates and filter using the same search criteria as our error search. When you view an error after doing a search, the search criteria will be applied to the notice list.
Comments
Section titled “Comments”Communicate with team members, or record notes to retain context around an error. Your comments can be formatted in GitHub-flavored Markdown.
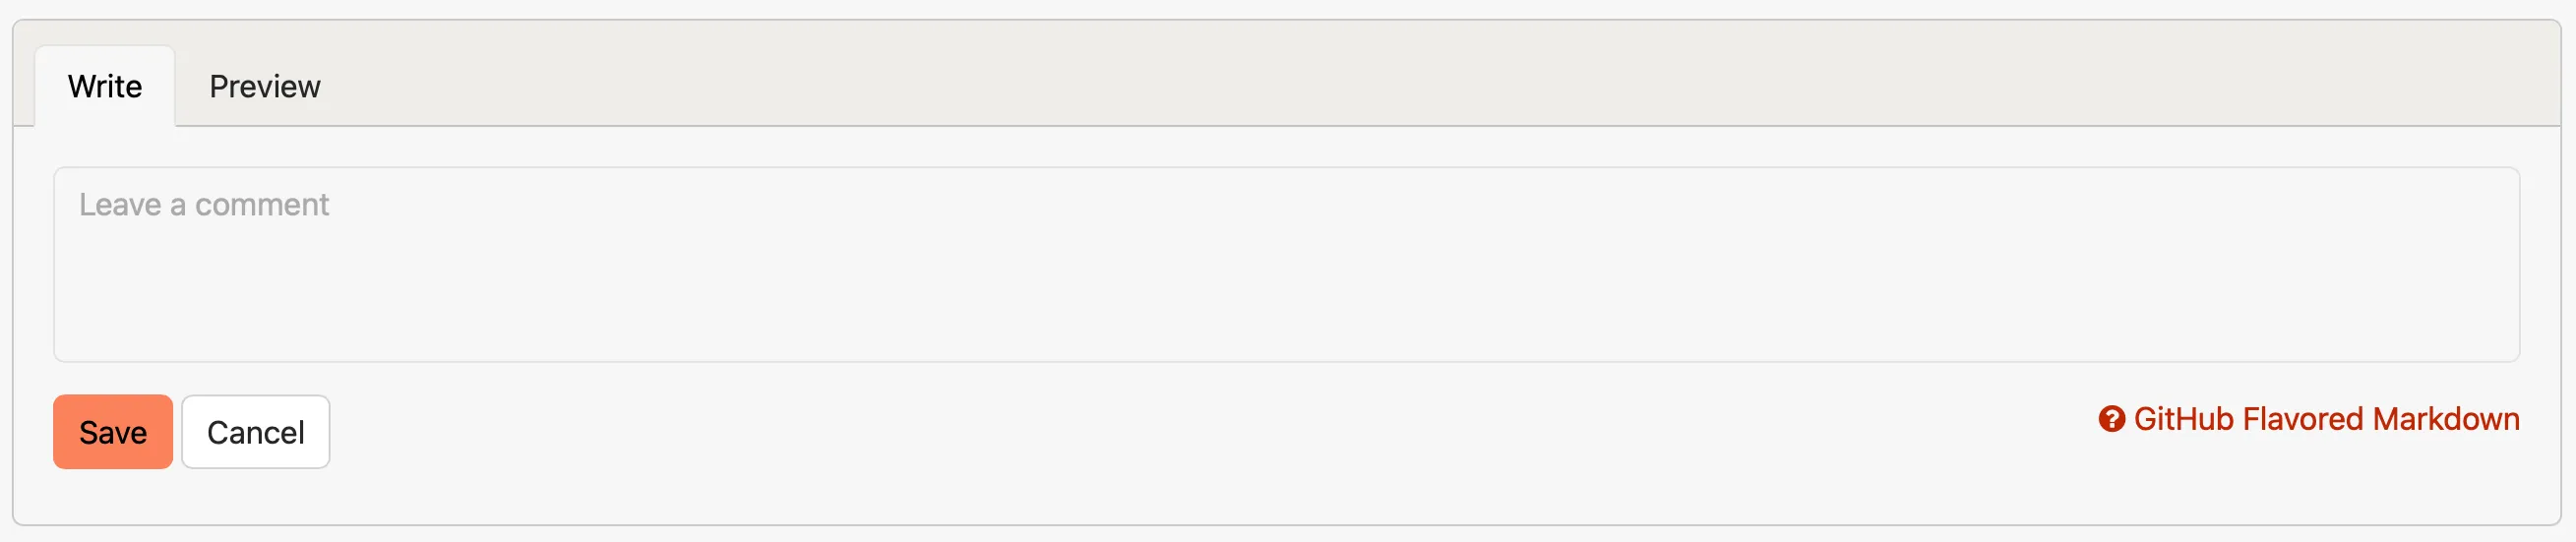
Type @ in a comment to mention a teammate. An autocomplete menu lets you pick
from the project’s members, and mentioned users are notified by email and by
in-app notification (subject to their personal alert preferences). Editing a
comment to add a new mention also notifies the newly-mentioned user.
Backtrace
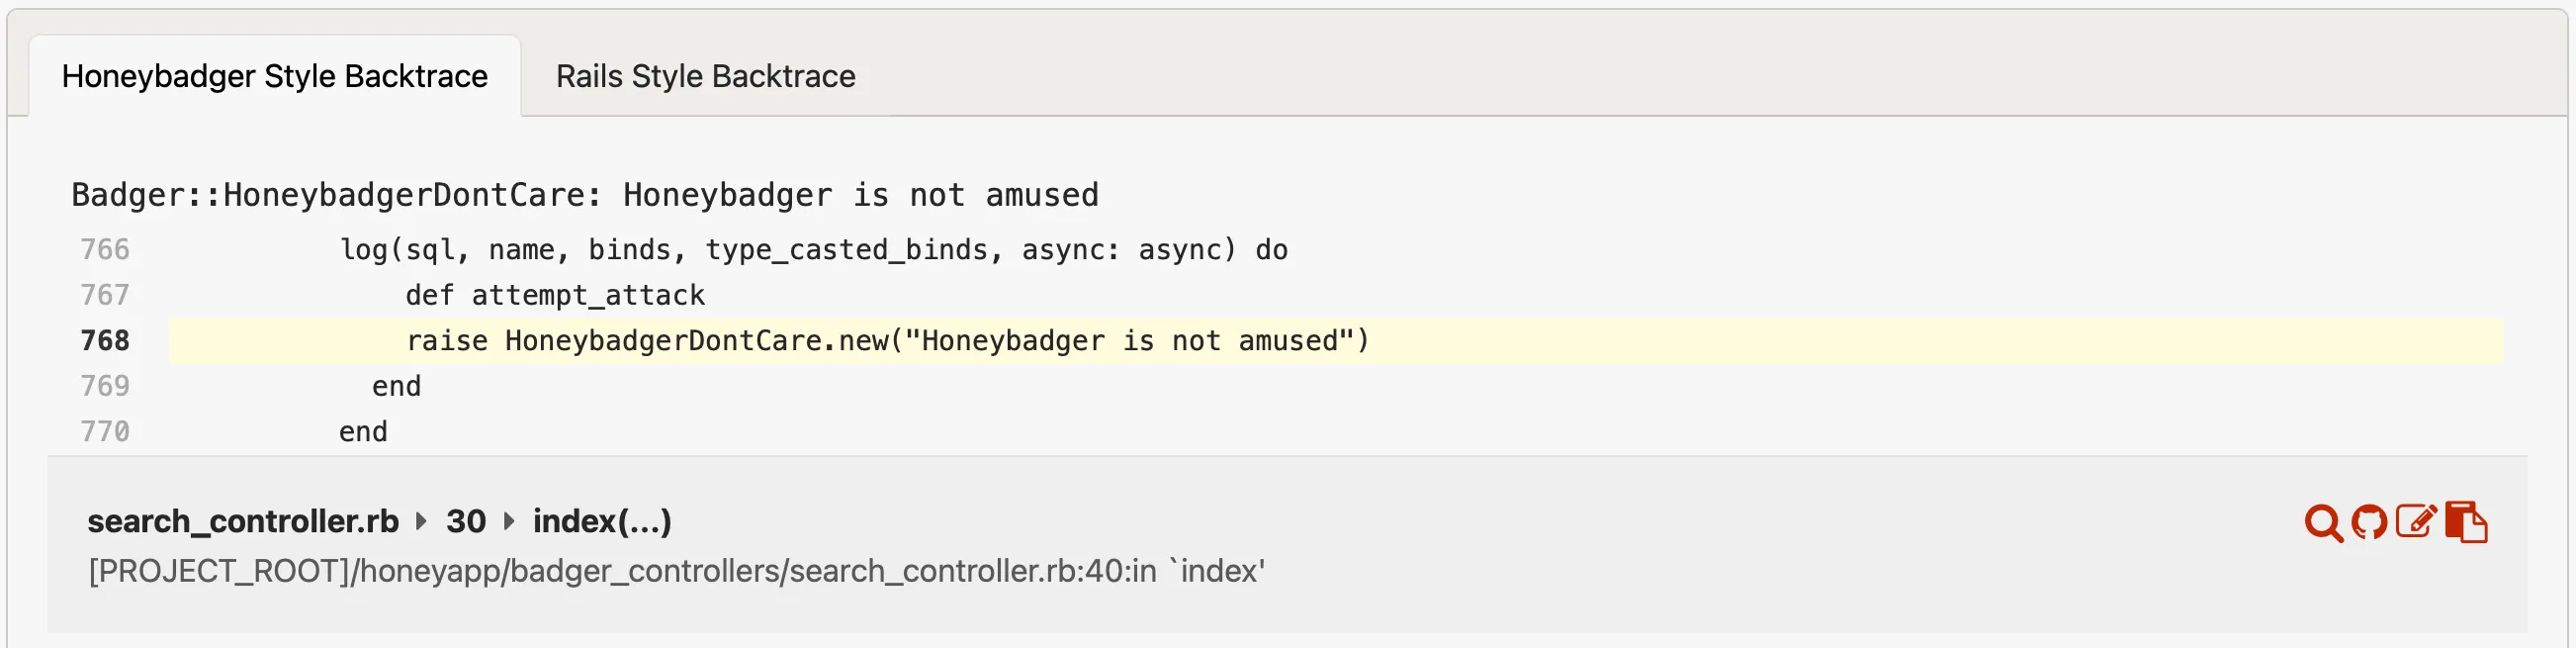
Section titled “Backtrace”Each line in the backtrace links to the GitHub or Bitbucket repo. You can even click a button to open the file in your local editor.
Request params, cookies, ENV, etc.
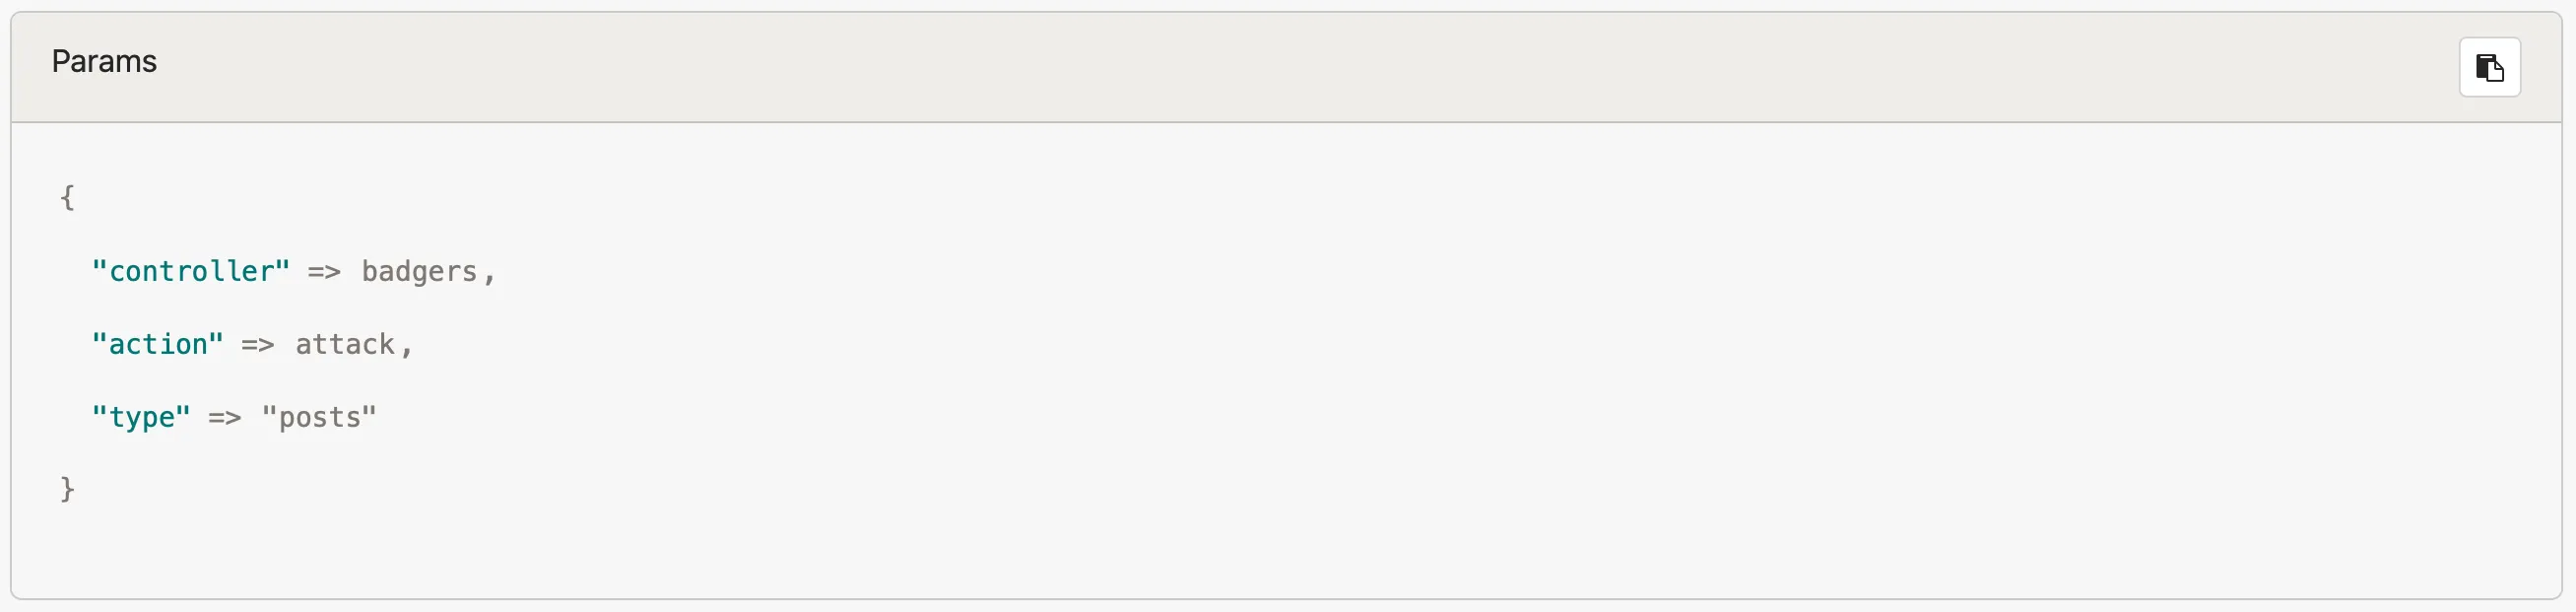
Section titled “Request params, cookies, ENV, etc.”When an error occurs during a web request, we record all the relevant debug info like params, cookies, the session, etc.
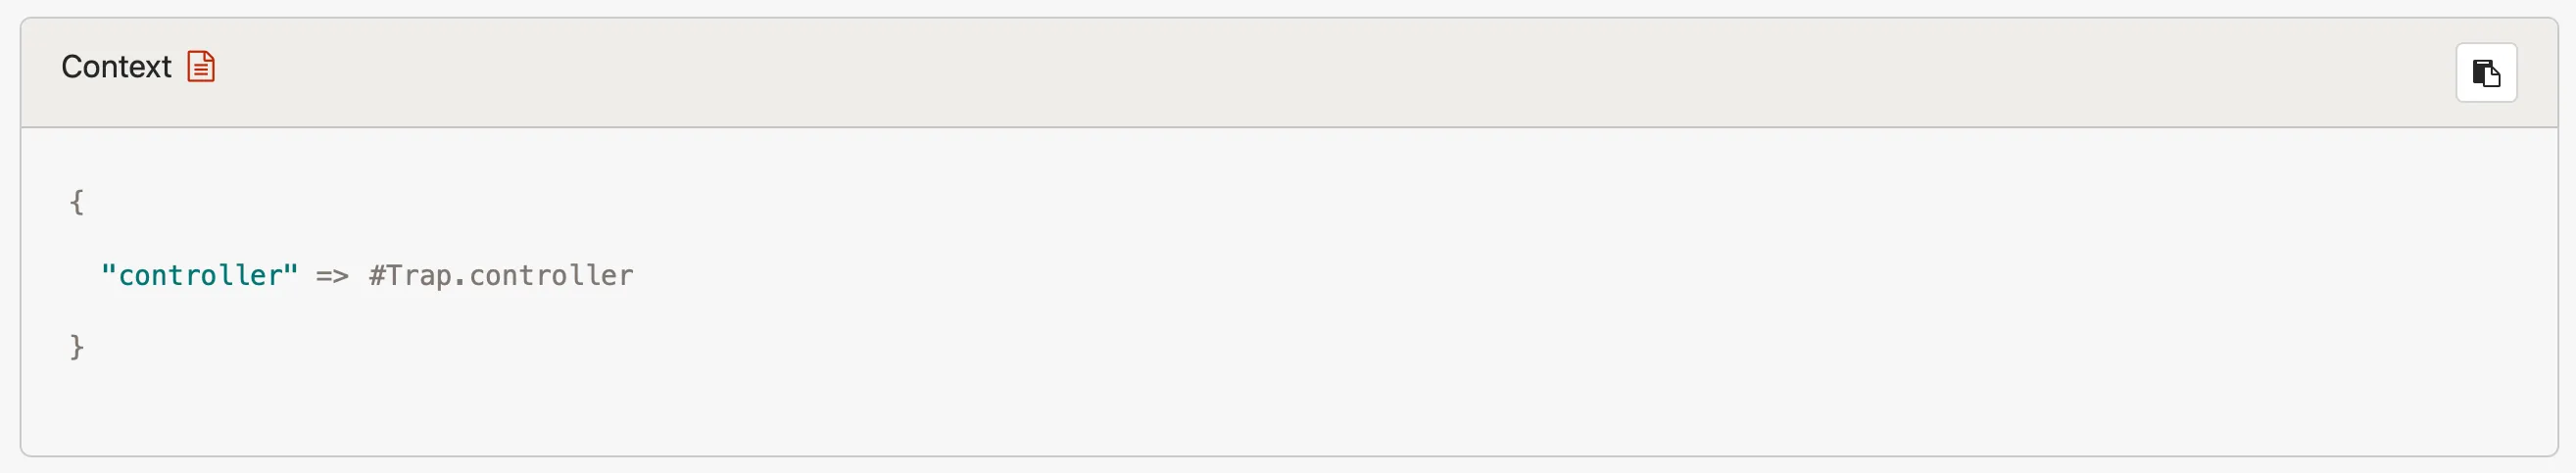
Context data
Section titled “Context data”Our clients support providing a special set of data called context. This data is provided by you to help with debugging. You can use our search functionality to find errors with specific context.
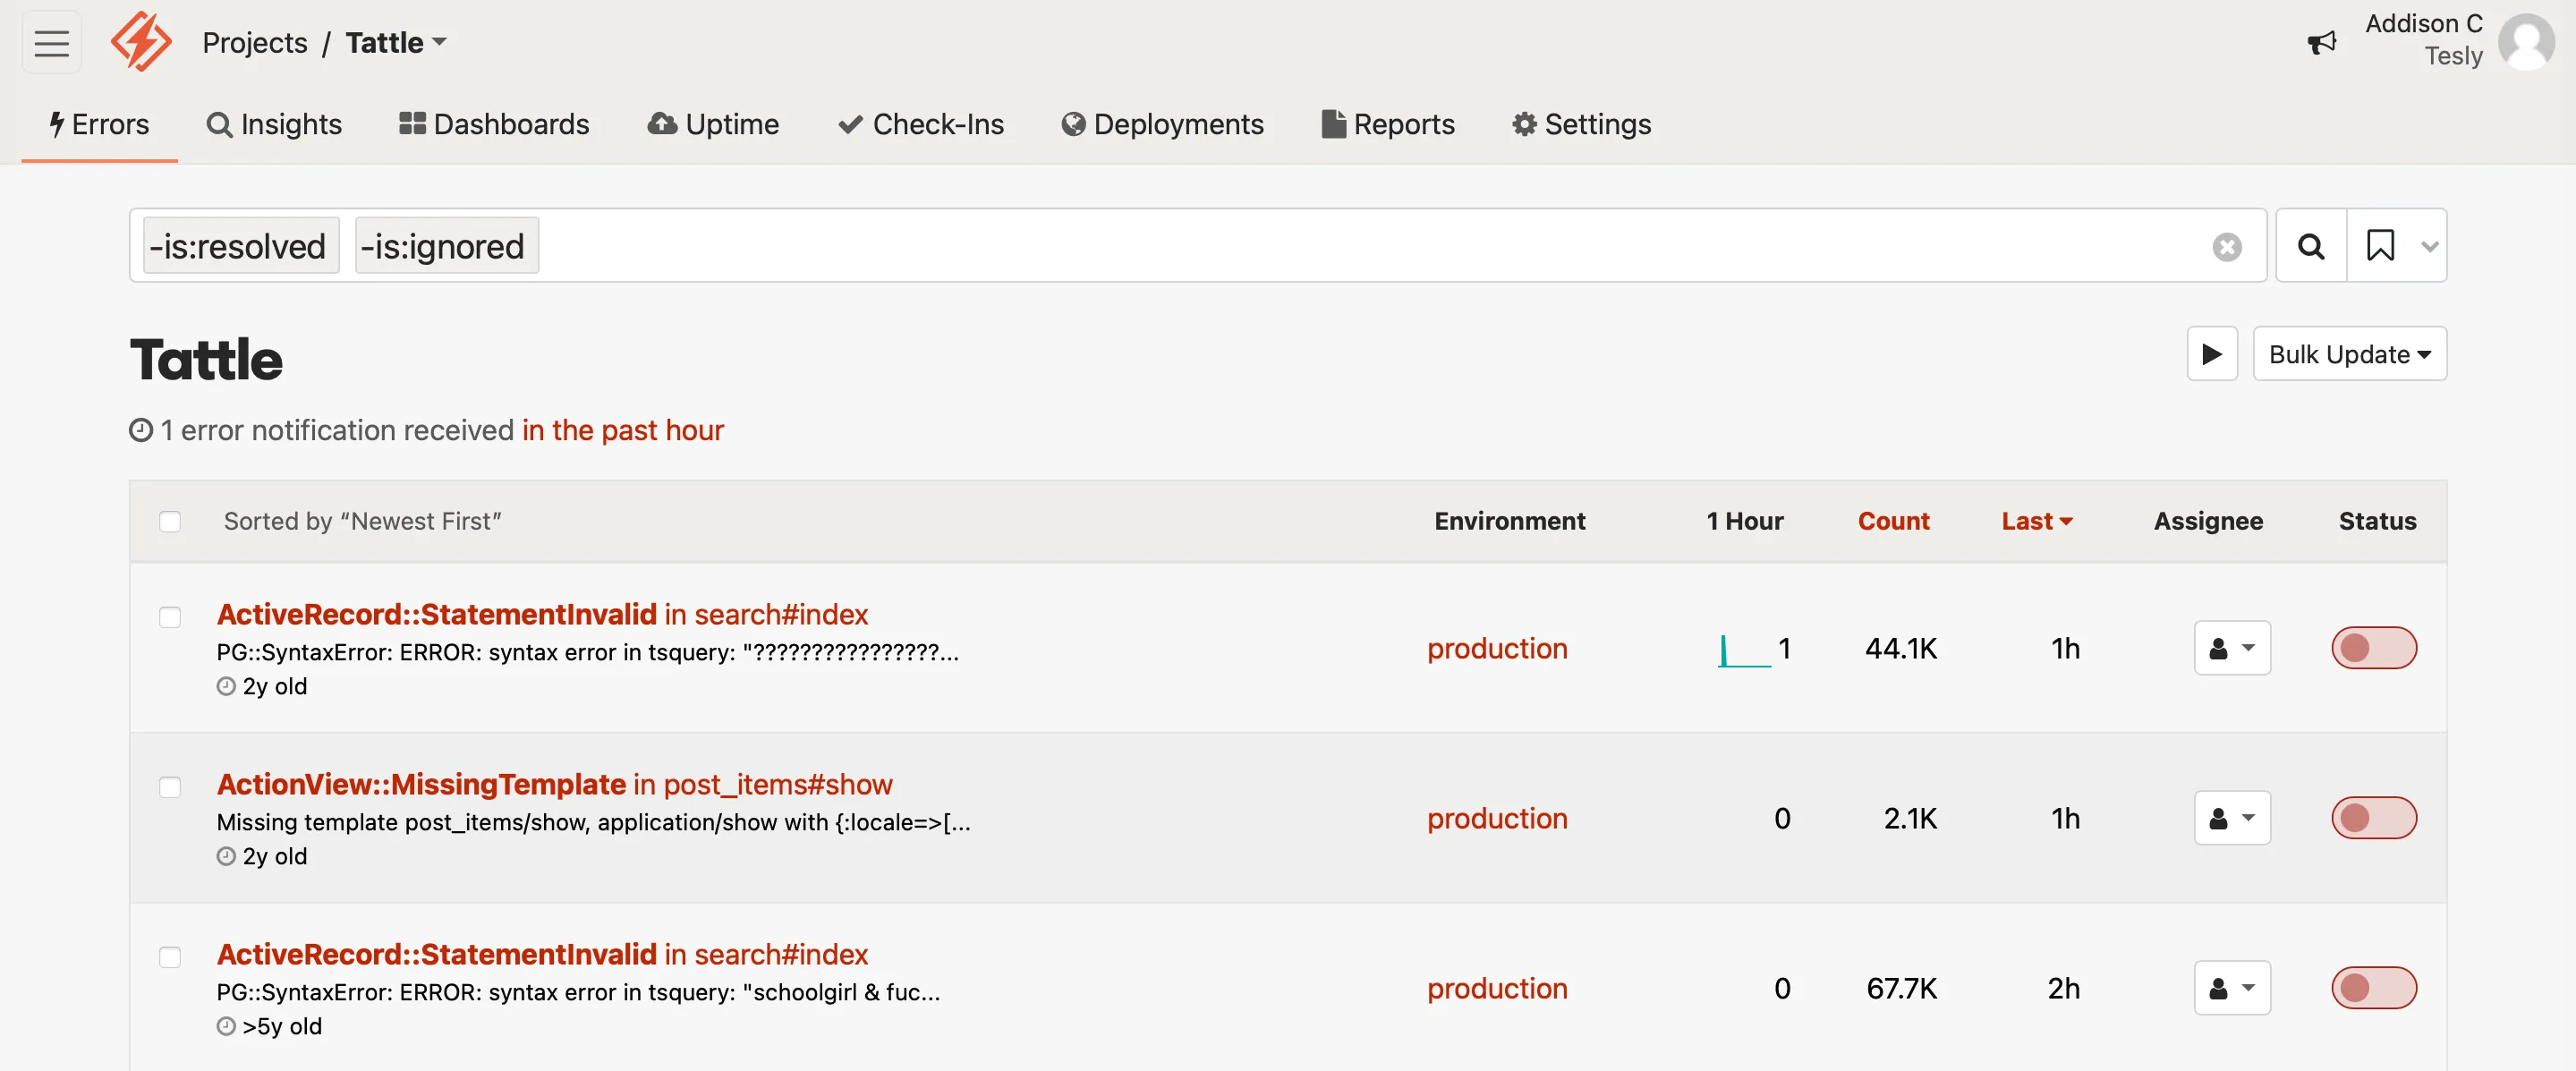
Browsing errors
Section titled “Browsing errors”Once you start collecting errors, it can be difficult to keep track of them. To make it easier, we’ve built a great interface for browsing and searching errors.
Search
Section titled “Search”With advanced search, you can search by any field of params, environment, cookies or the session. Check out our dedicated search guide for more info.
Batch actions
Section titled “Batch actions”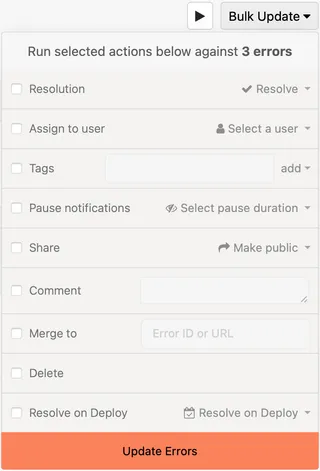
You can use the Bulk Update dropdown to update multiple errors simultaneously. You can apply actions to all search results (this is the default), or you can use the checkboxes in the error list to apply the actions to selected errors.
- Use the search to select which errors you’d like change.
- Click on “Actions” and select one or more options from the drop-down.
Merging by batch
Section titled “Merging by batch”You can merge two or more errors to create a single error. There are two ways to merge errors:
- Click the Merge button in the Actions panel on the error detail page, as described above.
- Select two or more errors to merge from the error index page using the checkboxes and use the “Merge to” action in the Bulk Update dropdown.
Note: The Bulk Update method can merge up to ten thousand error occurrences simultaneously. You can perform multiple updates if necessary.
Local edits
Section titled “Local edits”One of the advanced features in Honeybadger is configuring your local editor settings so that we can display links to open files locally when showing you an error backtrace:
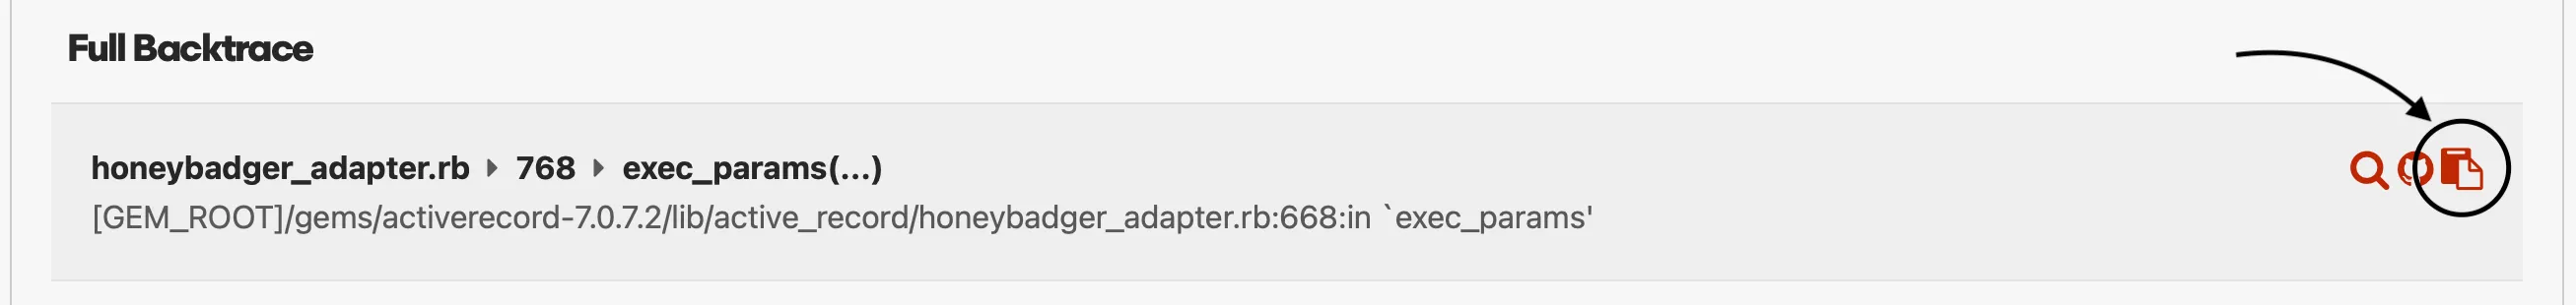
To configure your editor, visit the Local Editor tab under My Settings. Select the editor you use (if you use a different editor that supports opening files via a custom protocol, let us know about it). Next, enter the absolute path to each project you wish to enable local editor links for and click “Save” at the bottom. Re-visit your error pages - they should now have the “Open in editor” links!
Most editors work without any additional setup, but Sublime and Visual Studio Code don’t ship with a custom protocol by default. In order to make them work, you’ll need to install one of these libraries:
If you’re using Atom, make sure you’re on version 1.23 or later for this to work.
Disclaimer: We do not endorse nor support these libraries; they are 3rd party open source software.
Content Security Policy reports
Section titled “Content Security Policy reports”If you use Content Security Policy (CSP) headers to help mitigate XSS
attacks, you can use Honeybadger to track policy violations. You can configure
the required headers via code when using Rails or
Sinatra, or you can configure your web server or framework to
emit the headers. Either way, configuring CSP reporting requires specifying the
report-uri directive:
Content-Security-Policy: ...; report-uri https://api.honeybadger.io/v1/browser/csp?api_key=PROJECT_API_KEY&env=productionContent-Security-Policy-Report-Only: ...; report-uri https://api.honeybadger.io/v1/browser/csp?api_key=PROJECT_API_KEY&report_only=true&env=productionThe env and report_only parameters are optional. When report_only is true,
CSP report payloads will show up as “CSP Report” in our UI; otherwise, the label
will be “CSP Error”.
Since CSP violations can be noisy, we strongly suggest you track them in a separate Honeybadger project.