Dashboards & APM
Dashboards let you collect your most important Honeybadger Insights charts and data in one place so you can see what’s happening with your app at a glance. Instead of running queries repeatedly or jumping between pages, dashboards give you a single view of your application’s health and performance, helping you spot trends and fix issues.
Getting started
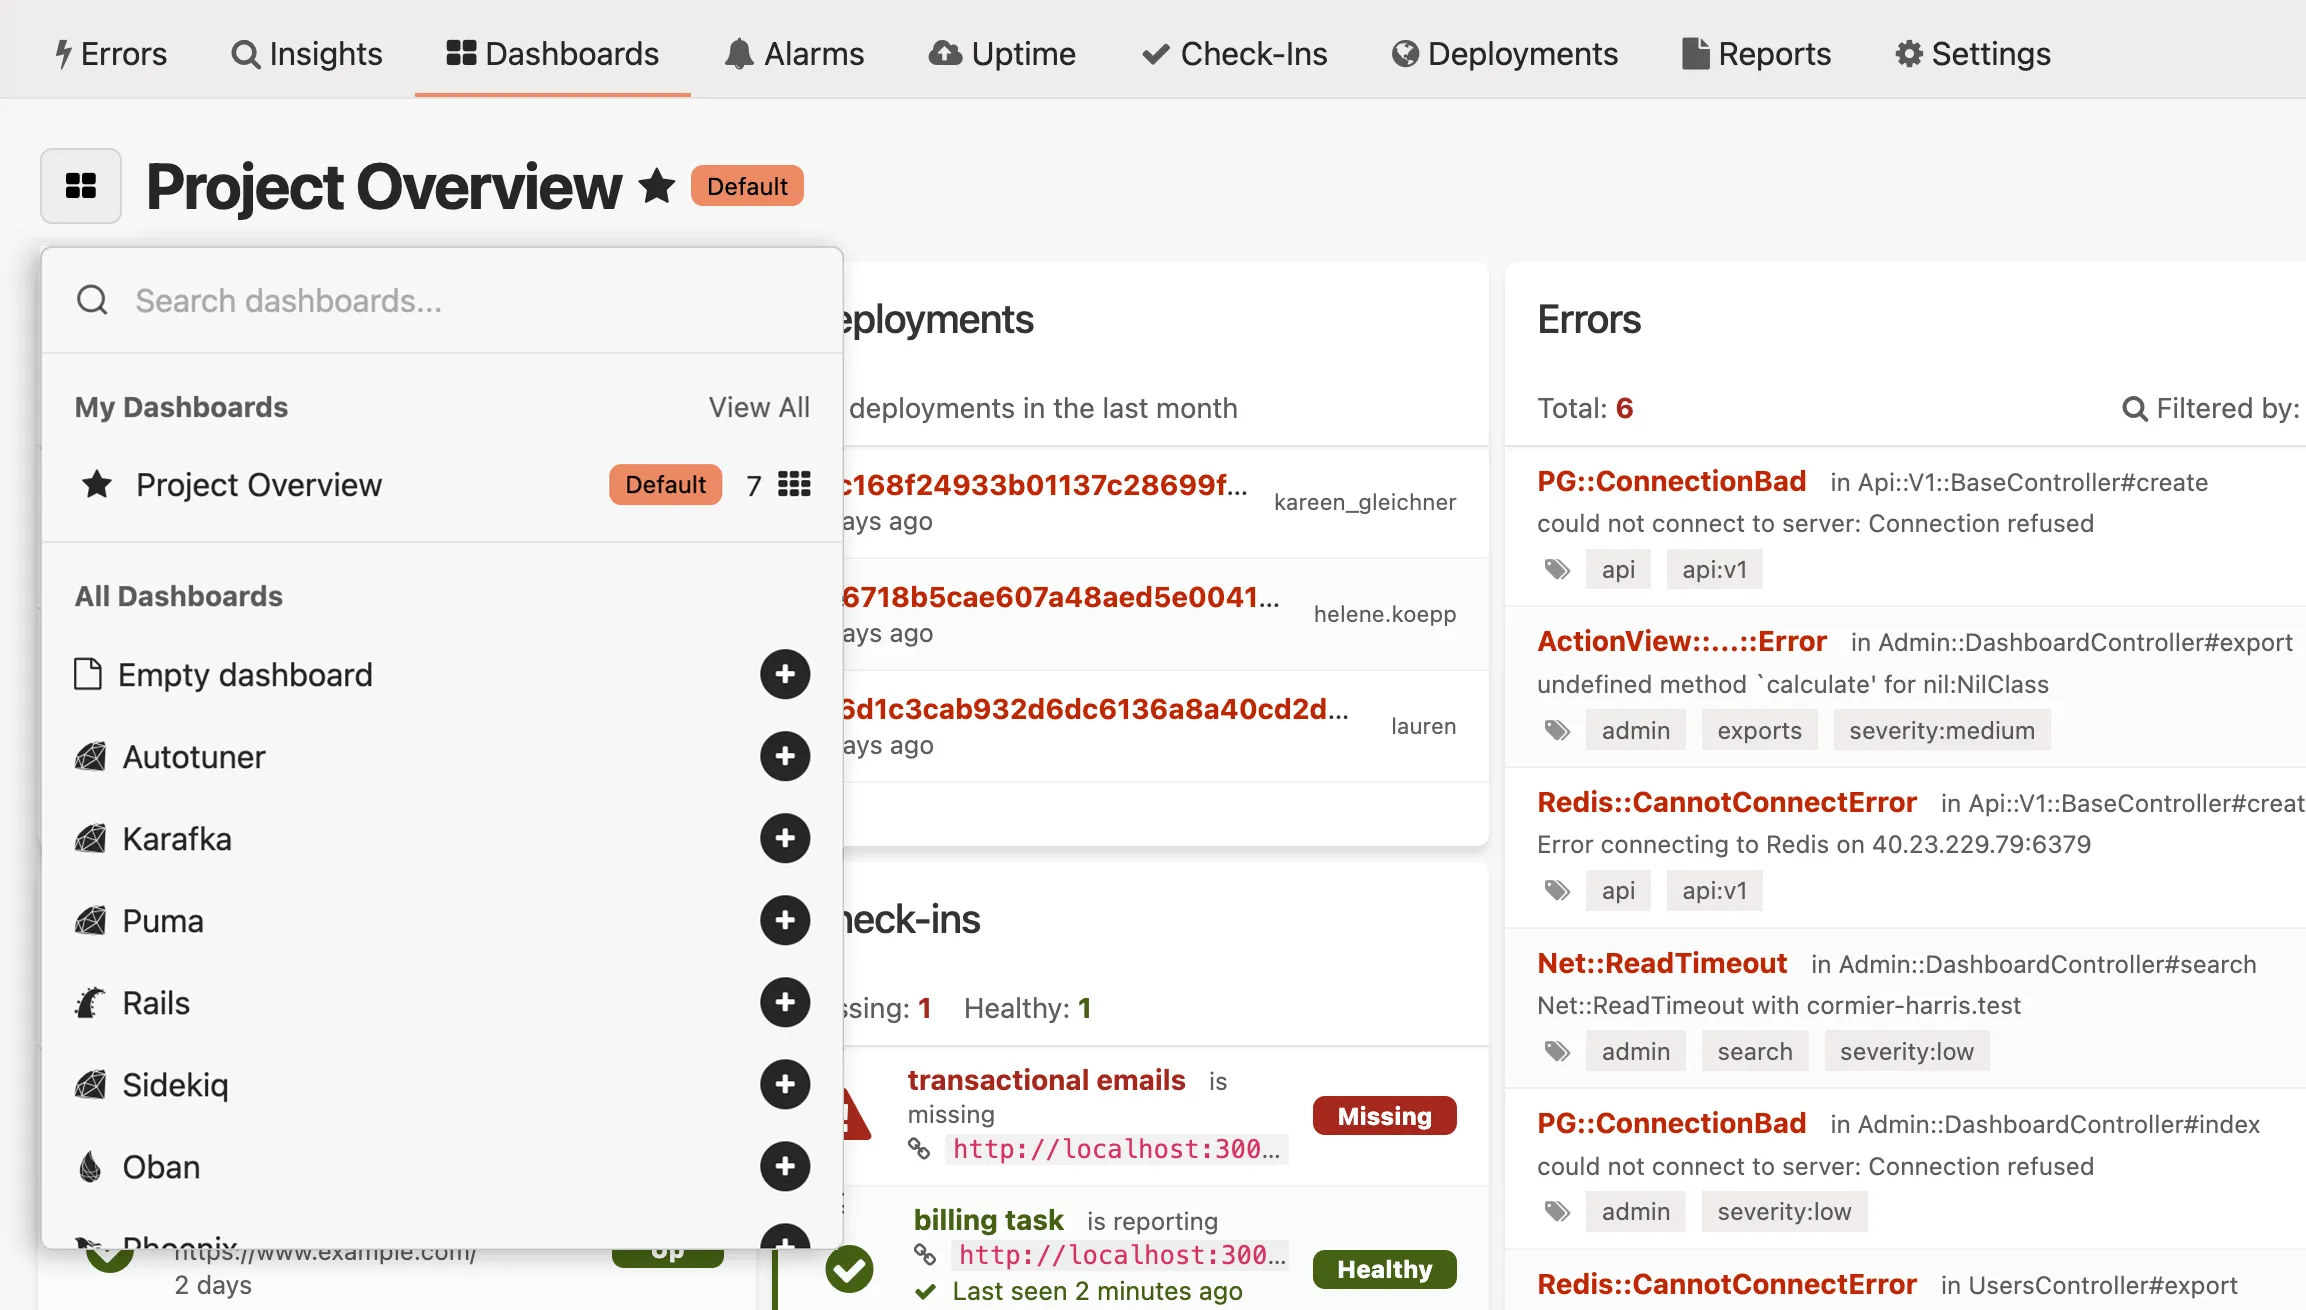
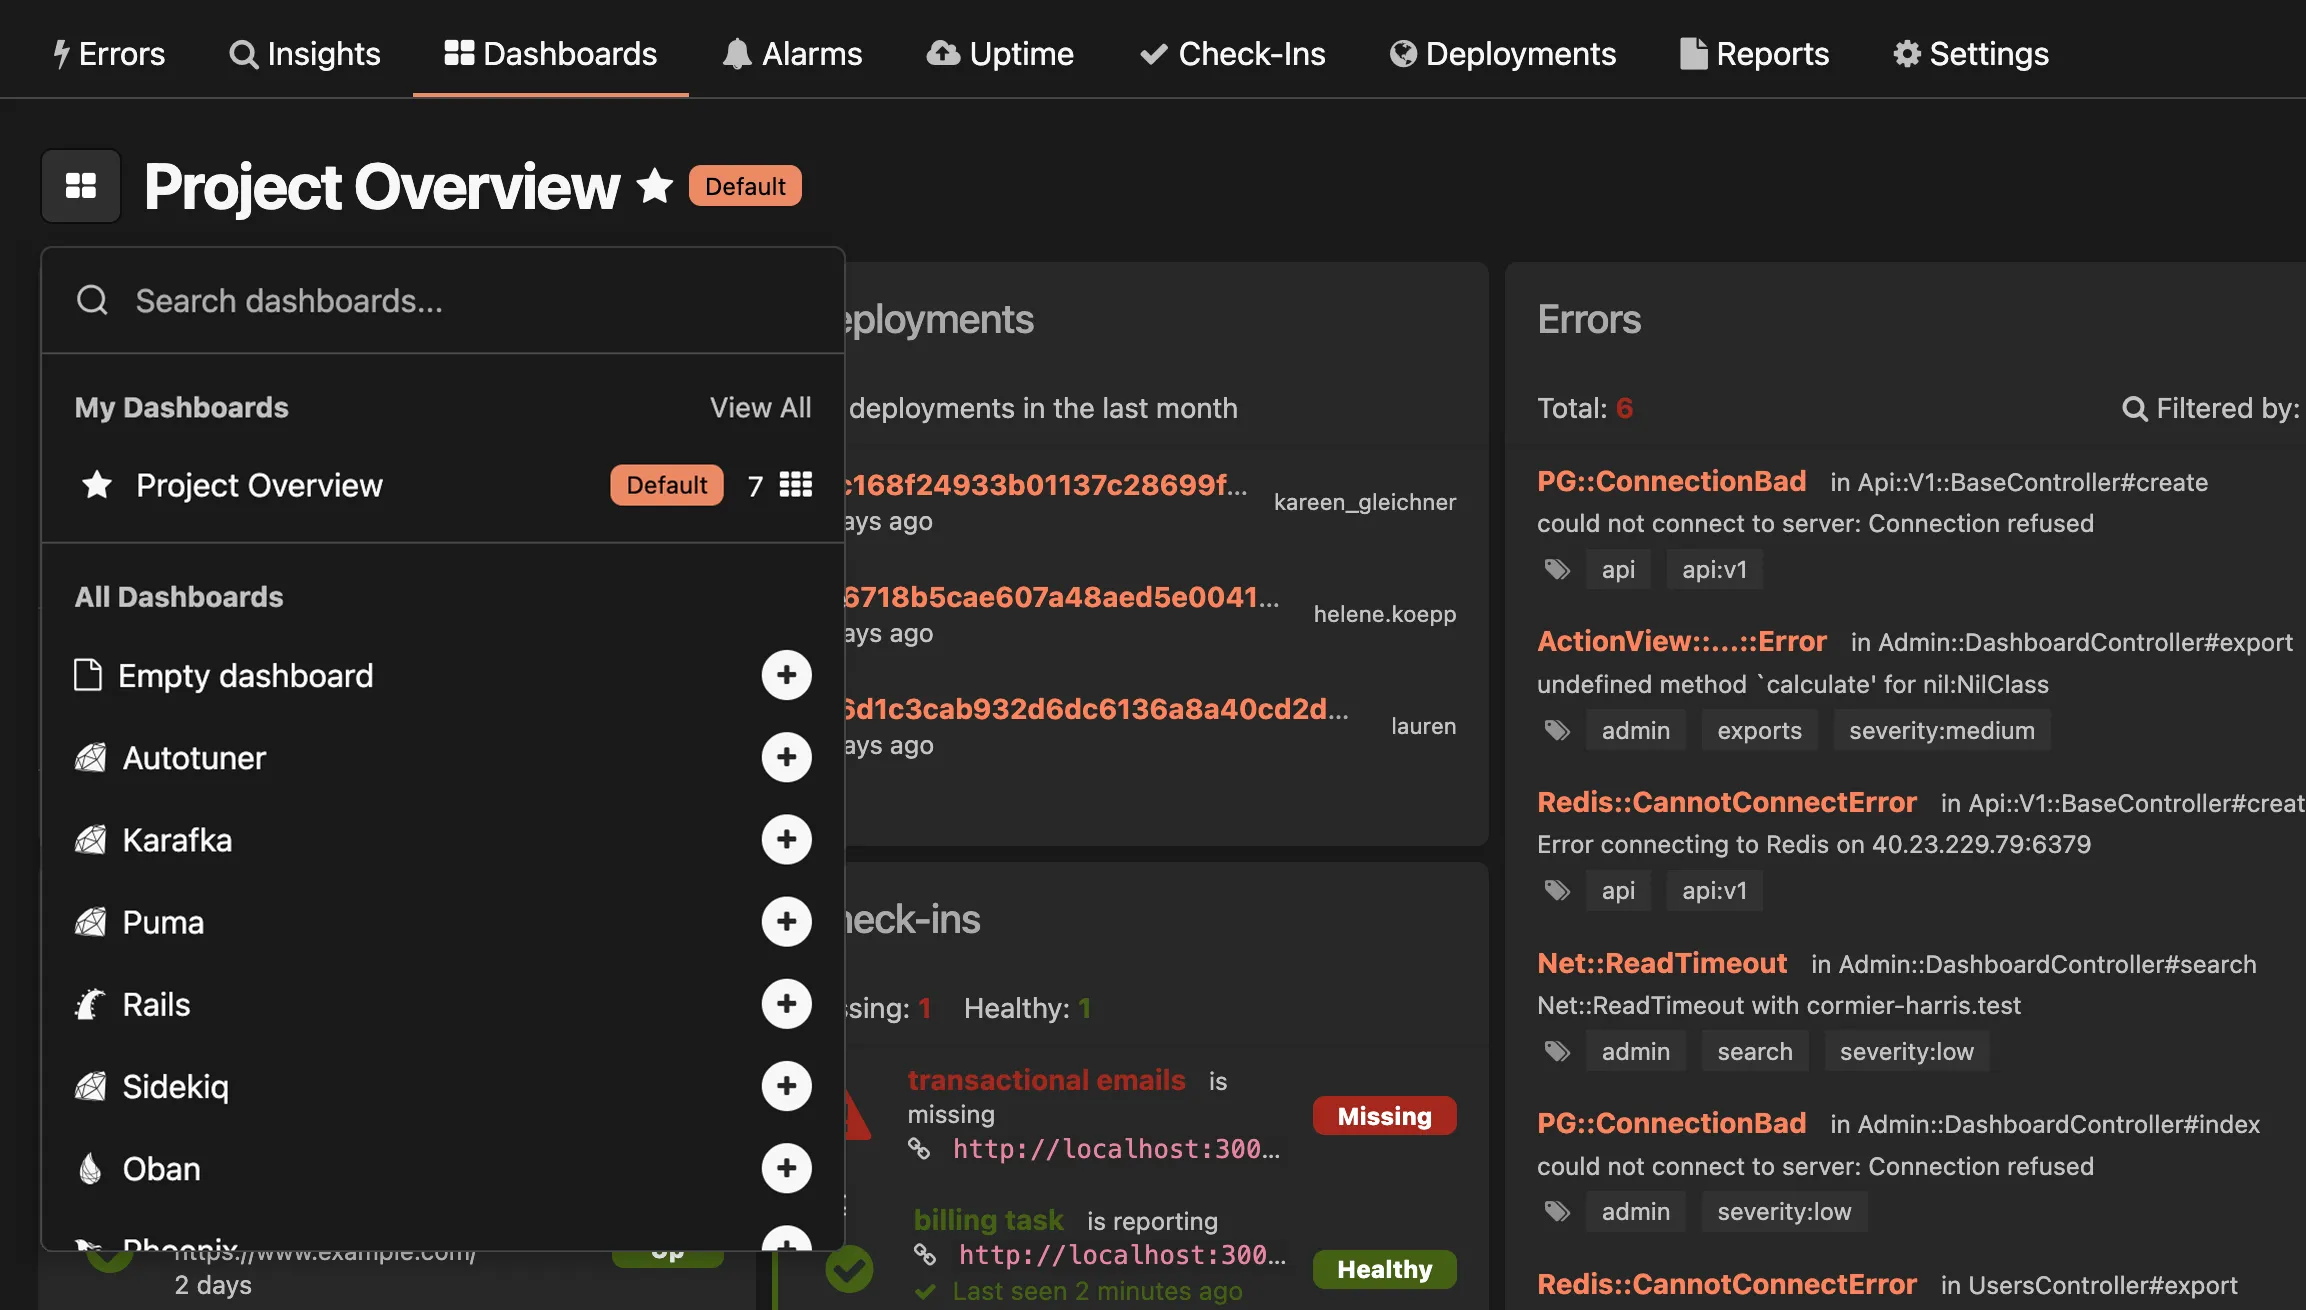
Section titled “Getting started”To create a dashboard, navigate to the Dashboards section in your Honeybadger project, click the dashboard selector in the top left, then click the + button next to the dashboard you want to add.
Project Overview dashboard
Section titled “Project Overview dashboard”The Project Overview dashboard provides a comprehensive view of your application’s health and performance. It’s automatically added to every new Honeybadger project, giving you immediate visibility into alarms, deployments, errors, uptime checks, and check-ins.
Automatic dashboards
Section titled “Automatic dashboards”To help you get started quickly, Honeybadger provides pre-configured automatic dashboards with relevant widgets for common frameworks and platforms. These dashboards are automatically populated when you enable instrumentation for supported platforms.
Getting started with automatic dashboards
Section titled “Getting started with automatic dashboards”To enable automatic dashboards for your applications, follow these steps:
- Enable Honeybadger Insights instrumentation in your client library (e.g., Ruby, Elixir, PHP, etc.)
- Deploy your application with the updated configuration
- Navigate to the Dashboards section in your Honeybadger project, click Create dashboard, select the dashboard you want, then click Add dashboard.
Your dashboard will begin to populate with data as soon as your application starts sending events to Honeybadger.
Customizing dashboards
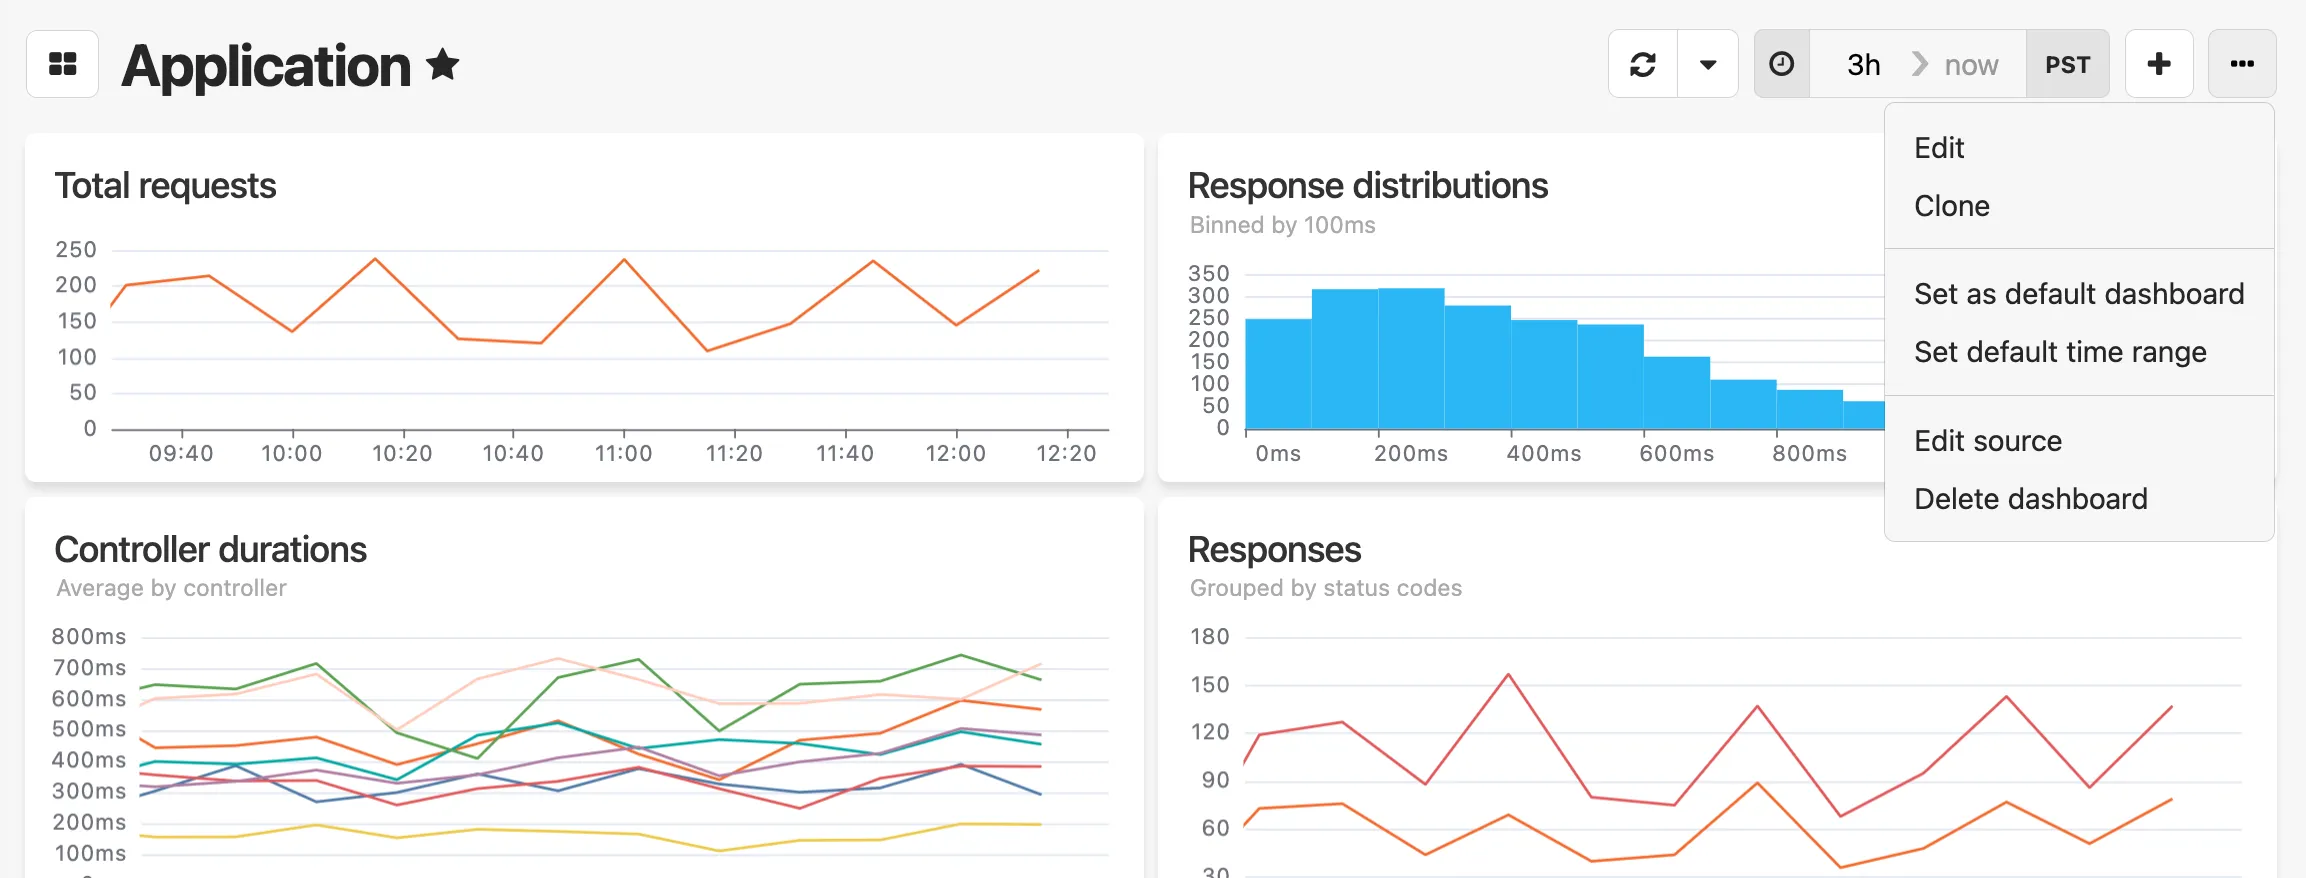
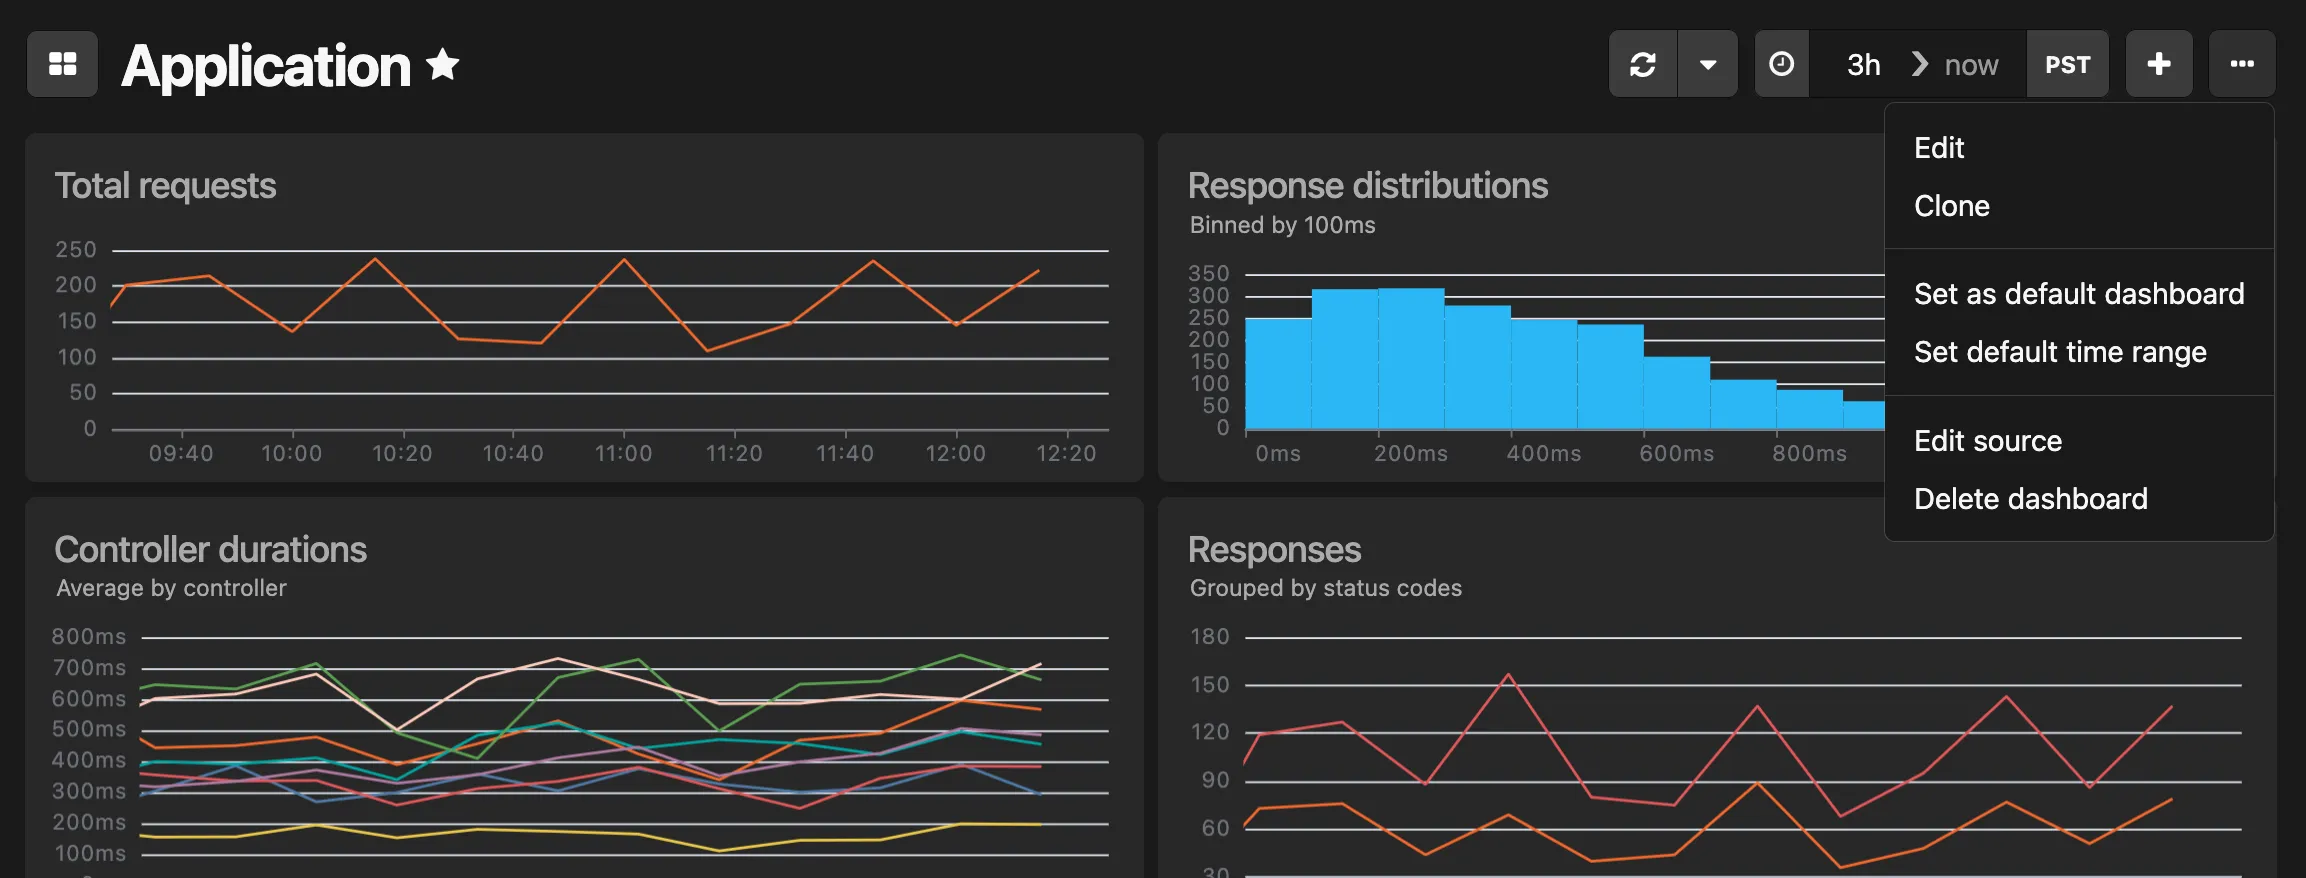
Section titled “Customizing dashboards”You can customize any dashboard by clicking the … menu in the top right corner of the dashboard. From there, you can:
- Edit - Modify the dashboard layout and widgets
- Clone - Create a copy of the dashboard
- Set as default dashboard - Make this dashboard your default view
- Set default time range - Configure the default time period
- Edit source - View and edit the dashboard’s YAML configuration
- Delete dashboard - Remove the dashboard
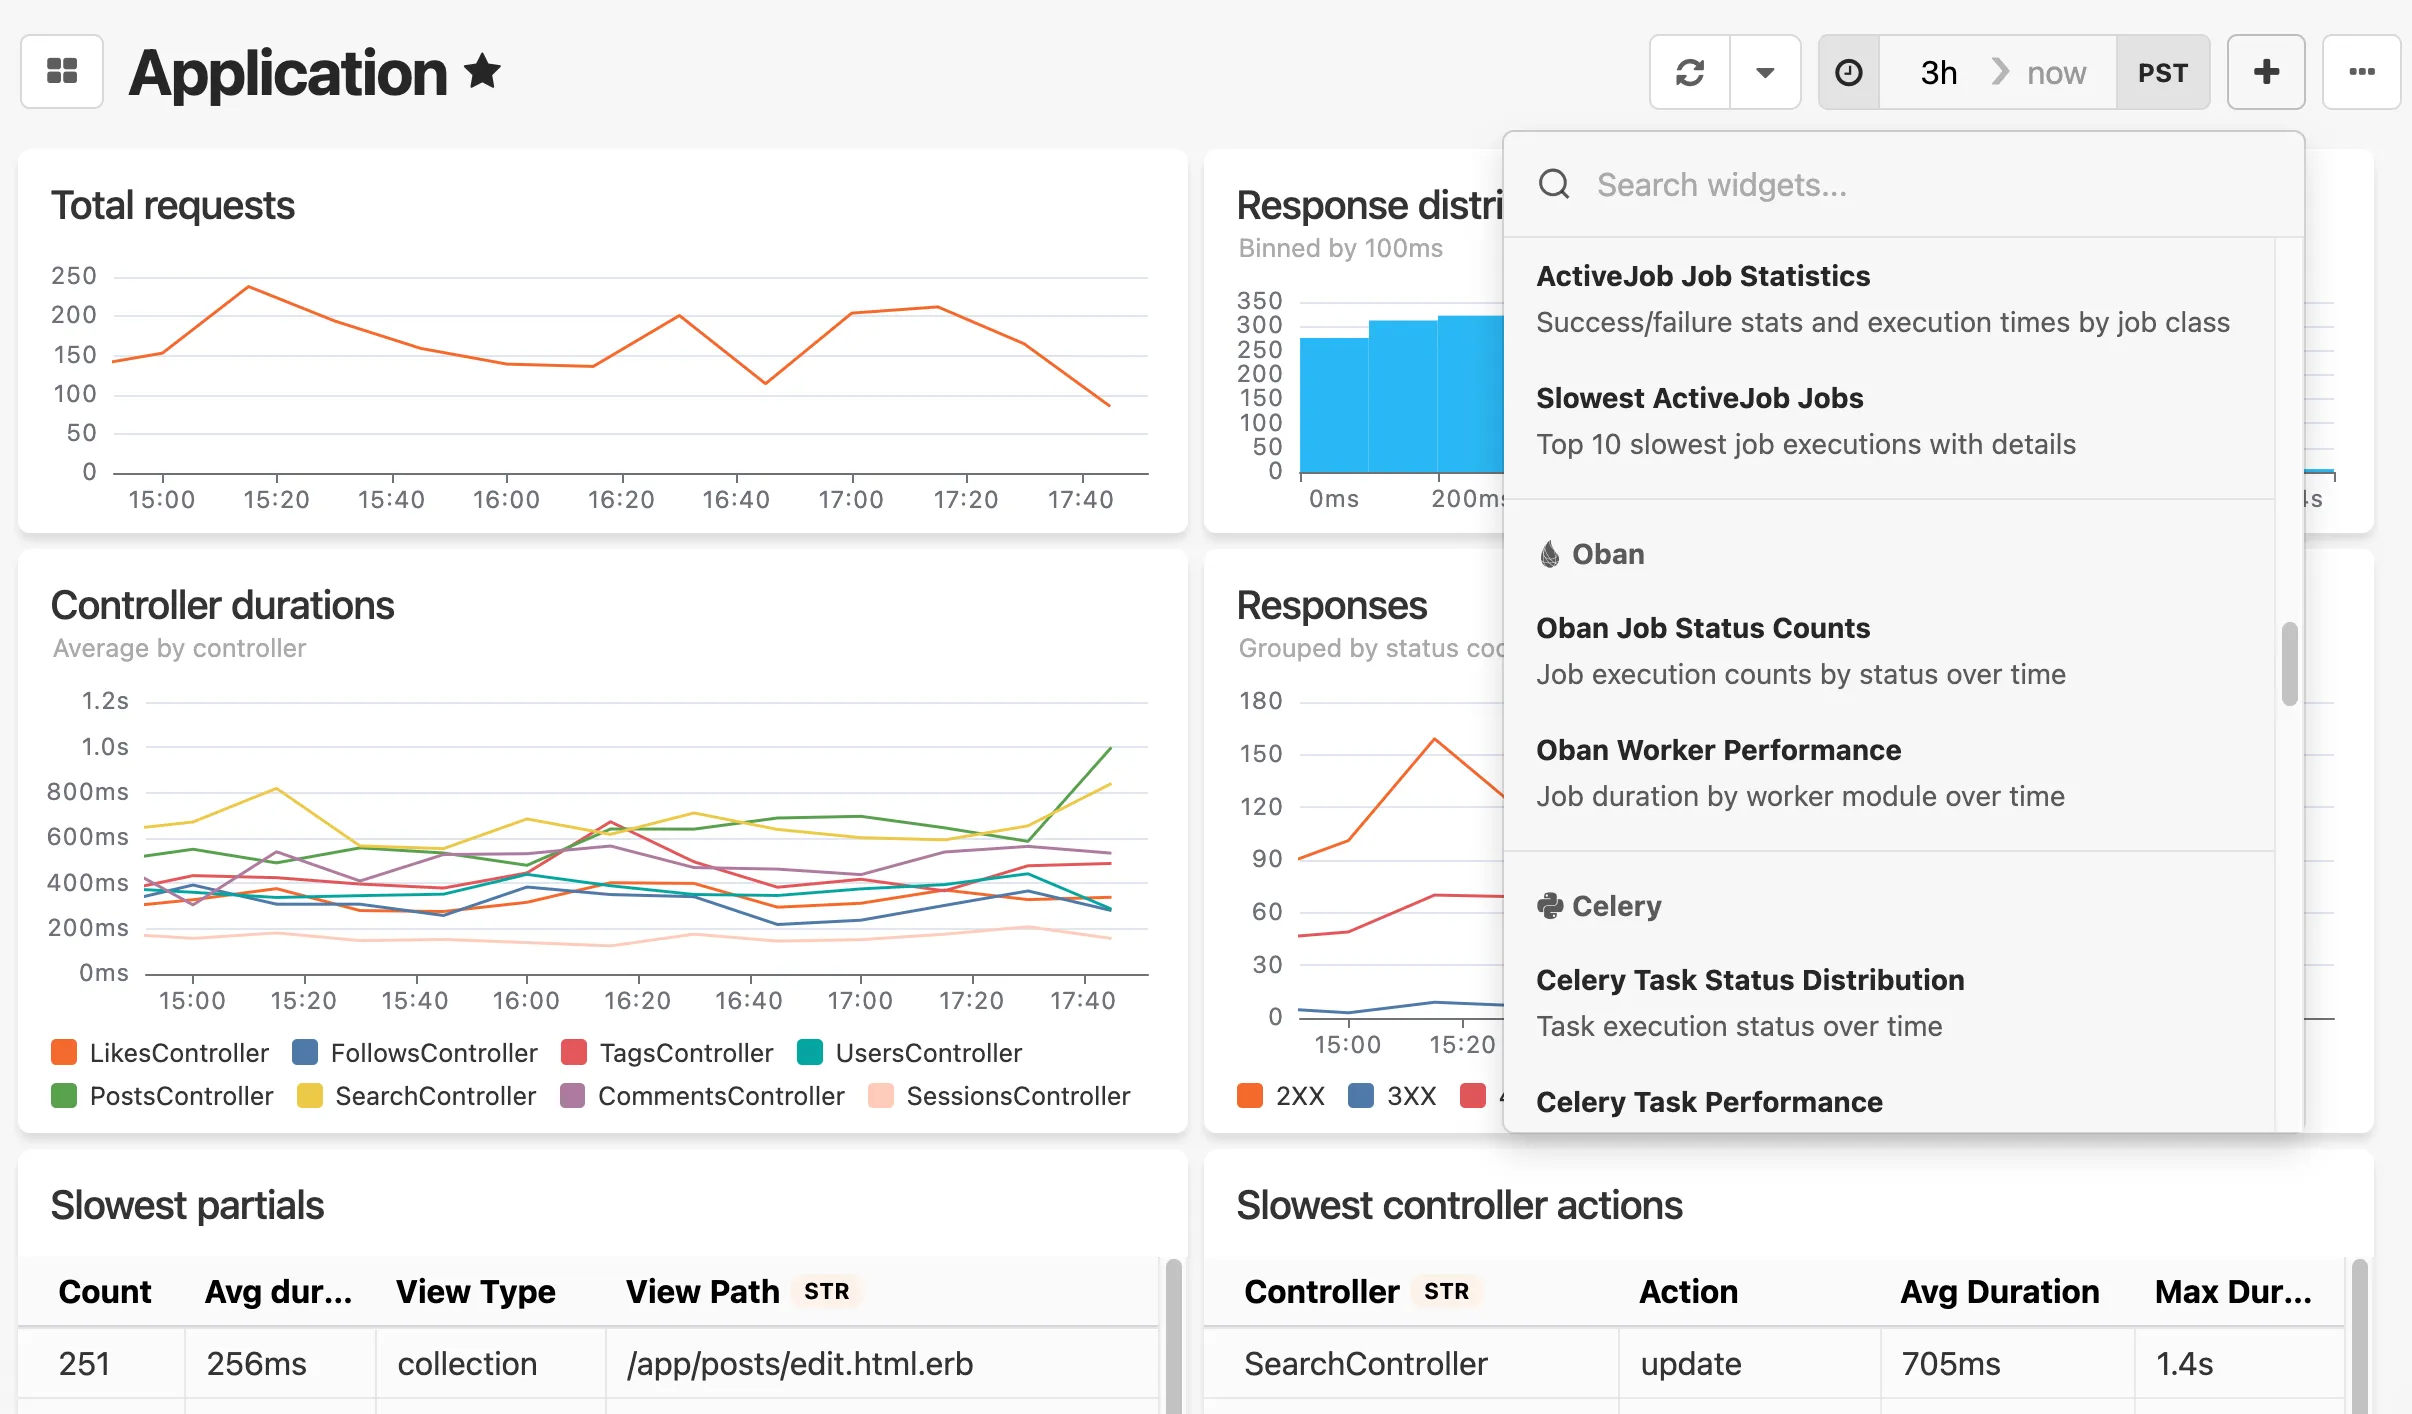
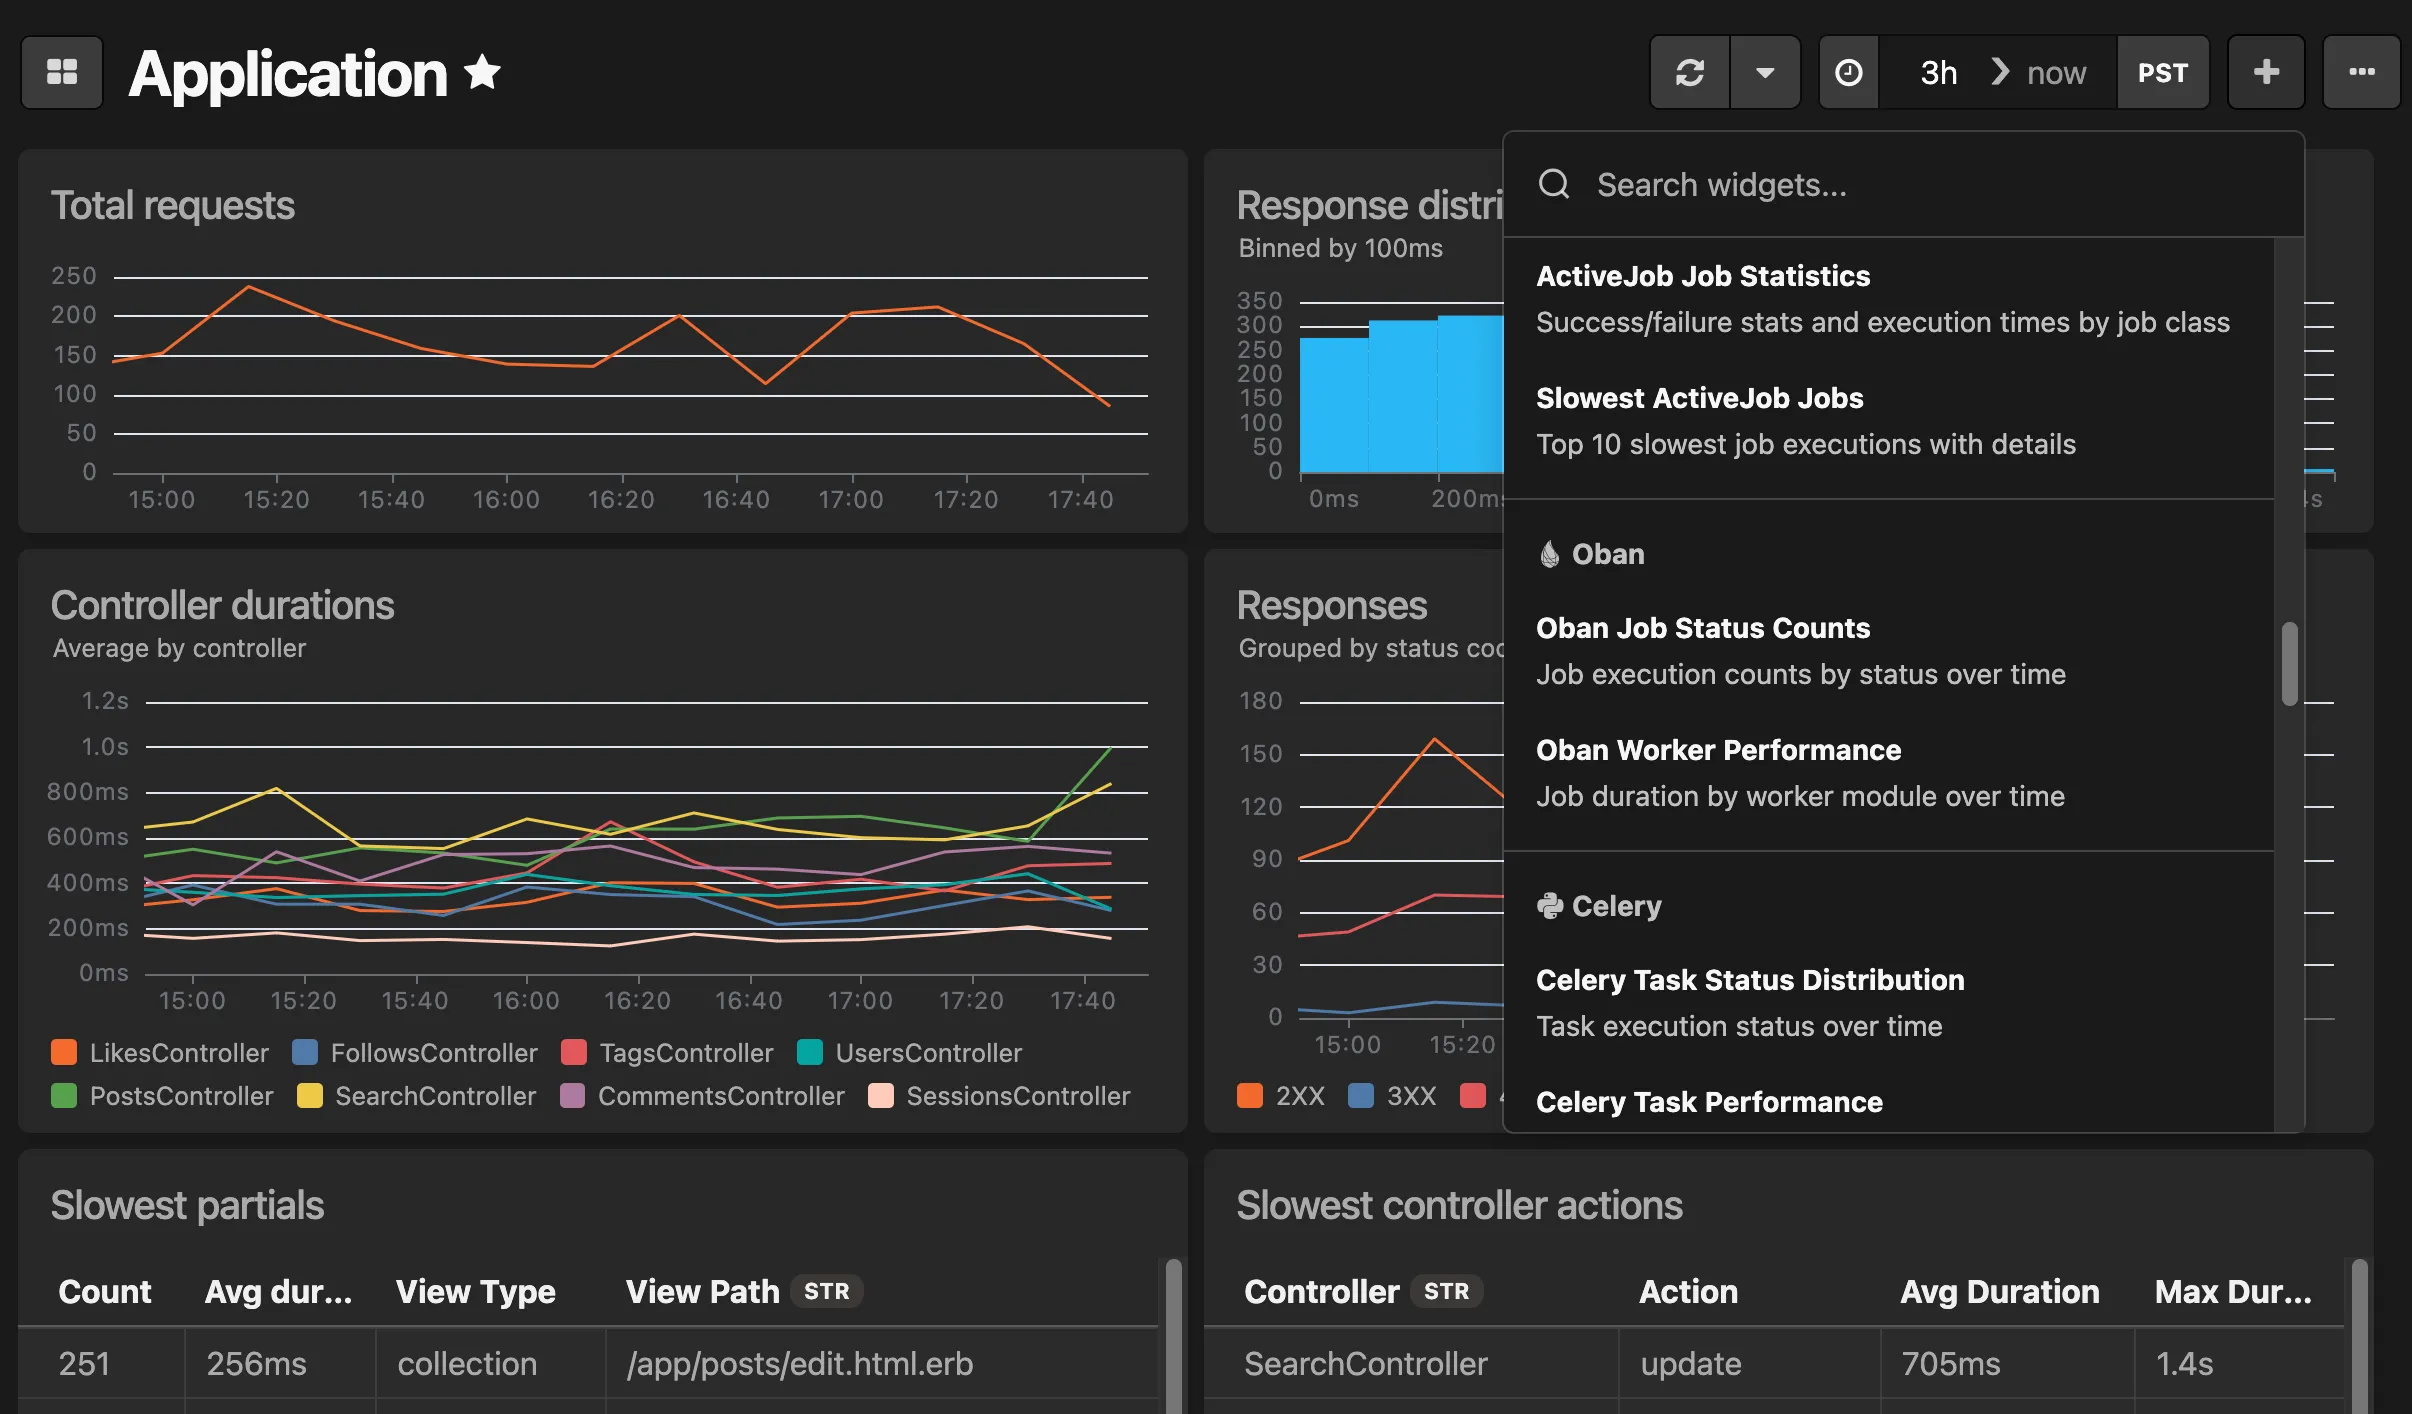
Widget library
Section titled “Widget library”When adding new widgets to a dashboard, you can choose from a library of pre-configured widget templates. The widget library includes templates for common data sources such as:
- Error rates and deployments
- Database performance metrics
- Background job processing times
- Request counts and response distributions
- Cache hit rates
To add a widget from the library, click the + Add widget menu in the top right corner of the dashboard and select a template. You can customize any widget after adding it to your dashboard.
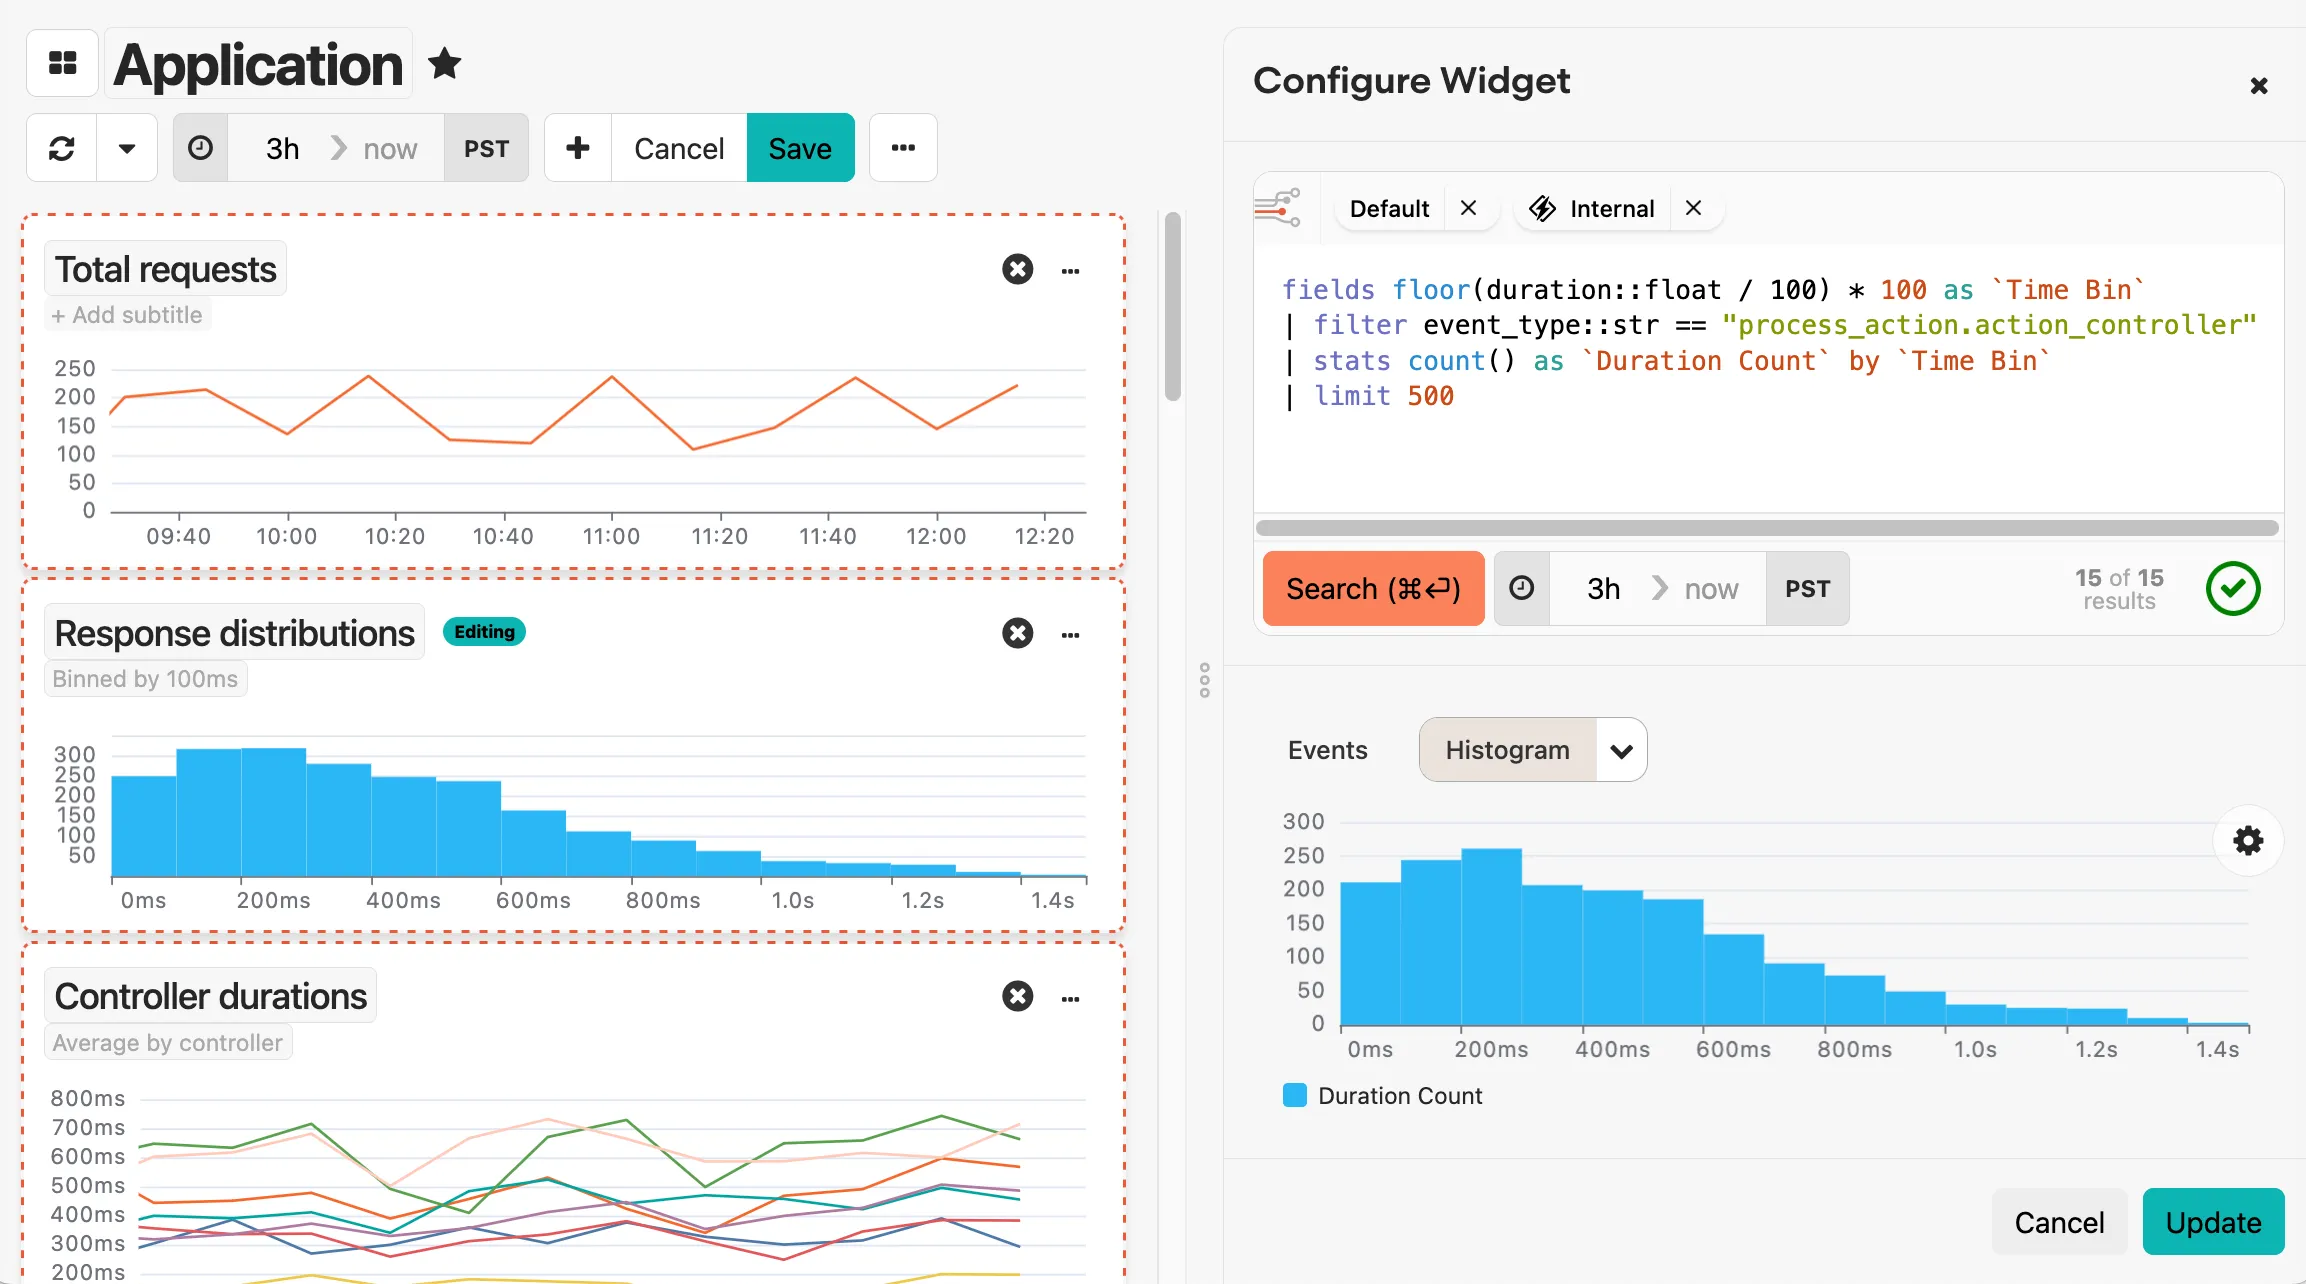
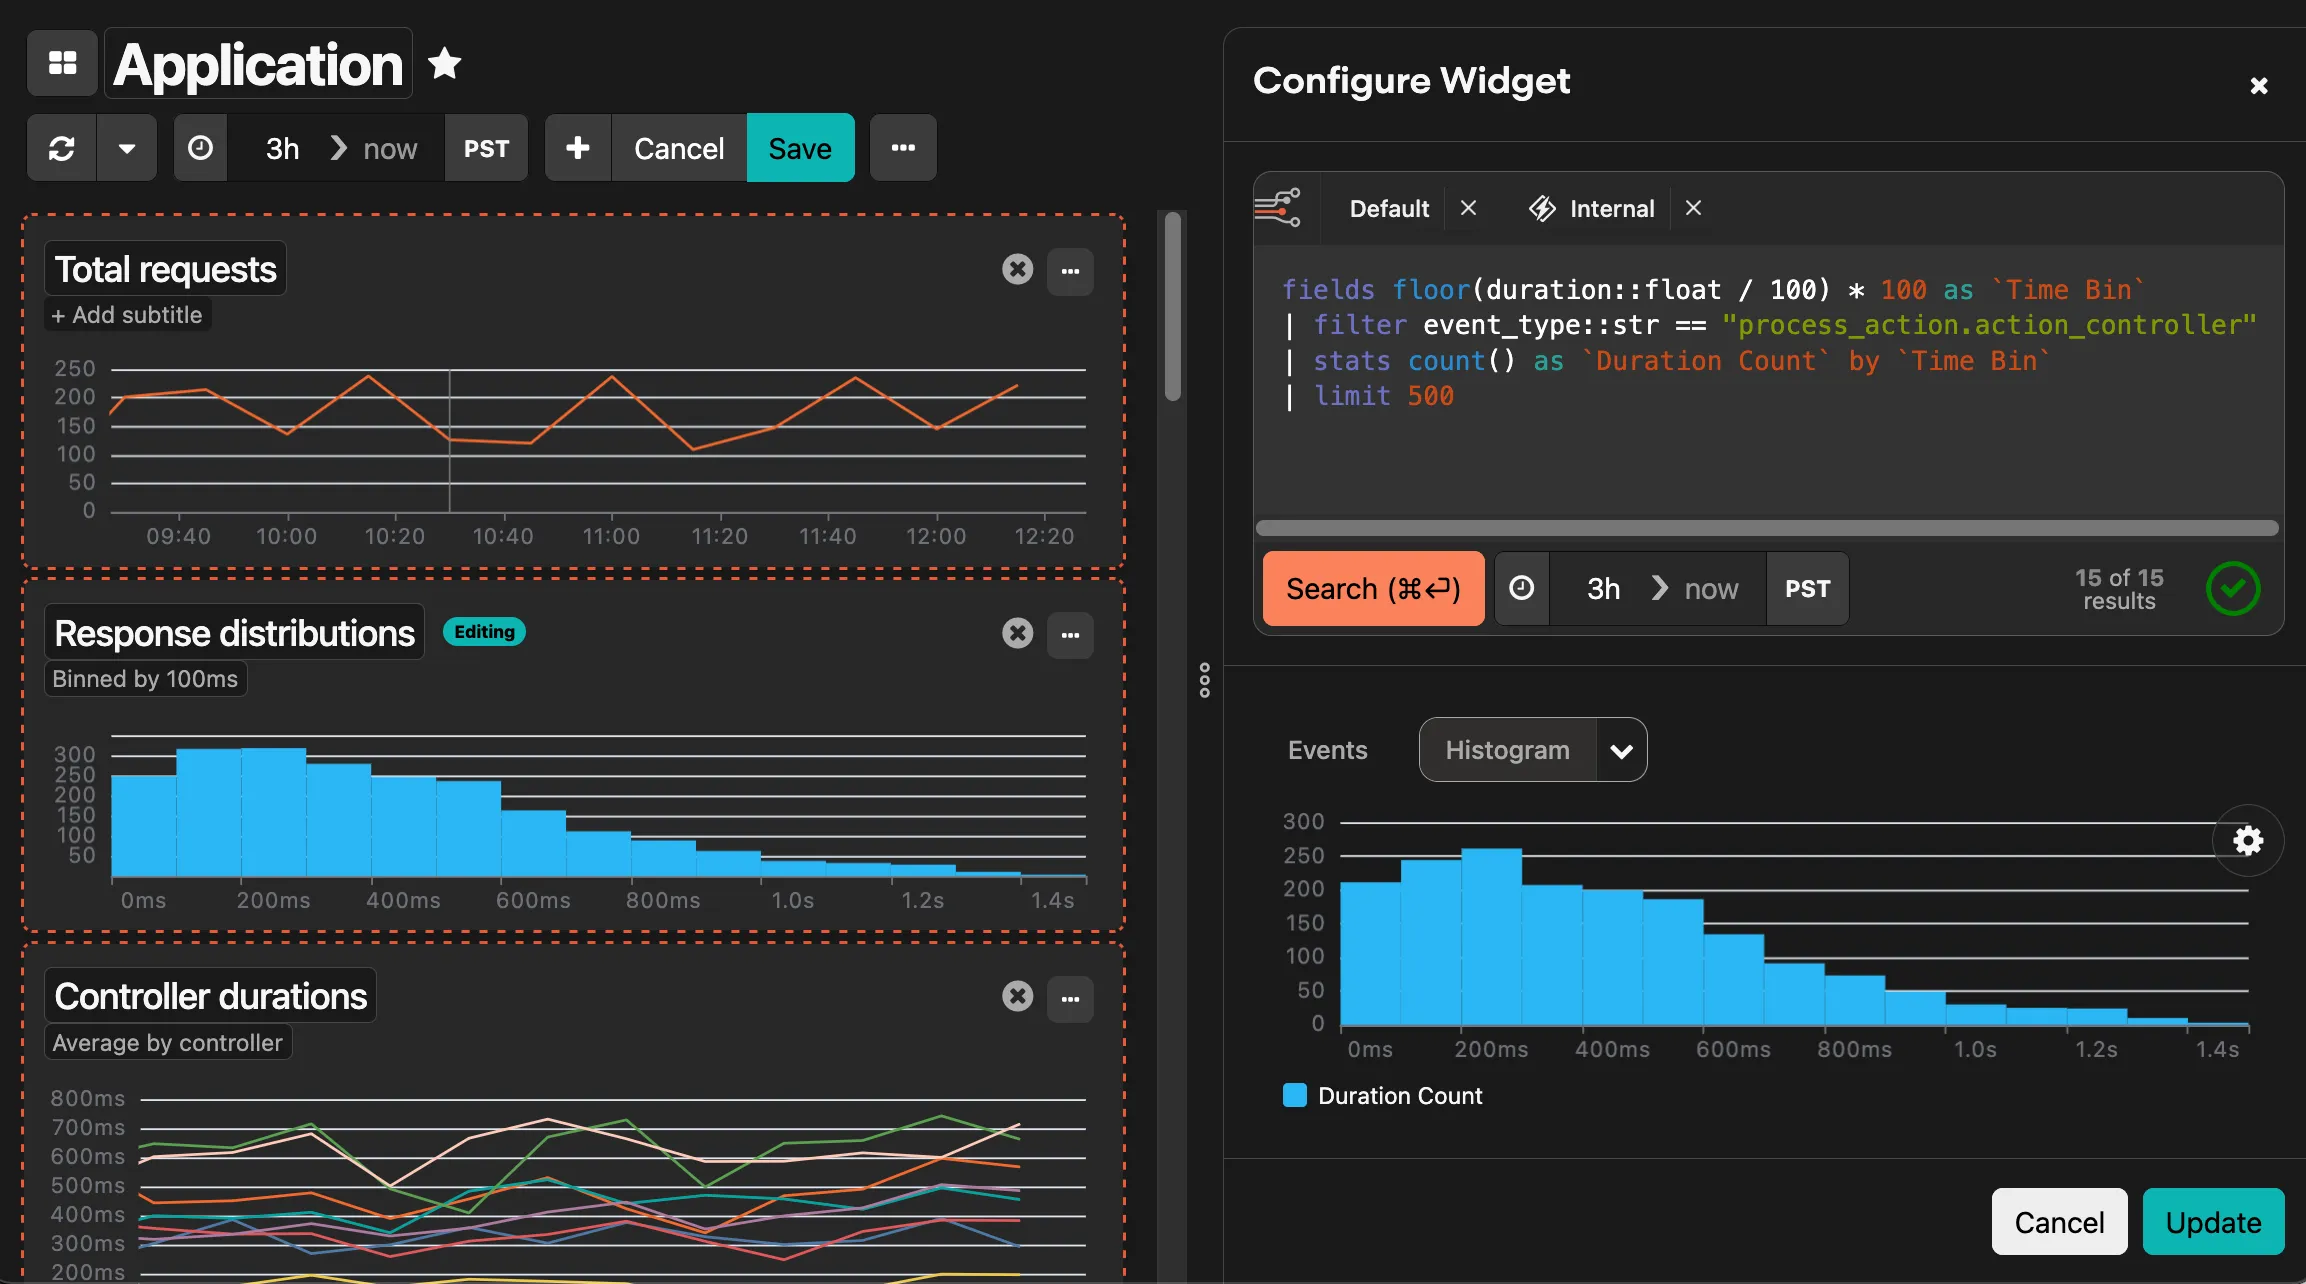
Editing widgets
Section titled “Editing widgets”In edit mode, you can configure any widget by clicking the … menu on the widget and selecting Edit widget. This opens the widget editor where you can modify the query, change the visualization type, and preview results before saving.
Parameterized queries
Section titled “Parameterized queries”You can make dashboard widgets dynamic by using parameters in your queries. Parameters let you create reusable dashboards where values can be changed via the URL or the Parameters button in the dashboard toolbar, without editing the widget configuration. For example, a single dashboard can be filtered to one host, environment, or customer at a time — and shared as a prefilled link.
Adding a parameter to a widget
Section titled “Adding a parameter to a widget”To add a parameter to a dashboard widget:
- Open the dashboard and click Edit.
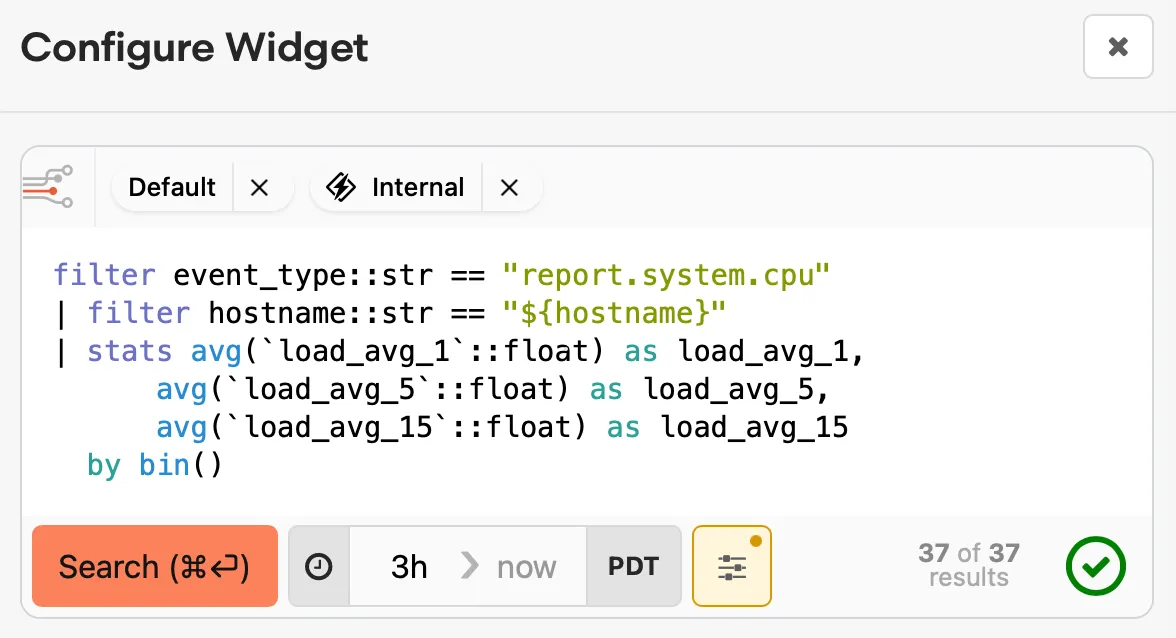
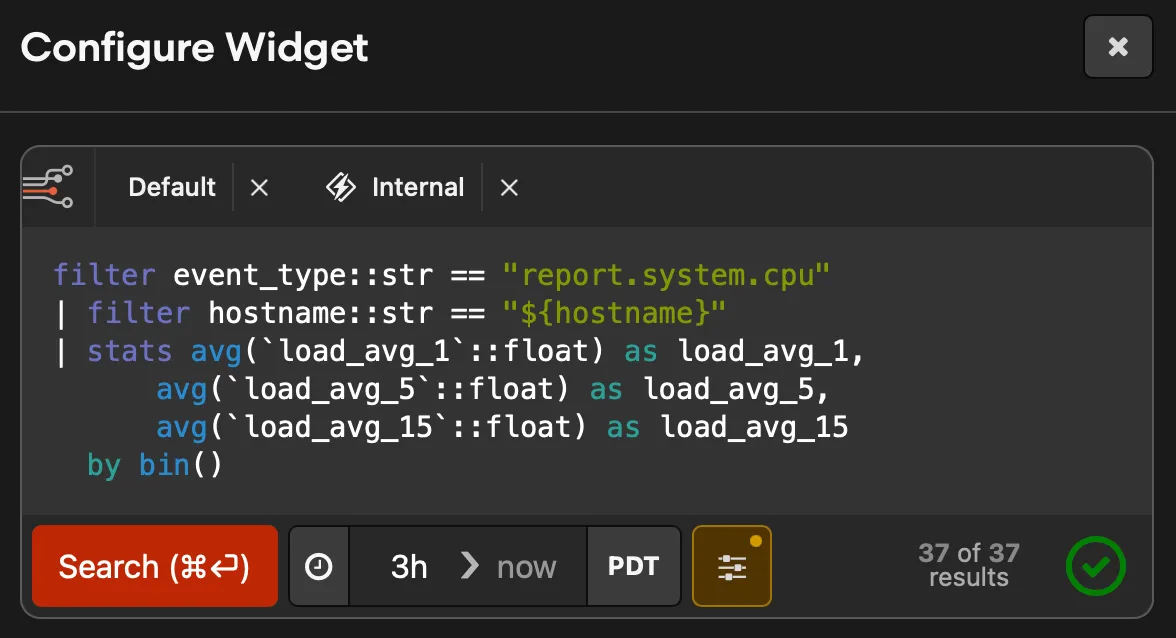
- Click the … menu on the widget and choose Edit widget.
- Add a reference like
${hostname}anywhere in the widget’s query — for example,filter hostname::str == "${hostname}". - When the editor prompts you, provide a value for the new parameter so the preview can render. Click Update to save the widget.
Once a parameter is defined, any widget on the dashboard that uses the same name will share the same value. To apply one parameter across several widgets, reference it from each widget’s query — either through the widget editor or by editing the dashboard source.
Setting parameter values
Section titled “Setting parameter values”There are three ways to set parameter values on a dashboard:
-
URL parameters — Add parameters directly to the URL (e.g.,
?hostname=web-01). Because parameters are URL-based, you can bookmark or share a link that already has the values filled in. -
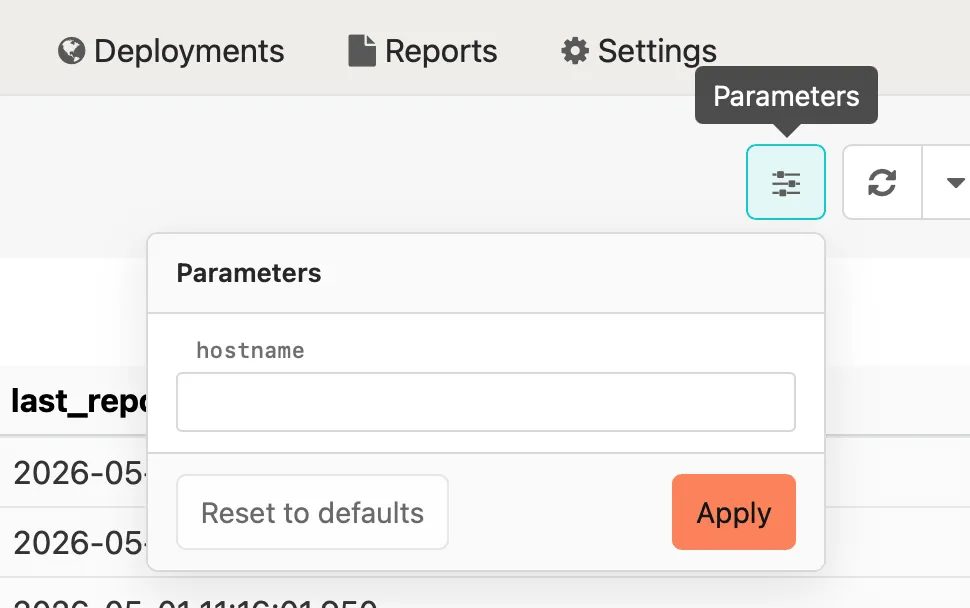
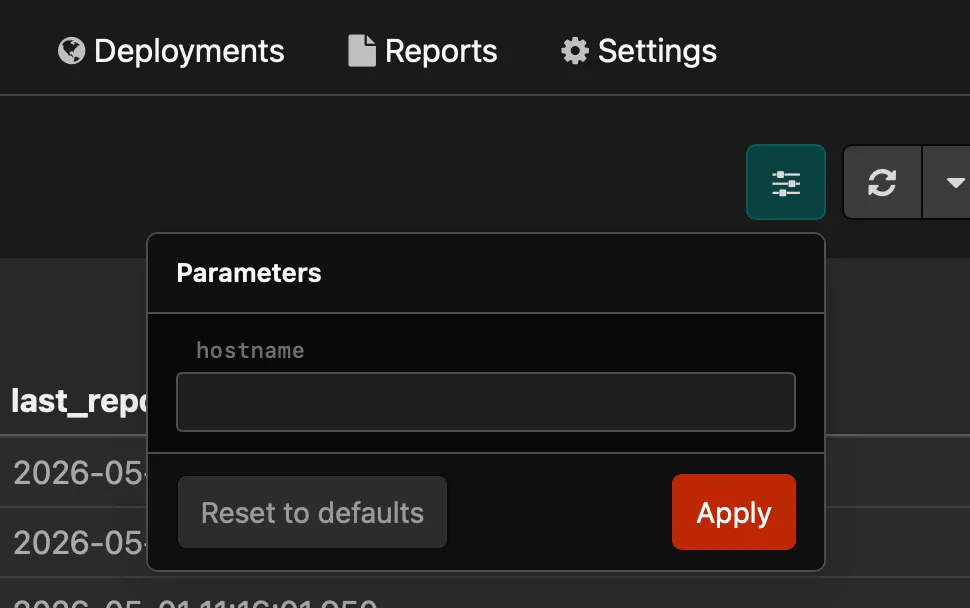
Parameters popover — Click the Parameters button (the slider icon in the dashboard toolbar, next to the date picker) to open a popover with a field for each parameter used on the dashboard. Enter values and click Apply, or click Reset to defaults to restore default values.
-
From widget results — Click a field value in a widget’s results. If the field name matches a parameter used on the dashboard, you’ll see a “set parameter” option that updates every widget using that parameter.
Default values
Section titled “Default values”Giving a parameter a default with ${name:-default} means the widget can
render even when no value has been supplied. Defaults are useful for:
- Setting a sensible baseline (e.g.,
${env:-production}) that viewers can override. - Ensuring a dashboard renders on first load before anyone has edited parameters.
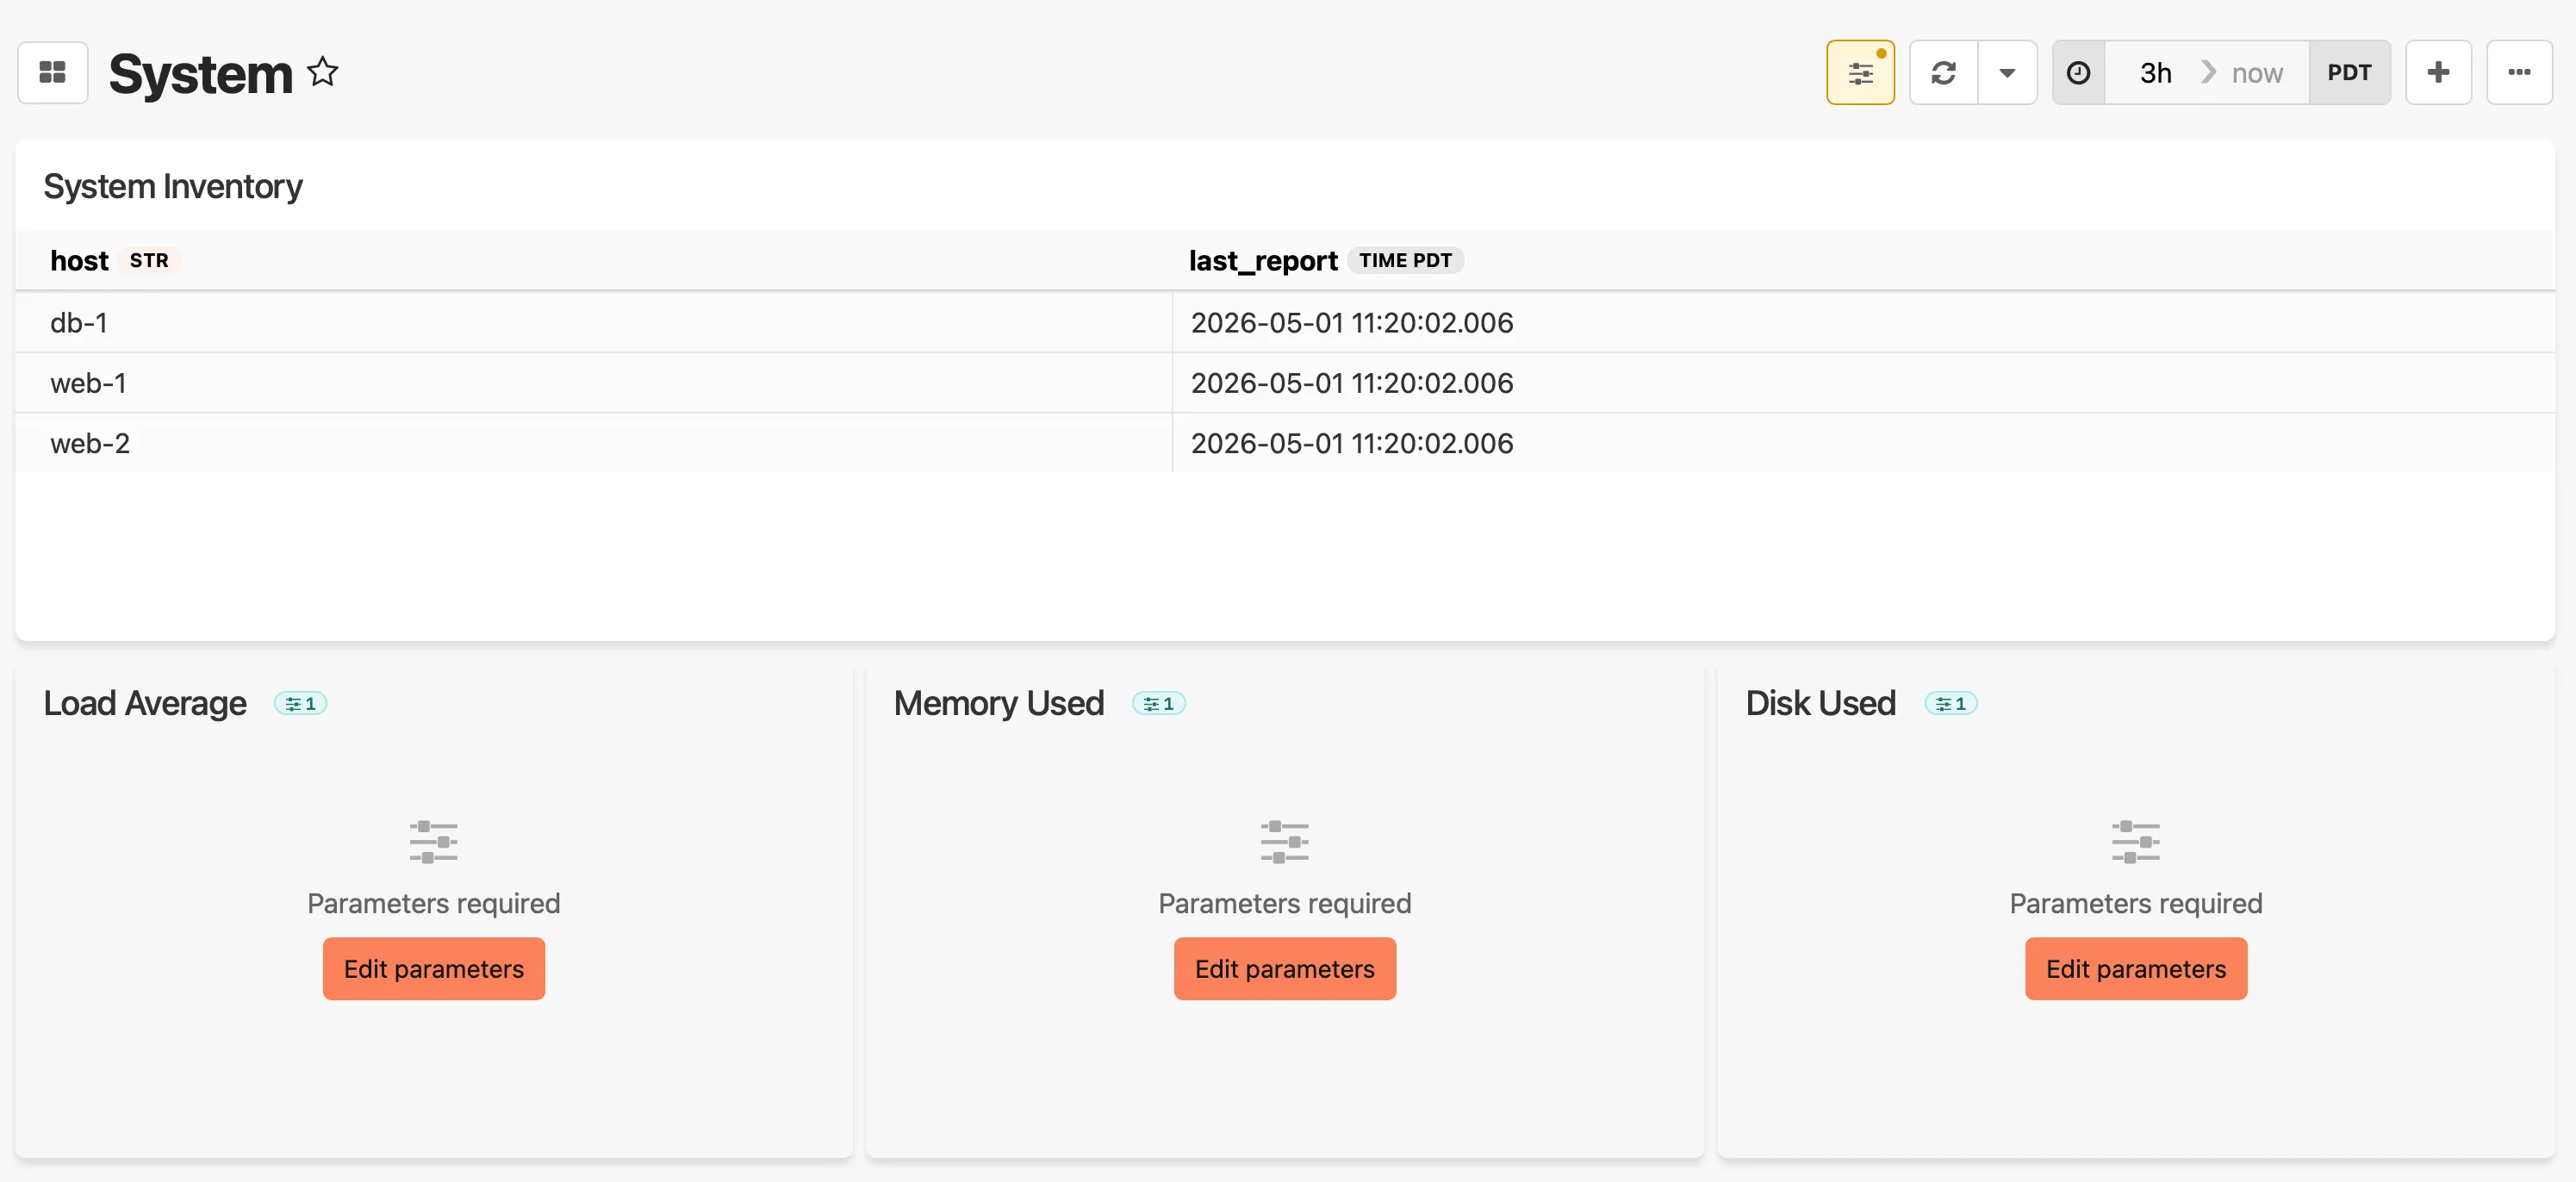
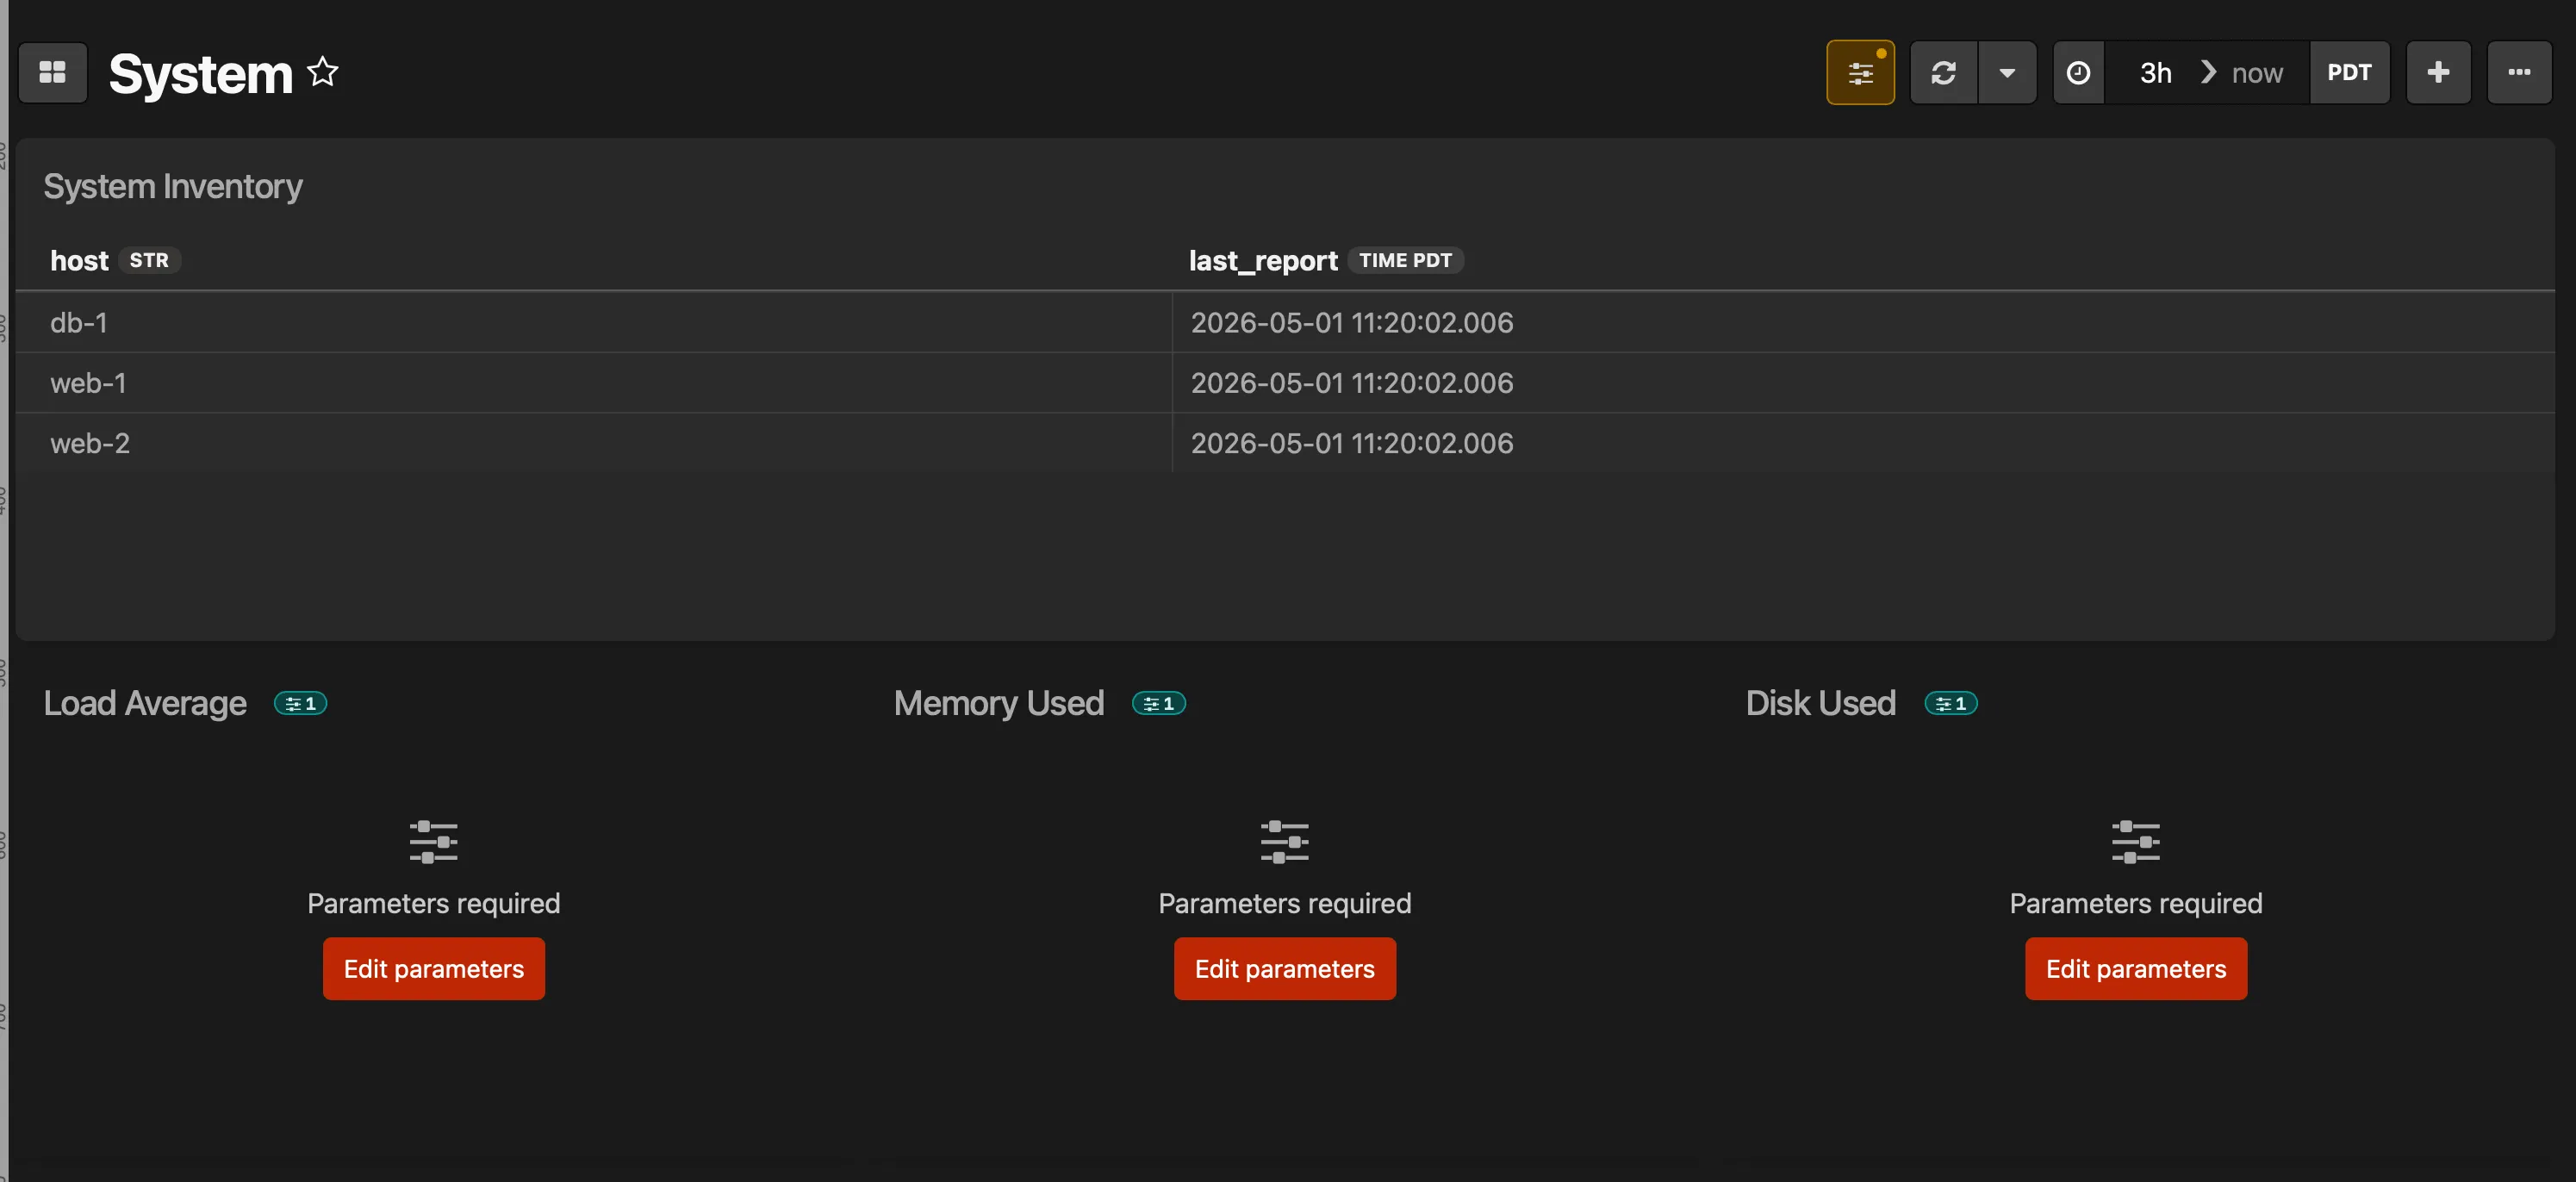
Parameters required state
Section titled “Parameters required state”When a widget references a parameter that has no default and no value has been supplied via the URL or the parameters popover, the widget displays a Parameters required message with an Edit parameters button. The Parameters button in the dashboard toolbar also shows an indicator dot, signaling that one or more values need to be set. Click either to open the parameters popover and supply the missing values.
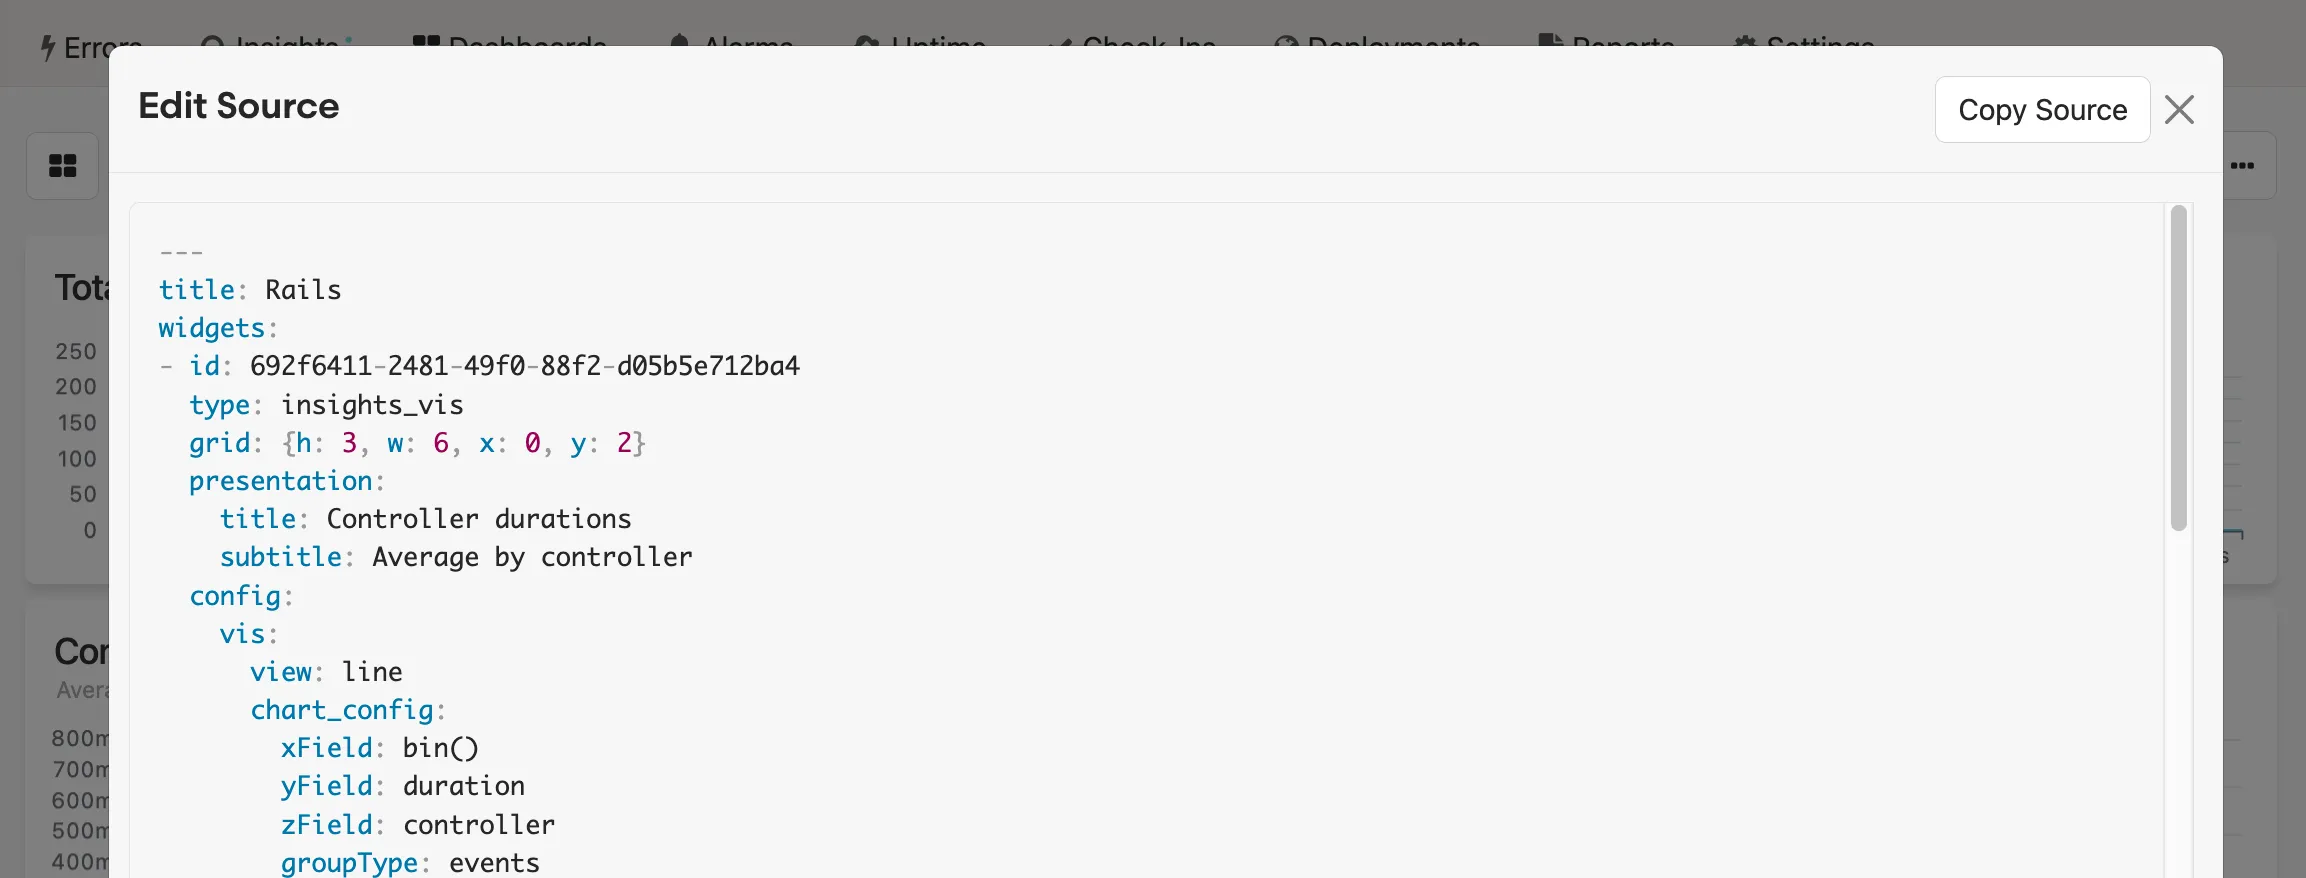
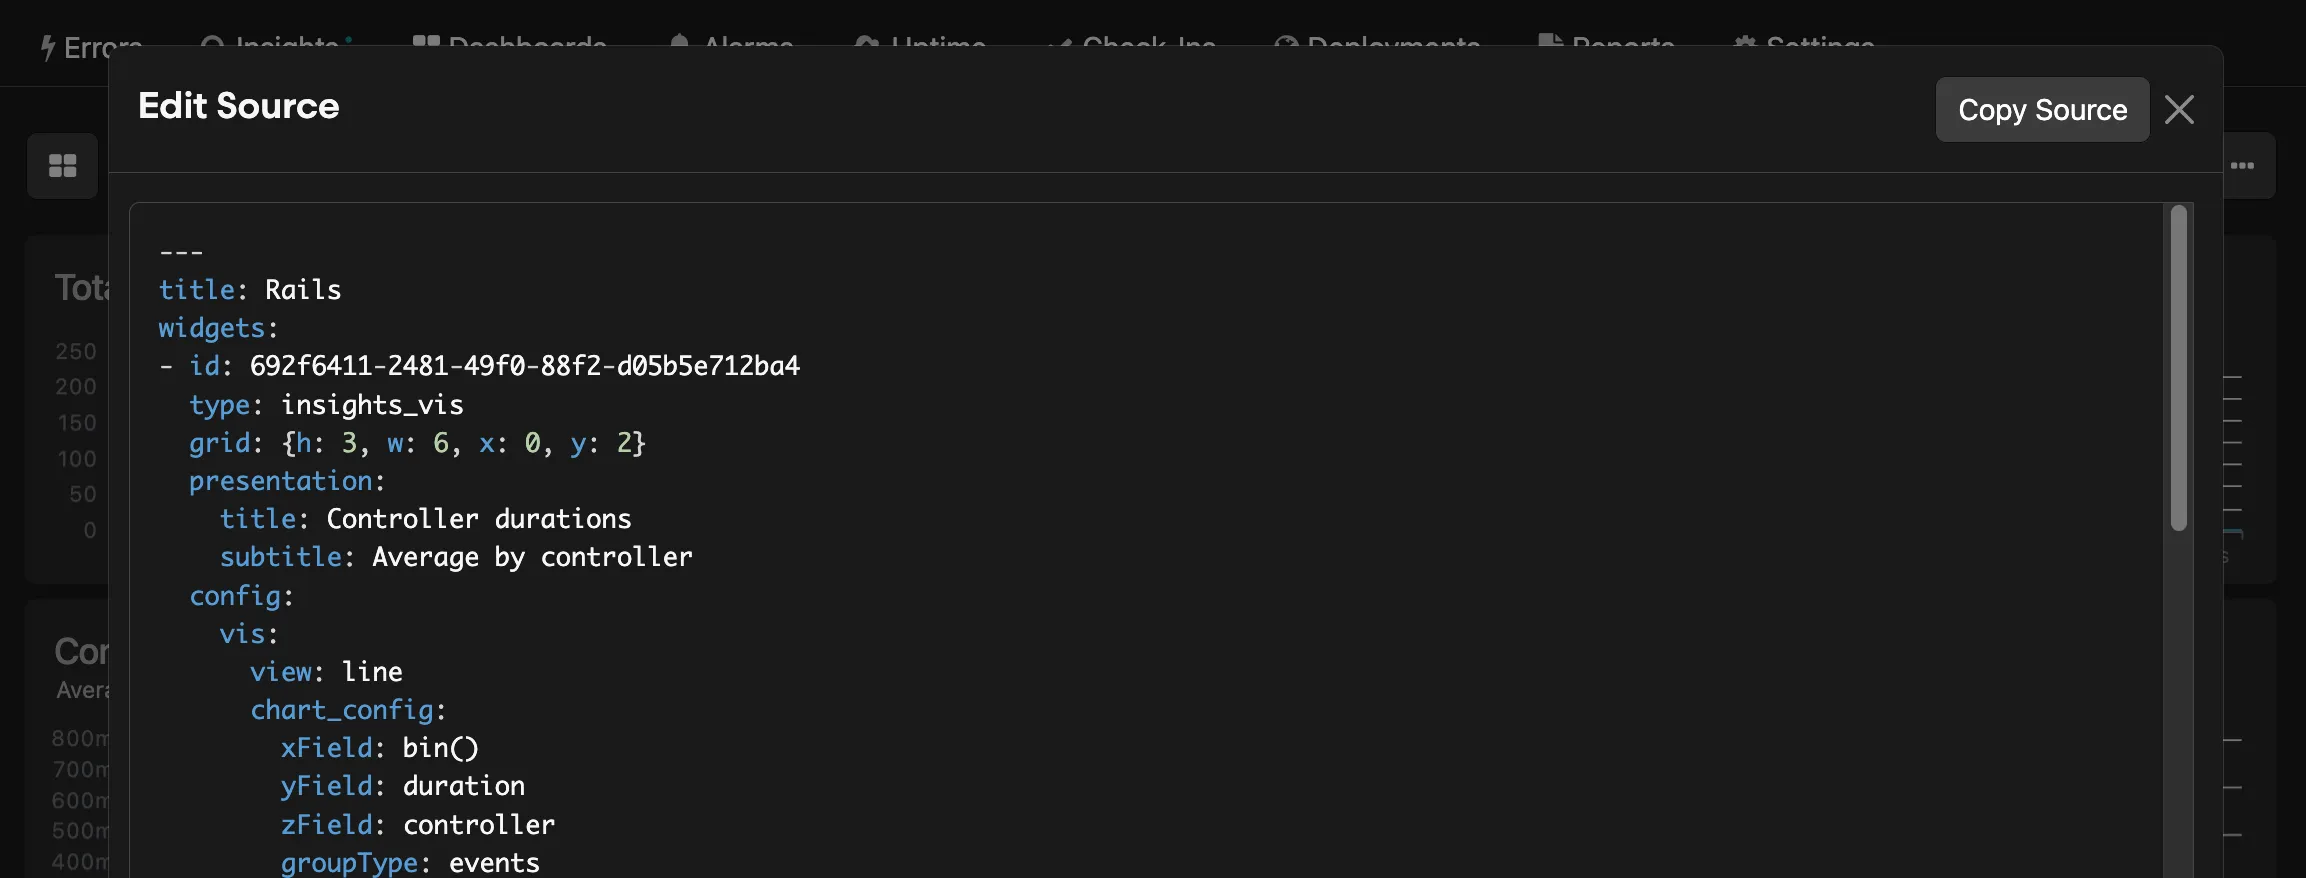
Editing dashboard source
Section titled “Editing dashboard source”For advanced customization, select Edit source to view and modify the entire dashboard configuration as YAML. This is useful for:
- Making bulk changes without navigating the UI
- Copying dashboards between projects
- Sharing configurations with team members
The editor validates your configuration against a predefined schema and displays helpful error messages if something’s wrong. Stream IDs are automatically converted to human-readable names, so you don’t need to manually update identifiers when moving configurations between projects.
Available dashboards
Section titled “Available dashboards”Next steps
Section titled “Next steps”- Learn more about Honeybadger Insights
- Try BadgerQL to explore your data and create custom dashboard widgets
- Set up Insights Alarms to turn your queries into actionable alerts
- Send additional data from your infrastructure to Honeybadger