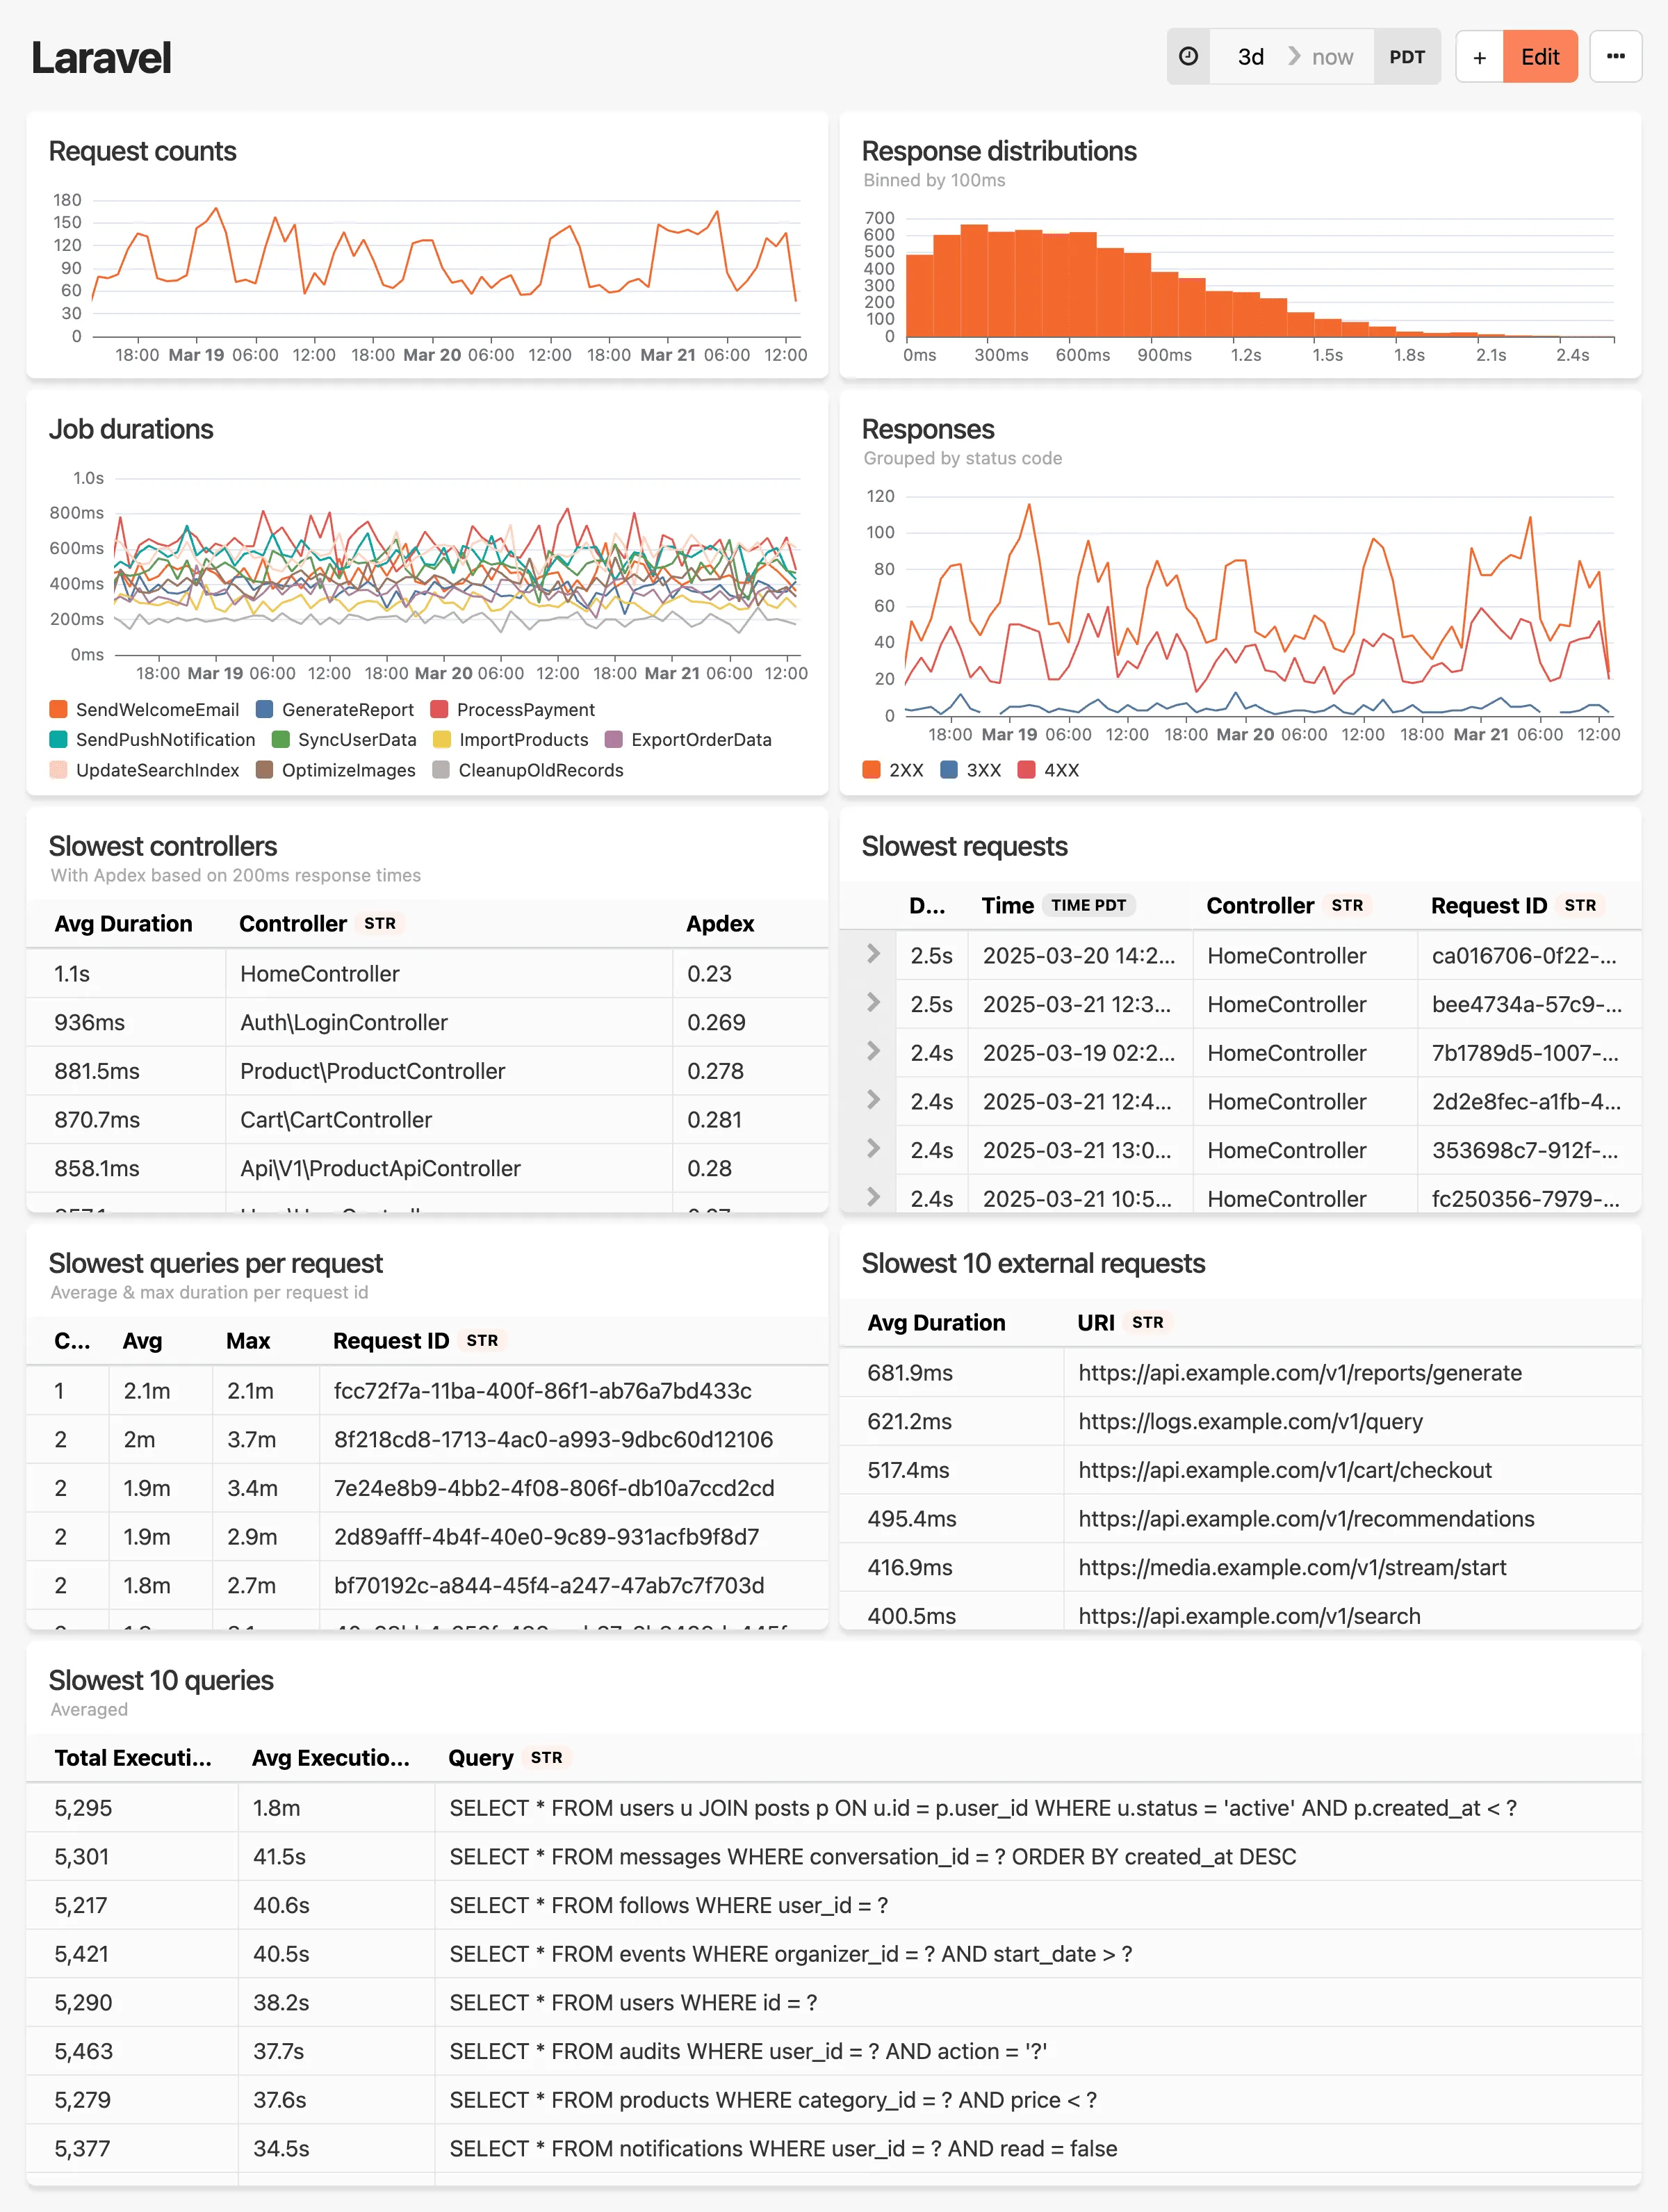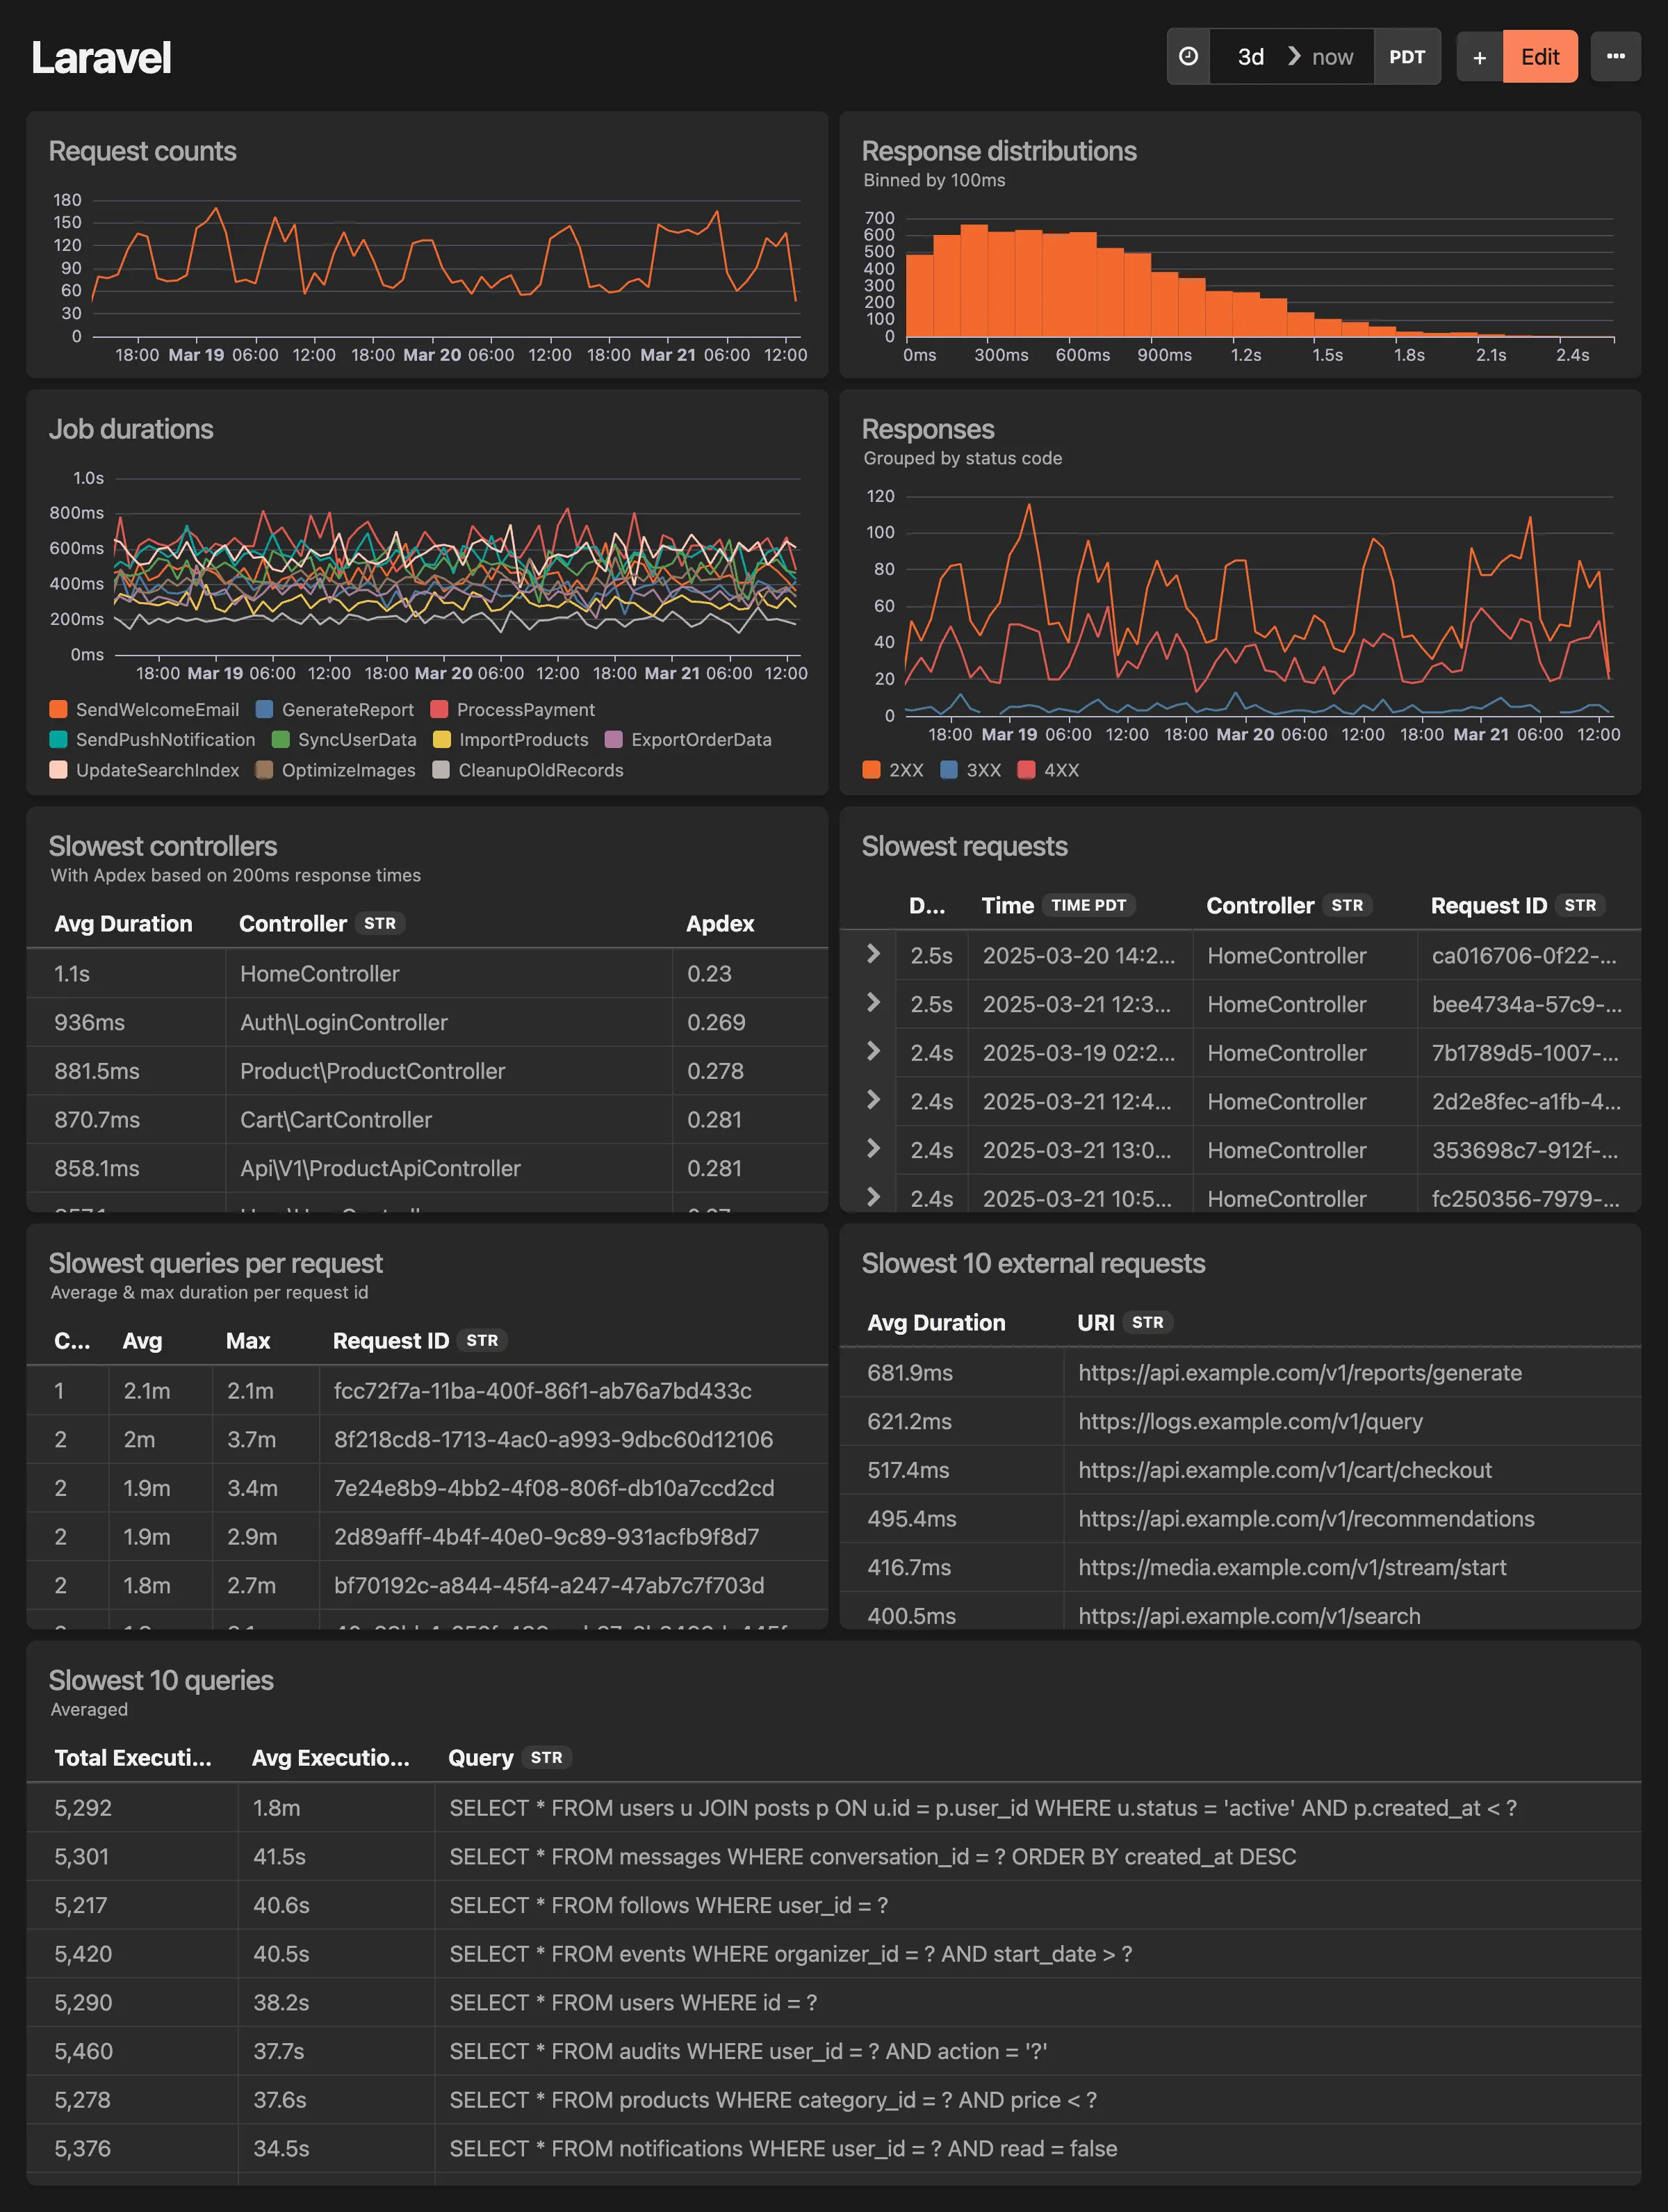
Laravel dashboard
Drop in Dashboard for your Laravel instrumentation data
This dashboard includes:
- Total requests over time
- Response distributions binned by 100ms
- Job durations over time
- Slowest controllers w/ Apdex score
- Overall slowest requests
- Slowest overall queries & slowest queries per request
- Slowest external requests
To get started, make sure you have updated your honeybadger-laravel package to >= 4.2.0 , then enable Insights instrumentation by including this in your config/honeybadger.php:
'events' => [ 'enabled' => true ]