Sidekiq Metrics dashboard
Drop in Dashboard for your Sidekiq metrics data
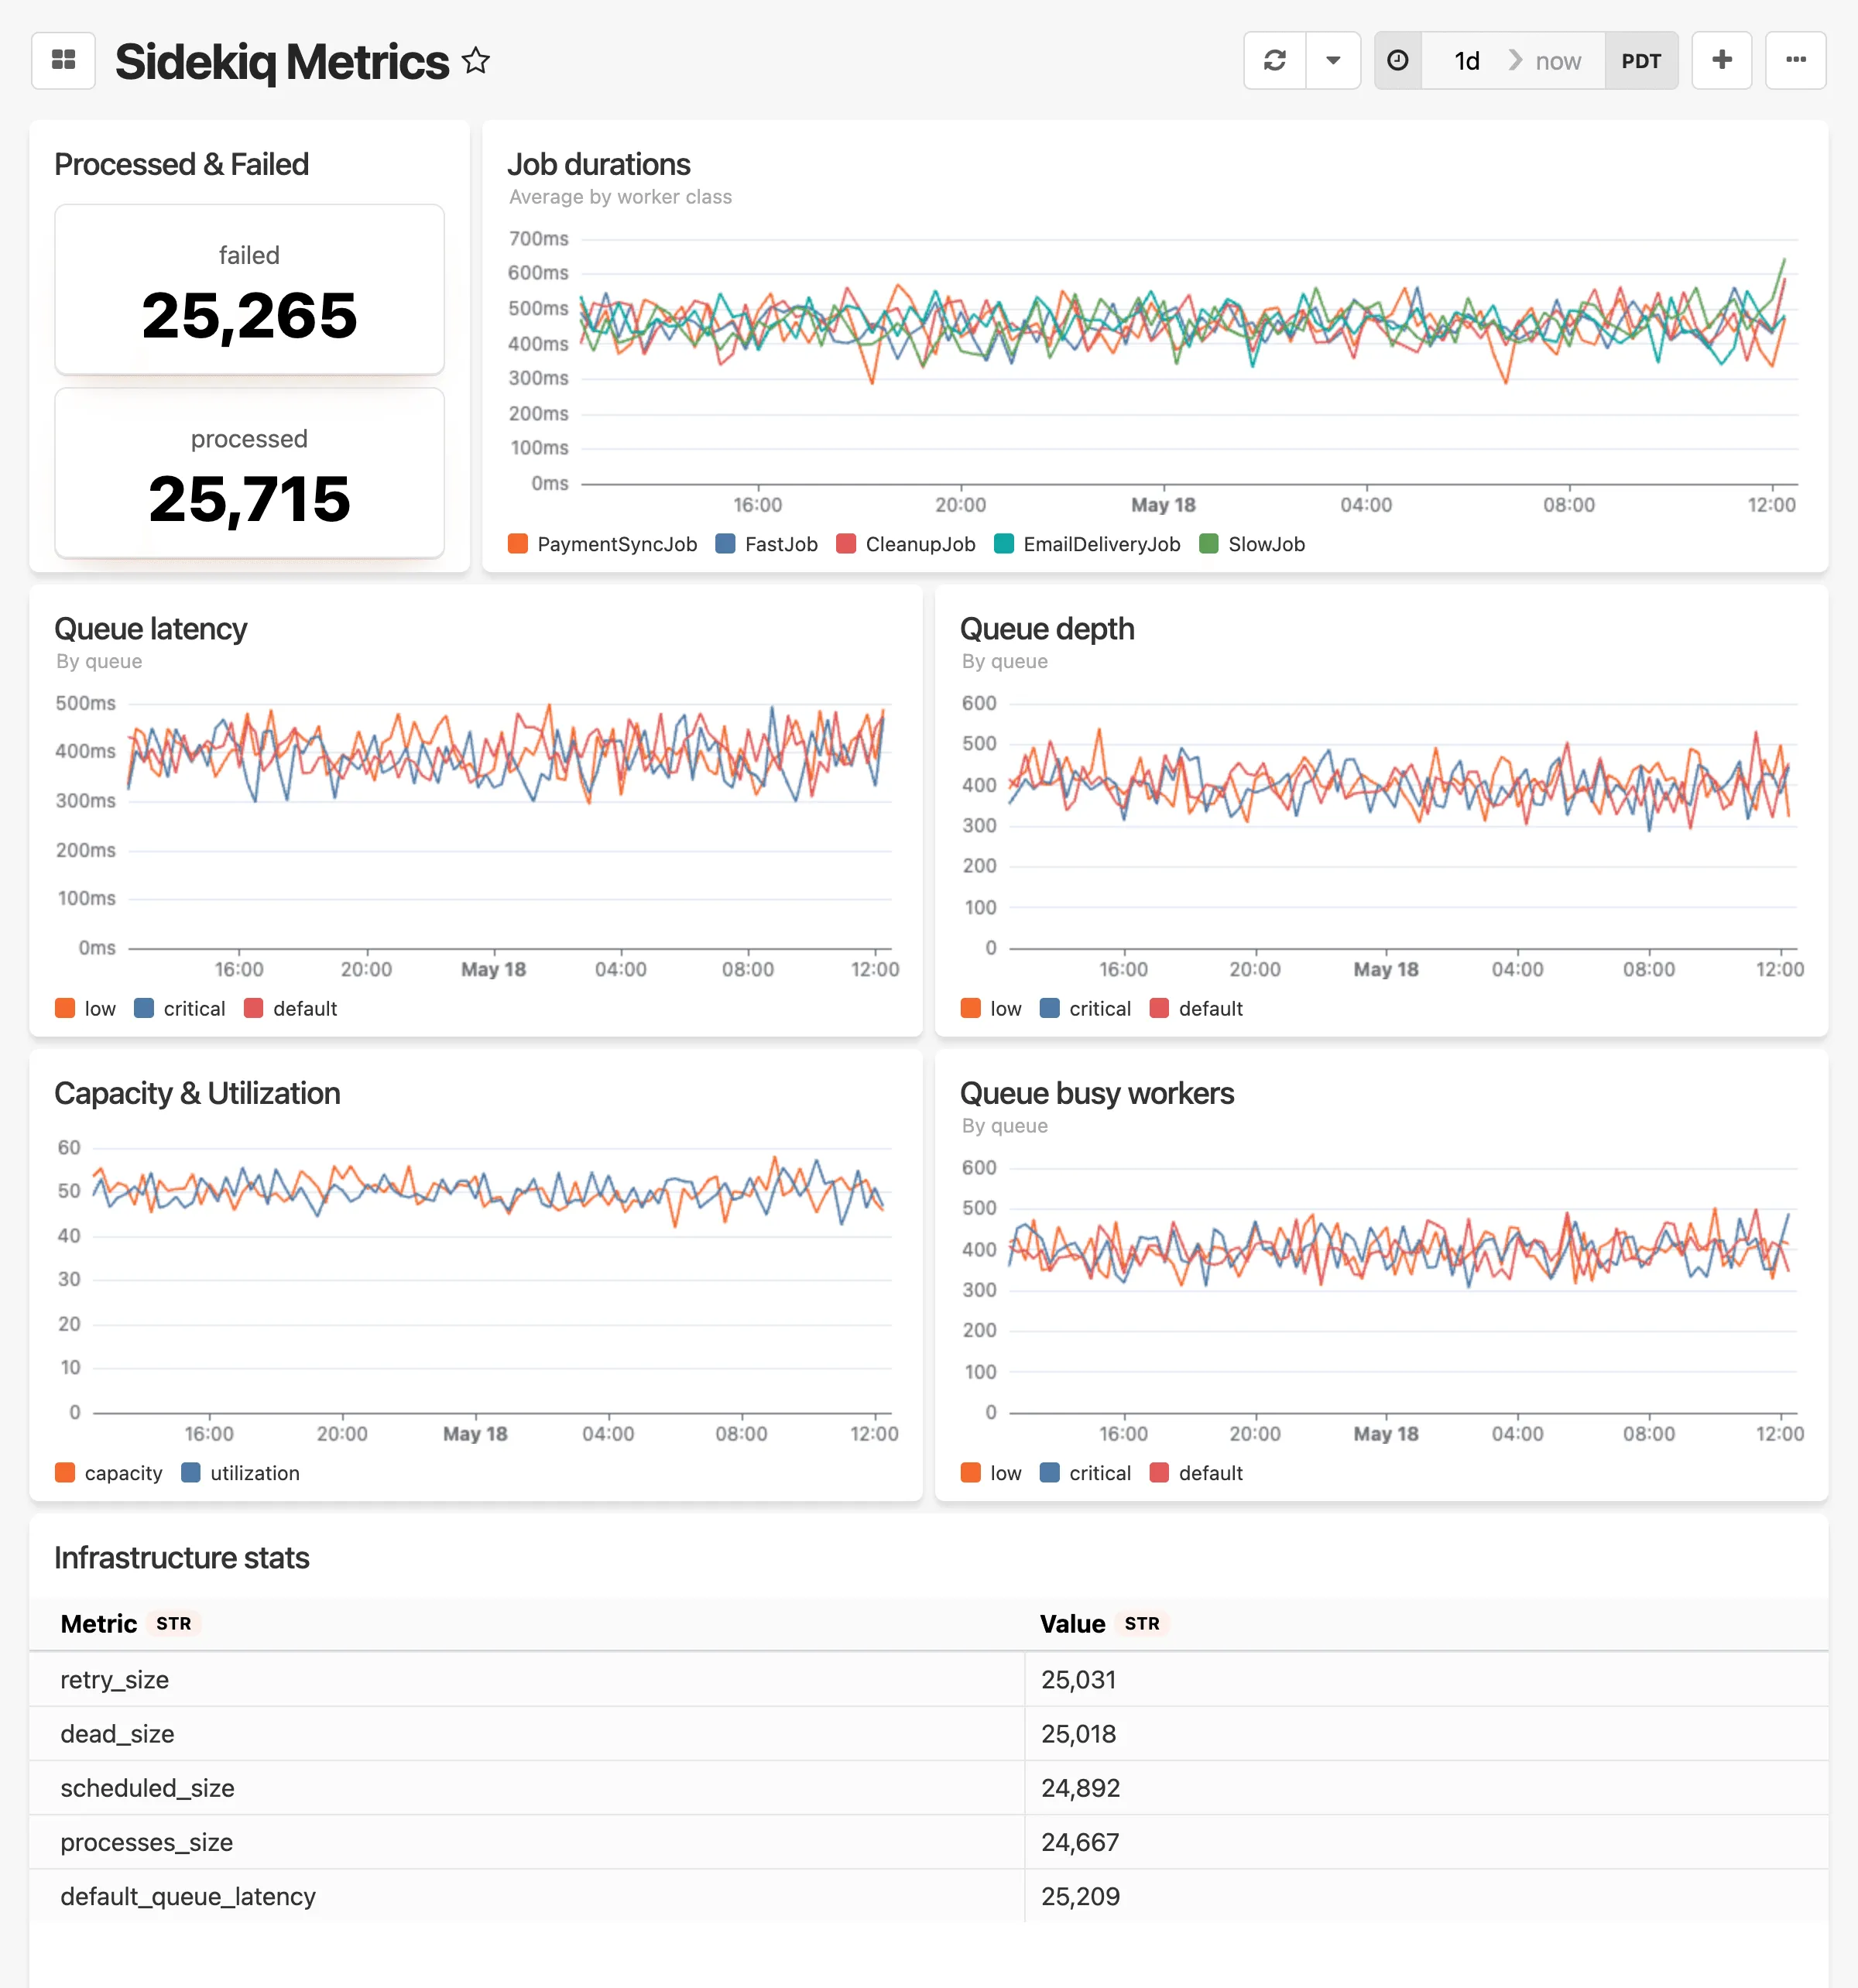
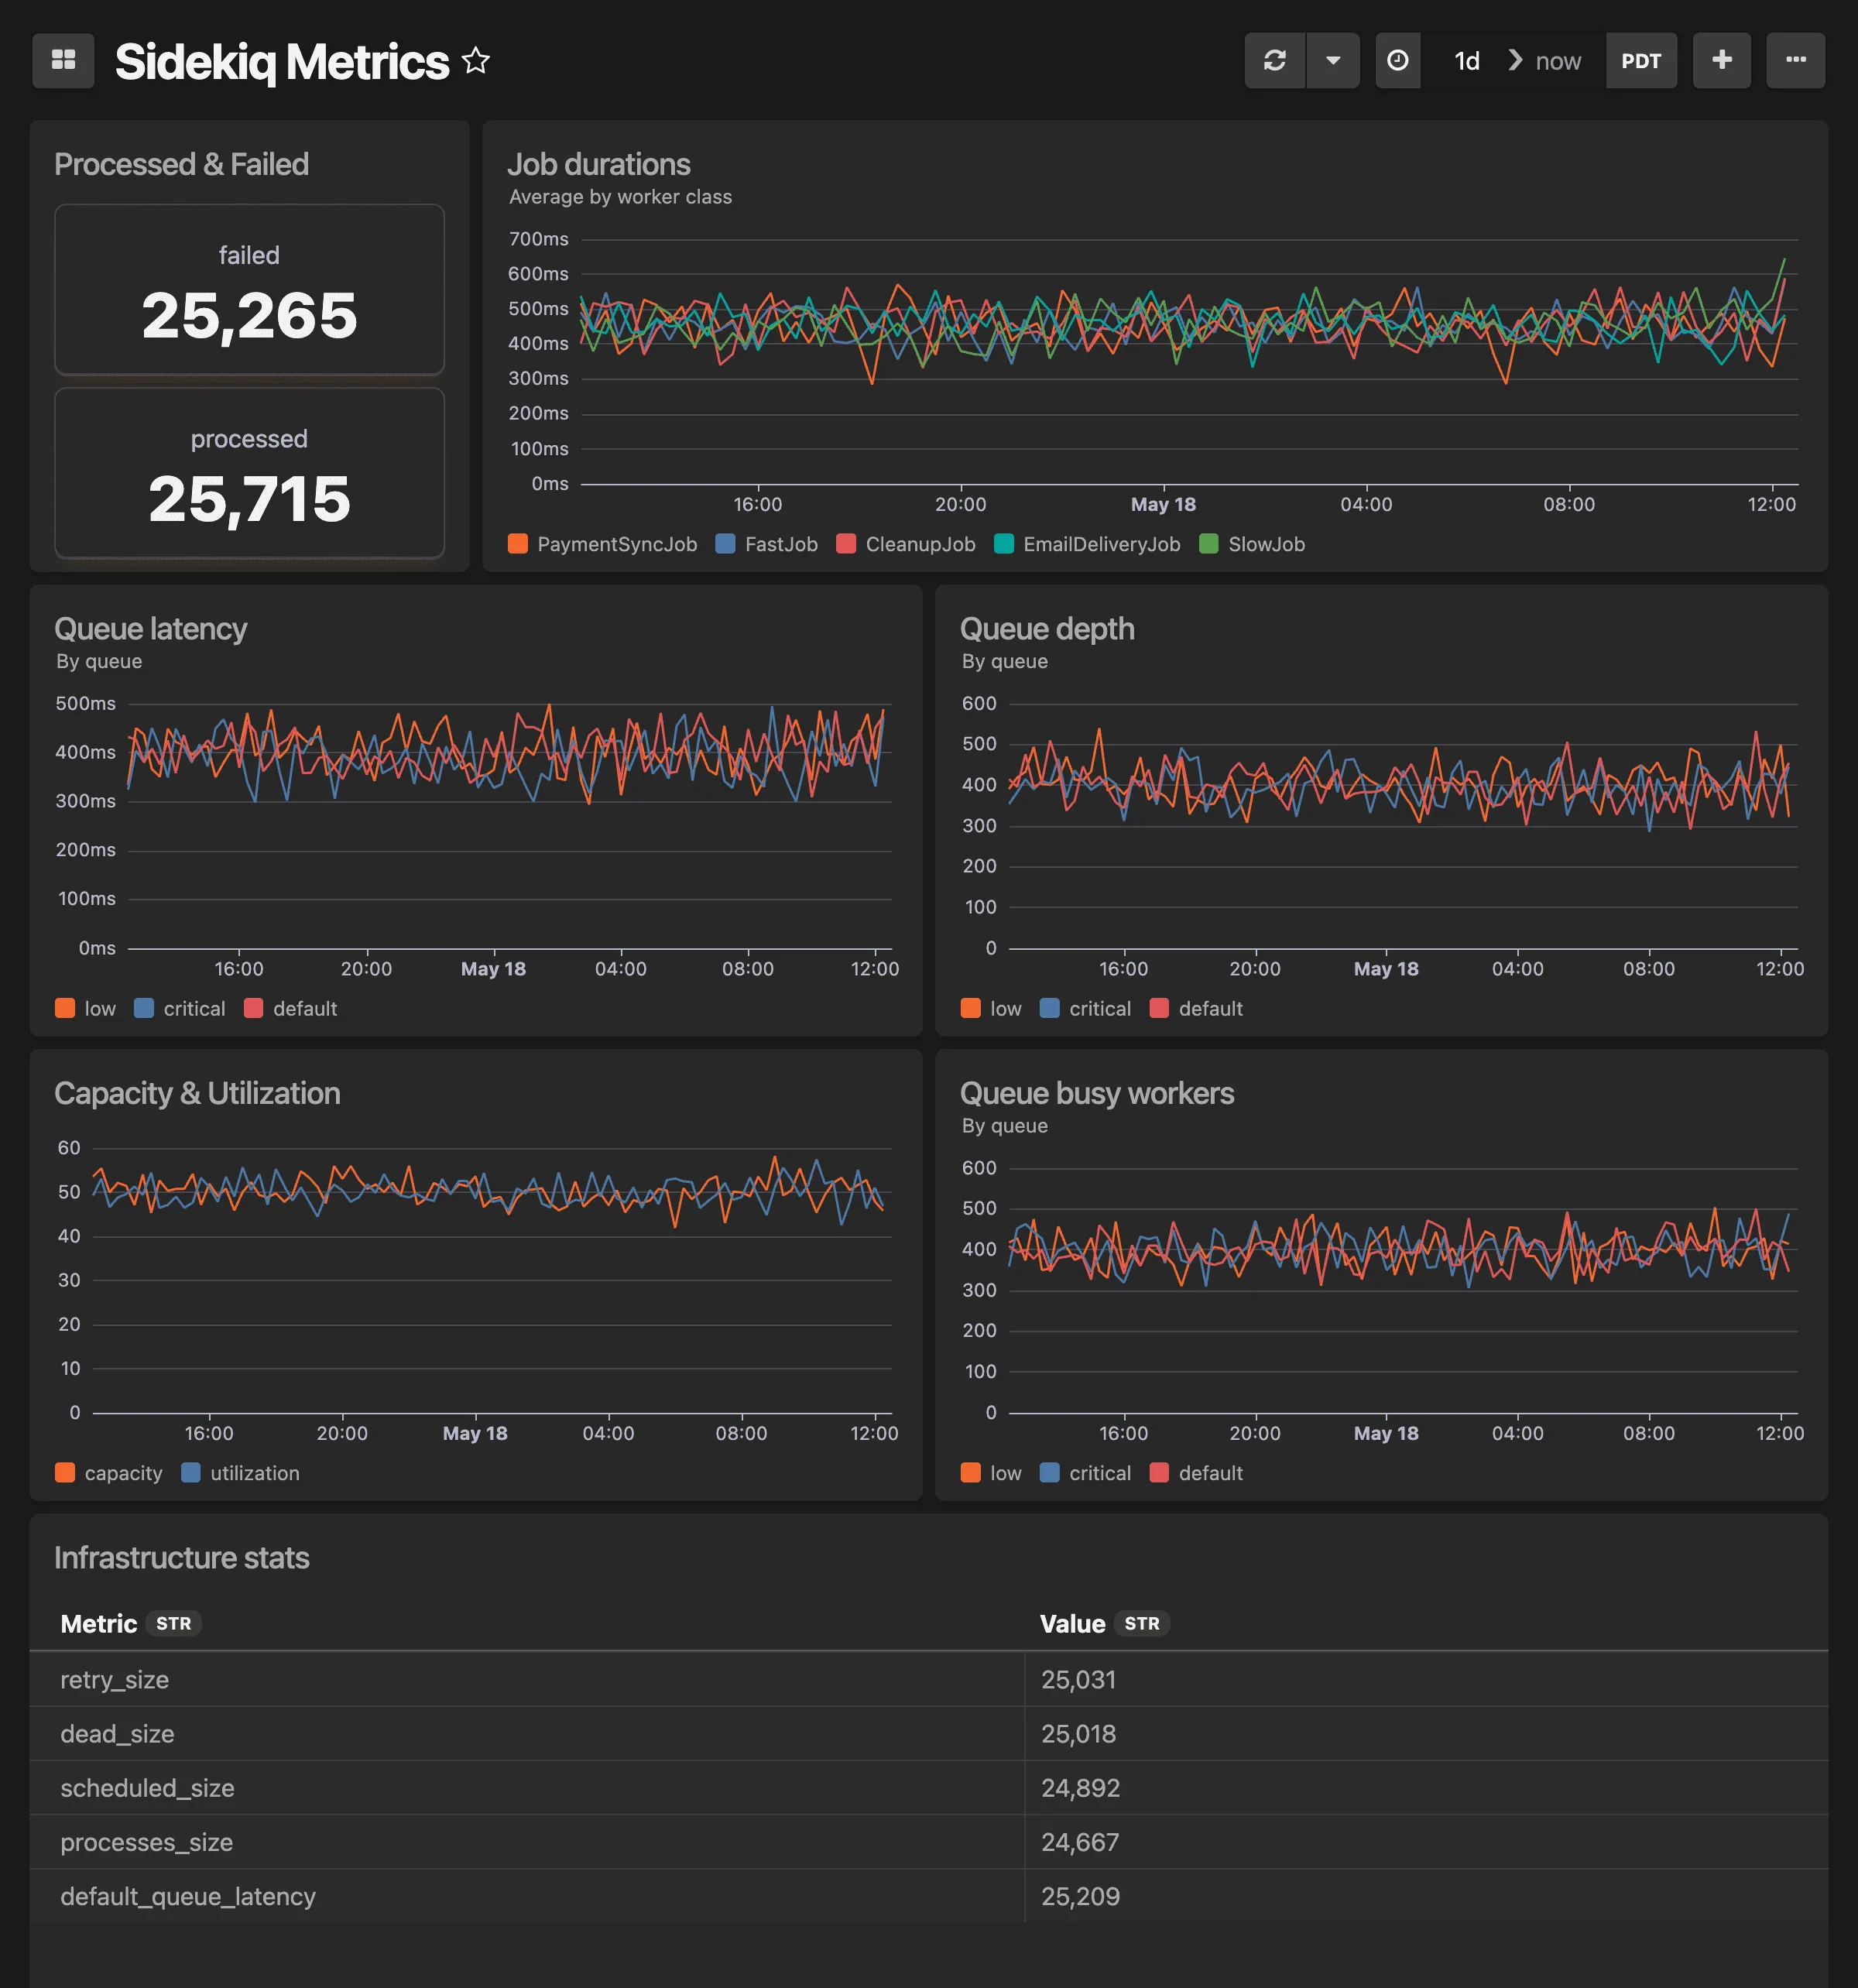
This is the metrics-based counterpart to the Sidekiq (events) dashboard. In addition to job performance data, this dashboard includes infrastructure metrics like queue depth, latency, capacity, and utilization that are unique to the metrics pipeline.
This dashboard includes:
- Job durations by worker over time
- Queue latency and depth per queue
- Capacity and utilization
- Infrastructure stats (processed, failed, scheduled, retry, dead)
To get started, make sure you have updated your Honeybadger gem to >= 5.11, then enable Insights metrics by including this in your config/honeybadger.yml:
insights: enabled: truesidekiq: insights: metrics: trueCheck out the Honeybadger client documentation for more information.