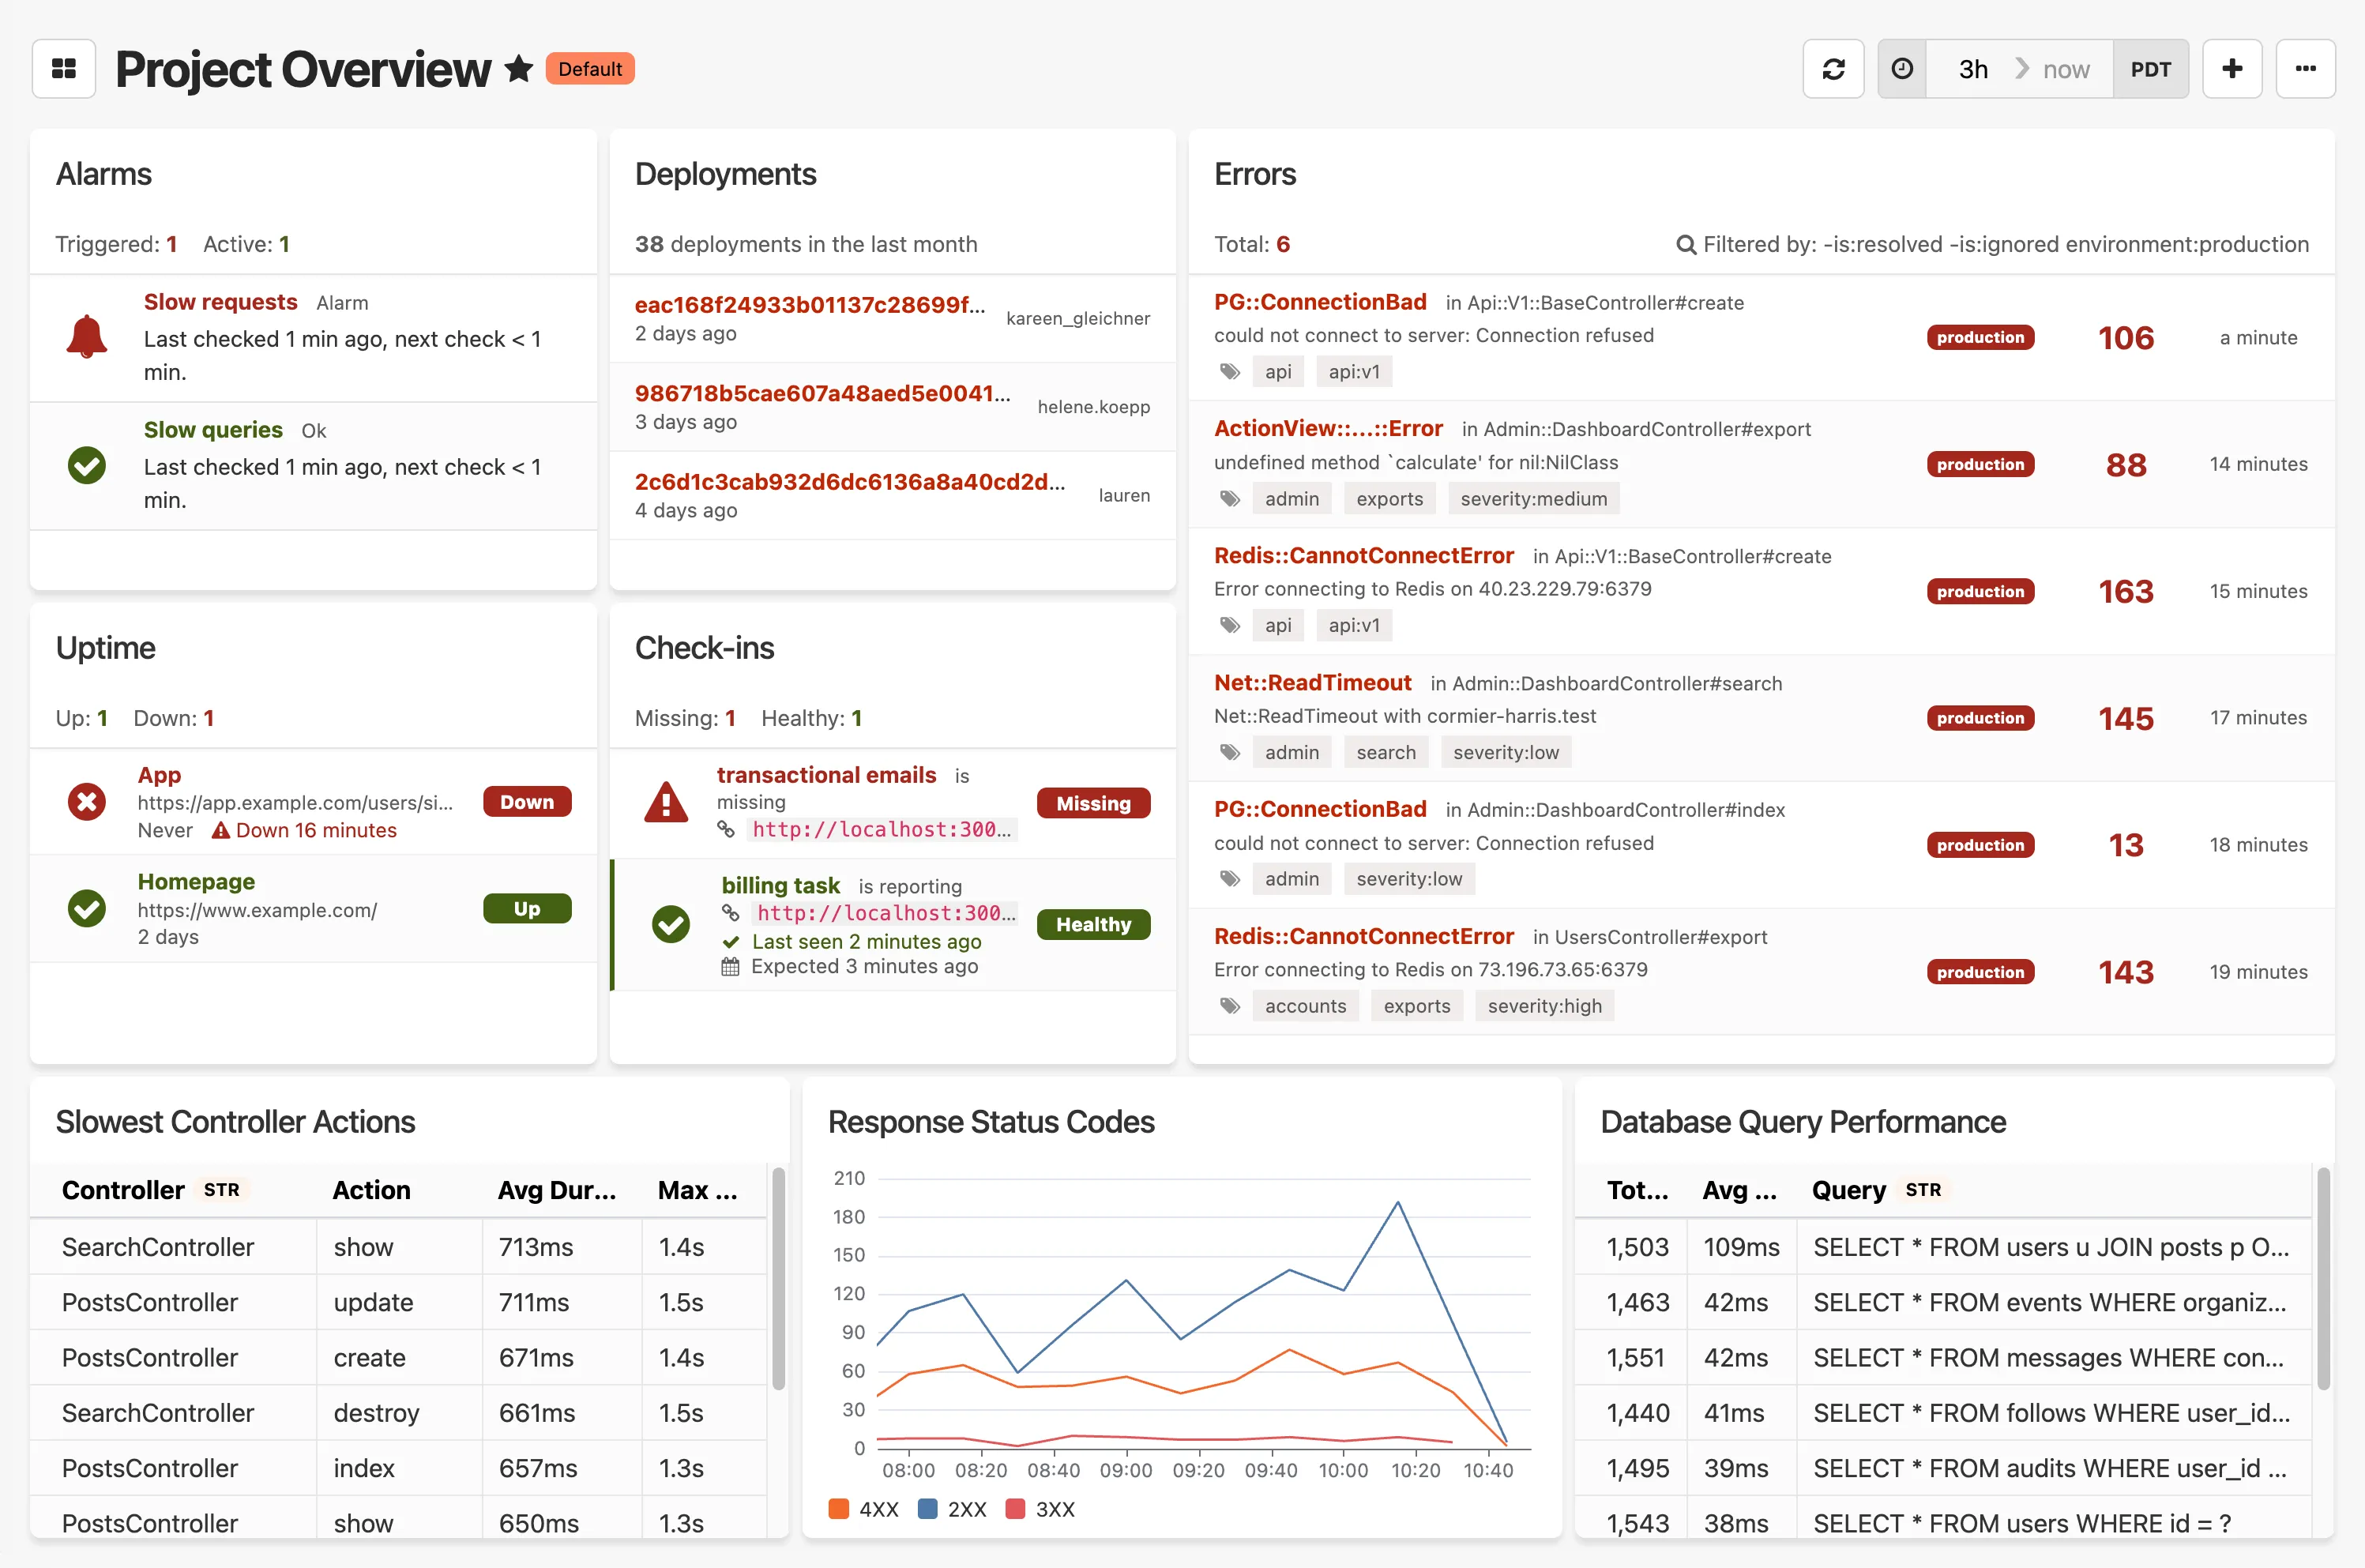
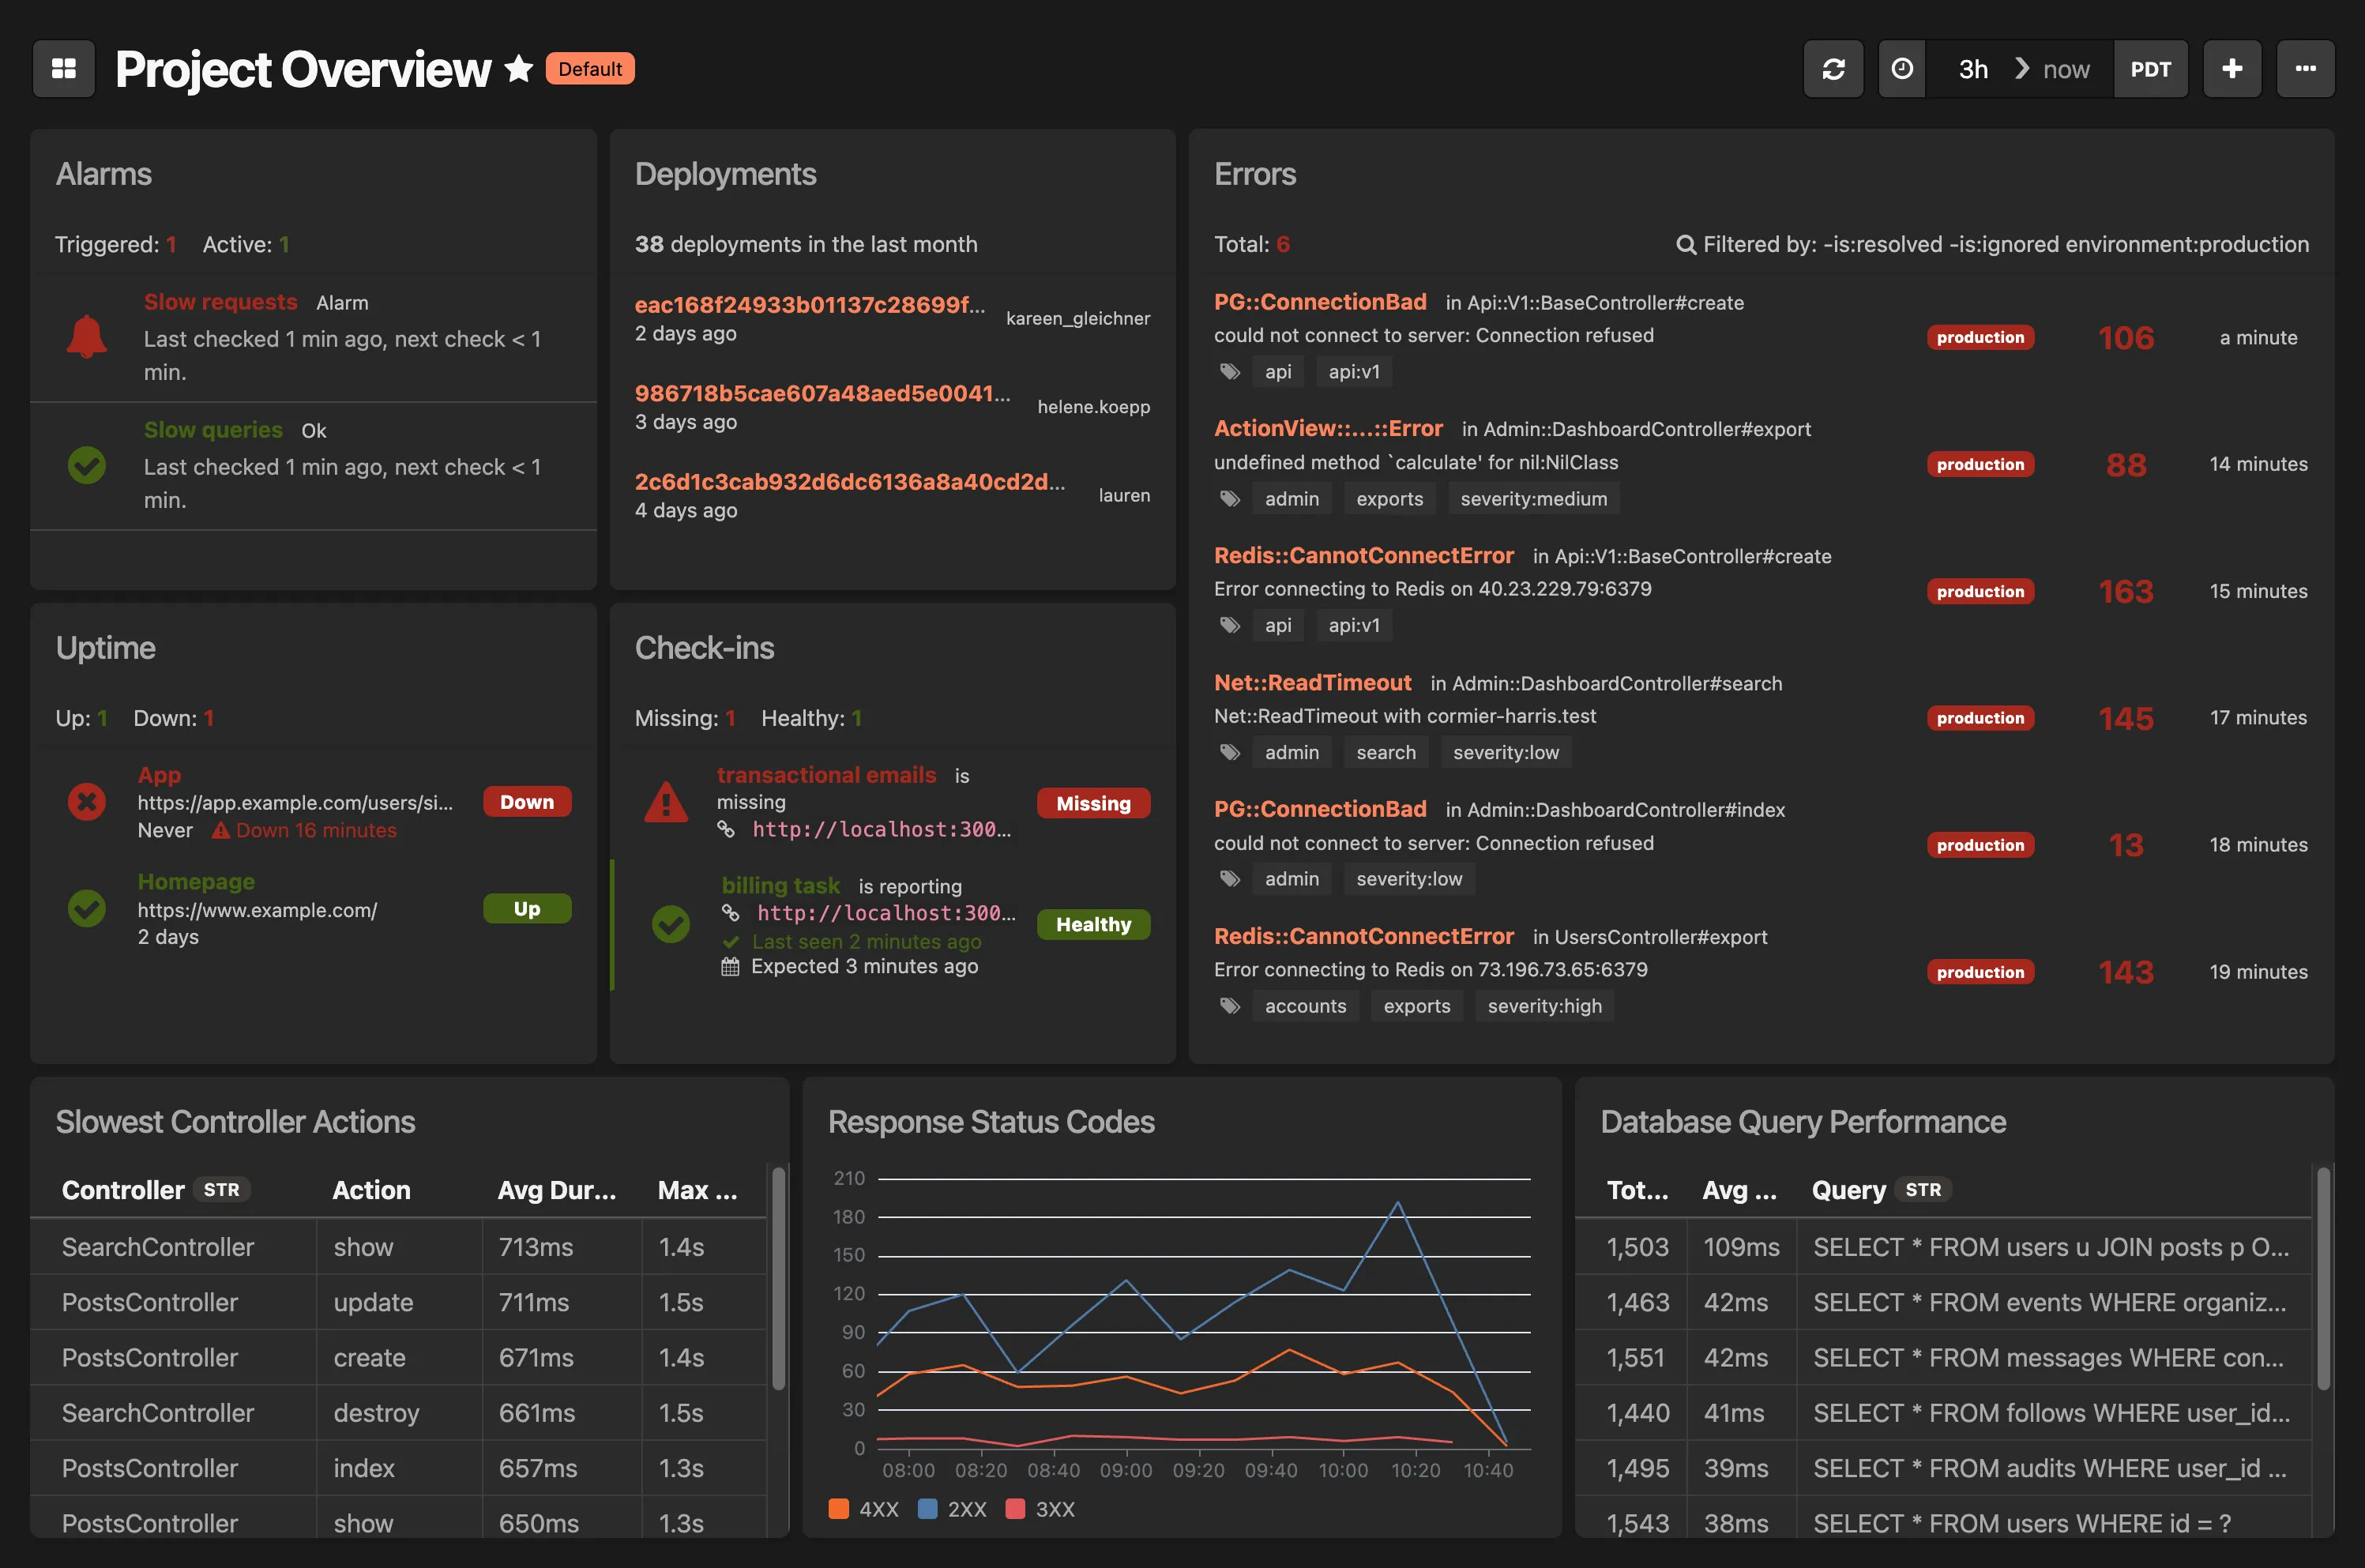
Project Overview dashboard
The Project Overview dashboard provides a comprehensive view of your application’s health and is automatically added to every new Honeybadger project.
This dashboard includes:
- Alarms: Triggered and active alarms with recent check status
- Deployments: Recent deployment activity
- Errors: Top errors affecting your application
- Uptime: Monitor status and response times
- Check-ins: Health check status for critical services
- Dynamic widgets (these may vary for your application):
- Slowest Controller Actions: Performance bottlenecks
- Response Status Codes: HTTP response trends
- Database Query Performance: Query execution metrics